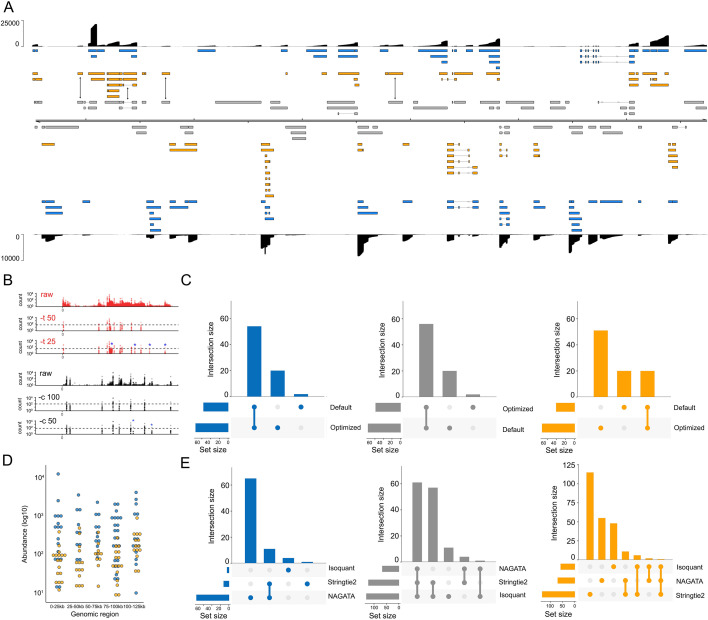
Fig 6.
Reconstructing the varicella-zoster virus transcriptome. (A) Schematic depicting the VZV strain Dumas transcriptome as constructed by NAGATA using a single previously published DRS data set (14). Read coverage is shown for each strand (black) with the y-axis denoting read depth. Transcripts are colored according to classification (orange = not recorded in existing annotation, blue = recorded in existing annotation, gray = reported in existing annotation but not detected by NAGATA in this data set). Wide and thin boxes indicate canonical CDS domains and UTRs, respectively. (B) Close-up of the forward strand TSS (red) and CPAS (black) pileups across the first 25 kb of the VZV genome. Tracks shown include the raw (pre-filtered) data and the effect of filtering using different values for TSS (-t) and -c. (C) Upset plot denoting the number of transcripts reported by NAGATA using the default and VZV-optimized configurations. (D) For each detected transcript in a given transcription unit, a raw abundance count was generated using NAGATA and color-coded according to transcript classification. For simplicity, the dot plot is divided into 25 kb windows. (E) Upset plots denoting the number of transcripts reported by NAGATA, StringTie2 (18), and Isoquant (20), segregated according to (blue) overlaps with existing annotation, (gray) not detected, and (red) not present in original annotation.

