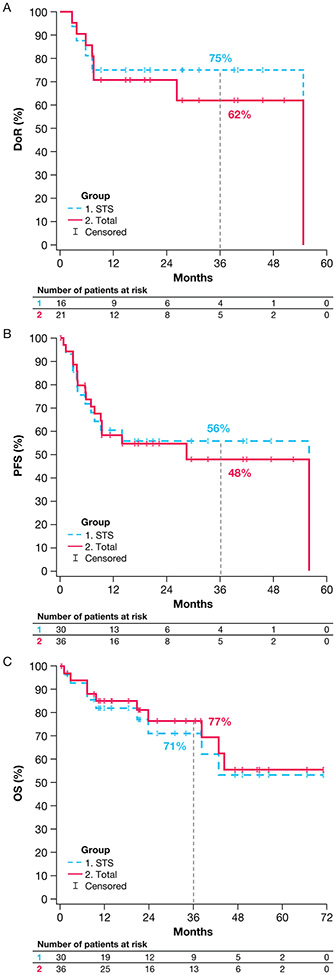
Figure 3.
Kaplan-Meier plots showing (A) DoR for the full sarcoma cohort and the STS subgroup, (B) PFS for the full sarcoma cohort and the STS subgroup, and (C) OS for the full sarcoma cohort and the STS subgroup.
DoR, duration of response; OS, overall survival; PFS, progression-free survival; STS, soft tissue sarcoma.

