Abstract
This study investigated the impact of novel copper ionophores on the prognosis of clear cell renal cell carcinoma (ccRCC) and the tumor microenvironment (TME). The differential expression of 10 cuproptosis and 40 TME-pathway-related genes were measured in 531 tumor samples and 71 adjacent kidney samples in The Cancer Genome Atlas database. A risk score model was constructed with LASSO cox to predict the prognosis of ccRCC patients. Forest plot and function enrichment were used to study the biological function of the key genes in depth. The study found that the risk score model accurately predicted the prognosis of ccRCC patients. Patients with high scores had higher immune responses with a higher proportion of anti-tumor lymphocytes and a lower proportion of immunosuppressive M2-like macrophages. However, the high-score group also exhibited a higher proportion of T follicular helper cells and regulatory T cells. These results suggest that cuproptosis-based therapy may be worth further investigation for the treatment of ccRCC and TME. Subsequently, by using RNAi, we established the stable depletion models of FDX1 and PDHB in ccRCC cell lines 786-O and ACHN. Through CCK8, colony formation, and Transwell assays, we observed that the knockdown of FDX1 and PDHB could significantly reduce the capabilities of proliferation and migration in ccRCC cells. In conclusion, this study illuminates the potential effectiveness of copper ionophores in the treatment of ccRCC, with higher risk scores correlating with better TME immune responses. It sets the stage for future cuproptosis-based therapy research in ccRCC and other cancers, focusing on copper’s role in TME.
Keywords: Cuproptosis, TME, ccRCC, Immune response, Immunosuppressive
Subject terms: Cancer, Immunology
Introduction
Renal cell carcinoma (RCC) is a common worldwide malignant tumor that ranks 10th place in its occurrence among men and women and is estimated to have 79,000 new cases and caused 13,920 deaths in 20221. Originating from renal tubular epithelial cells, clear cell renal cell carcinoma (ccRCC) comprises 70–80% of all the subtypes of RCC. Although ccRCC patients have benefitted significantly from the advancement of surgical instruments and strategies, late-stage ccRCC patients, especially metastasis ccRCC patients, still face a high mortality rate2,3. The emergence of immune checkpoint inhibitors (ICIs) represents a therapeutic revolution in the last decade. Several clinical trials have reported that immunotherapy has become an effective therapeutic strategy for a variety of solid tumors, including RCC4–6. The mechanism of action of ICI is based on the activation of the immune system, which can modulate T lymphocytes and target immune checkpoints such as programmed cell death protein 1 (PD-1) and programmed cell death ligand 1 (PD-L1)7. Previous studies have demonstrated the safety and efficacy of immunotherapies such as ipilimumab plus nivolumab combination in the treatment of metastatic RCC8,9. In this regard, a deeper understanding of the immune characteristics of RCC is of great significance to improve the efficacy of immunotherapy.
Copper has been documented as an essential trace element in almost every organism, from bacteria to human cells10. The transmembrane concentration gradient dampens the overload of intracellular copper which should be fatal to cell fate. Hence it maintains a shallow concentration of intracellular copper10,11. In normoxic conditions, accumulating intracellular copper ionophores induce a unique copper-associated cell death, cuproptosis, by targeting lipoylated tricarboxylic acid (TCA) cycle proteins regulated by mitochondrial respiration12. Moreover, the abundant FDX1, the key gene of cuproptosis, is closely related to a variety of cancer cell lines, suggesting that the novel copper ionophore agents such as disulfiram, dithiocarbamates, and elesclomol should be considered as a potential target for anti-tumor therapy12,13. ccRCC is genetically characterized as a Von Hippel-Lindau (VHL) gene mutation and consequently leads to the stabilized expression of hypoxia-inducible factor (HIF)14 which would attenuate cuproptosis12. Therefore, the genotypic modification of the cuproptosis and cuproptosis-induced immune infiltration of tumor microenvironment (TME) in ccRCC remains to be demonstrated. Understanding the relationship between cuproptosis and TME changes is essential for creating impactful treatments, particularly for advanced ccRCC. This study is aligned with the broader scope of oncological research, which is delving into the role of copper in cancer, the distinct molecular features of ccRCC, and emerging therapeutic developments. The amalgamation of these elements underscores the criticality of examining how the dynamics of cuproptosis and TME modifications interact with clinical outcomes in ccRCC, thereby offering pivotal insights for the advancement of cancer treatment.
Our present study aims to generally explore the alterations of cuproptosis and TME-related pathways and their association with the clinical outcomes in ccRCC. Our findings highlight the correlation between cuproptosis, cuproptosis-related TME changes, and clinical outcomes in ccRCC and provide a theoretical basis for further research on cuproptosis-related TME and treatment options.
Results
Estimating differentially expressed cuproptosis-related and tumor microenvironment pathway genes in KIRC
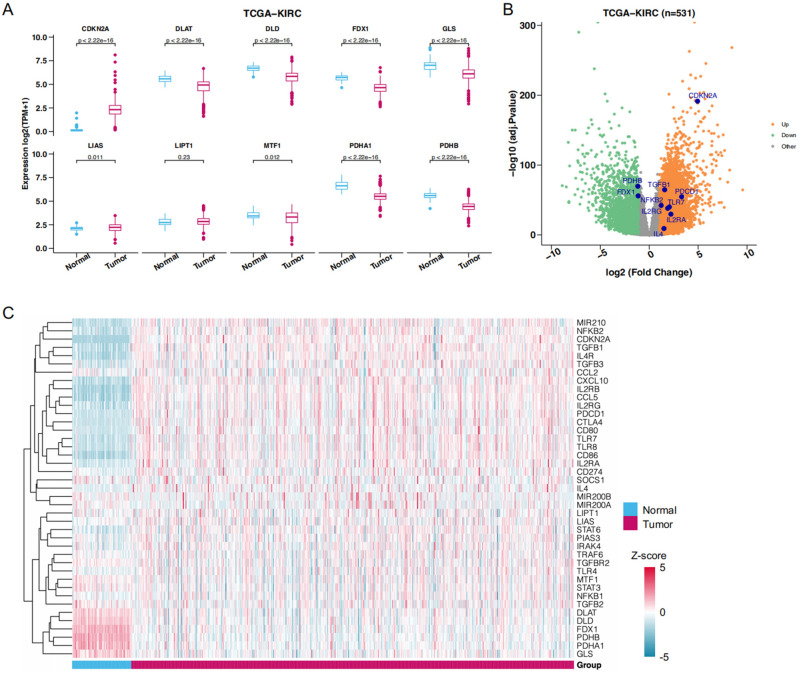
To determine whether there is a difference in cuproptosis programs between normal and tumor tissues in ccRCC, we queried 71 normal and 531 tumor tissue samples of the TCGA-KIRC database for the expression of 10 cuproptosis-related genes. As shown in Fig. 1A, FDX1, PDHA1, PDHB, GLS, DLD, and DLAT expressions were significantly decreased in tumor tissues compared with normal tissues, and LIAS and MTF1 were modestly but significantly downregulated. However, LIPIT1 was no statistically different expression between normal and tumor tissues. In contrast, CDKN2A was significantly up-regulated in tumor tissues.
Figure 1.
DEGs between normal and tumor tissues. (A) Differential expression of 10 cuproptosis related genes in normal and tumor tissues. (B) The volcano map showed the expression level of the key genes in TCGA-KIRC. (C) The expression profiles of cuproptosis-related genes and TME-pathway-related genes.
We subsequently analyzed 40 TME-associated genes extracted from the TME-related signaling pathways. We identified 21 DEGs common to cuproptosis and TME after discarding nonexpressing ones. The expression patterns of the 21 genes are shown in Fig. 1C, and we identified 5 and 16-cuproptosis-related and TME-related genes as two different DEG sets by visualizing their expression levels using the volcano plot (Fig. 1B).
Identifying the key cuproptosis-related and tumor microenvironment pathway genes alteration in TCGA-KIRC training cohort
A total of 531 ccRCC patients were randomly divided into two cohorts according to their median survival time, including a high-risk group with 266 patients and a low-risk group with 265 patients. After that, we randomly selected 100 patients from each of the high-risk and low-risk groups to form the validation cohort and use the remaining 331 patients as the training cohort. The clinical characteristics of ccRCC patients in the training and validation cohort are summarized in Tables 1 and 2.
Table 1.
The clinical characteristic information of patients from the training cohort with ccRCC in The Cancer Genome Atlas database related genes.
| Training | TCGA-KIRC | High risk score | Low risk score |
|---|---|---|---|
| Cohort | (n = 331) | (n = 166) | (n = 165) |
| Number of patients | 531 | 266 | 265 |
| T_Stage | |||
| T1 | 160 (48.34%) | 64 (38.55%) | 96 (58.18%) |
| T2 | 42 (12.69%) | 22 (13.25%) | 20 (12.12%) |
| T3 | 120 (36.25%) | 71 (42.77%) | 49 (29.70%) |
| T4 | 9 (2.72%) | 9 (5.42%) | 0 (0.00%) |
| N_Stage | |||
| N0 | 149 (45.02%) | 73 (43.98%) | 76 (46.06%) |
| N1 | 13 (3.93%) | 7 (4.22%) | 6 (3.64%) |
| NX | 169 (51.06%) | 86 (51.81%) | 83 (50.30%) |
| M_Stage | |||
| NA | 1 (0.30%) | 1 (0.60%) | 0 (0.00%) |
| M0 | 262 (79.15%) | 123 (74.10%) | 139 (84.24%) |
| M1 | 51 (15.41%) | 34 (20.48%) | 17 (10.30%) |
| MX | 17 (5.14%) | 8 (4.82%) | 9 (5.45%) |
| Stage | |||
| NR | 3 (0.91%) | 2 (1.20%) | 1 (0.61%) |
| Stage I | 156 (47.13%) | 62 (37.35%) | 94 (56.97%) |
| Stage II | 34 (10.27%) | 16 (9.64%) | 18 (10.91%) |
| Stage III | 85 (25.68%) | 50 (30.12%) | 35 (21.21%) |
| Stage IV | 53 (16.01%) | 36 (21.69%) | 17 (10.30%) |
| OS | |||
| Mean | 1340.29 | 1191.33 | 1490.15 |
| Median | 1218.00 | 1138.50 | 1314.00 |
| Age | |||
| ≤ 60 | 160 (48.34%) | 81 (48.80%) | 79 (47.88%) |
| > 60 | 171 (51.66%) | 85 (51.20%) | 86 (52.12%) |
| Gender | |||
| Female | 114 (34.44%) | 49 (29.52%) | 65 (39.39%) |
| Male | 217 (65.56%) | 117 (70.48%) | 100 (60.61%) |
Table 2.
The clinical characteristic information of patients from the validation cohort with ccRCC in The Cancer Genome Atlas database related genes.
| Validation | TCGA-KIRC | High risk score | Low risk score |
|---|---|---|---|
| Cohort | (n = 200) | (n = 100) | (n = 100) |
| Number of patients | 531 | 266 | 265 |
| T_Stage | |||
| T1 | 111 (55.50%) | 46 (46.00%) | 65 (65.00%) |
| T2 | 28 (14.00%) | 14 (14.00%) | 14 (14.00%) |
| T3 | 59 (29.50%) | 38 (38.00%) | 21 (21.00%) |
| T4 | 2 (1.00%) | 2 (2.00%) | 0 (0.00%) |
| N_Stage | |||
| N0 | 90 (45.00%) | 43 (43.00%) | 47 (47.00%) |
| N1 | 3 (1.50%) | 3 (3.00%) | 0 (0.00%) |
| NX | 107 (53.50%) | 54 (54.00%) | 53 (53.00%) |
| M_Stage | |||
| NA | 1 (0.50%) | 1 (1.00%) | 0 (0.00%) |
| M0 | 160 (80.00%) | 74 (74.00%) | 86 (86.00%) |
| M1 | 27 (13.50%) | 18 (18.00%) | 9 (9.00%) |
| MX | 12 (6.00%) | 7 (7.00%) | 5 (5.00%) |
| Stage | |||
| Stage I | 109 (54.50%) | 45 (45.00%) | 64 (64.00%) |
| Stage II | 24 (12.00%) | 13 (13.00%) | 11 (11.00%) |
| Stage III | 38 (19.00%) | 22 (22.00%) | 16 (16.00%) |
| Stage IV | 29 (14.50%) | 20 (20.00%) | 9 (9.00%) |
| OS | |||
| Mean | 1353.58 | 1222.73 | 1484.42 |
| Median | 1109.00 | 992.00 | 1409.00 |
| Age | |||
| ≤ 60 | 107 (53.50%) | 52 (52.00%) | 55 (55.00%) |
| > 60 | 93 (46.50%) | 48 (48.00%) | 45 (45.00%) |
| Gender | |||
| Female | 69 (34.50%) | 34 (34.00%) | 35 (35.00%) |
| Male | 131 (65.50%) | 66 (66.00%) | 65 (65.00%) |
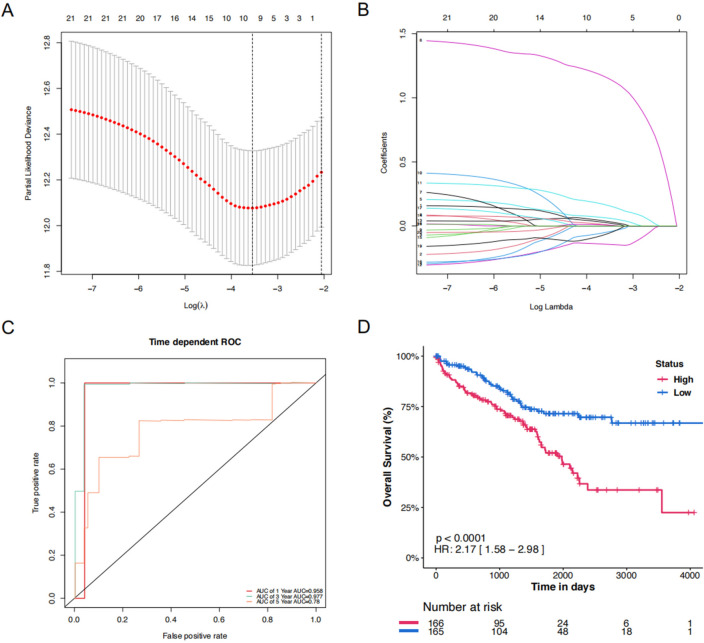
To minimize the risk of overfitting, LASSO regression analysis was conducted on the 21 DEGs using the training cohort (Fig. 2A–B), which helps in selecting the most relevant genes by penalizing the size of the coefficients, thereby enhancing the generalizability and reliability of the predictive model. A prognostic risk signature was then refined and validated using multivariate Cox regression analysis, leading to the identification of 10 key genes (Fig. 2A), including 3 associated with cuproptosis and 7 with the TME pathway. The risk score of the signature was calculated based on the mRNA expression levels of these genes combining linearly with their respective regression coefficients (Table 3).
Figure 2.
Construction of the top 10 key genes signature in the training cohort. (A) The association between deviance and log (Lamba). (B) The association between coefficients of genes and log (Lamba). (C) The predicted OS of time-dependent ROC curve analysis of the top 10 key genes signature in the training cohort. (D) The time-dependent OS rate of the high-score and low-score group.
Table 3.
Top 10 copper and TME-related genes (key genes) expressions in low and high-risk groups.
| Gene | Coefficient | Regulation | HR | 95%CI | P value |
|---|---|---|---|---|---|
| NFKB2 | 0.03515156 | Up | 1.41 | (1.06, 1.86) | 0.017 |
| TGFB1 | 0.06167755 | Up | 1.35 | (1.07, 1.7) | 0.012 |
| IL4 | 1.15360967 | Up | 5 | (2.54, 9.86) | < 0.001 |
| IL2RA | 0.16078225 | Up | 1.31 | (1.1, 1.55) | 0.002 |
| FDX1 | − 0.1433672 | Down | 0.61 | (0.44, 0.83) | 0.002 |
| IL2RG | 0.02400565 | Up | 1.21 | (1.02, 1.44) | 0.029 |
| CDKN2A | 0.00806681 | Up | 1.25 | (0.99, 1.57) | 0.056 |
| PDHB | − 0.0472666 | Down | 0.62 | (0.44, 0.88) | 0.008 |
| PDCD1 | 0.00714973 | Up | 1.16 | (1.03, 1.32) | 0.019 |
| TLR7 | − 0.0600337 | Up | 0.92 | (0.79, 1.08) | 0.309 |
Figure 2C shows time-dependent ROC curves for predicting OS at 1, 3, and 5 years with AUC values of 0.958, 0.977, and 0.78, which indicate that the 10 key genes predict the ccRCC patient survival outcomes. Moreover, in the training cohort, it was observed that the low-risk group was likely to have a better survival outcome than the high-risk group (Fig. 2D).
Corroborating the key genes in the training cohort
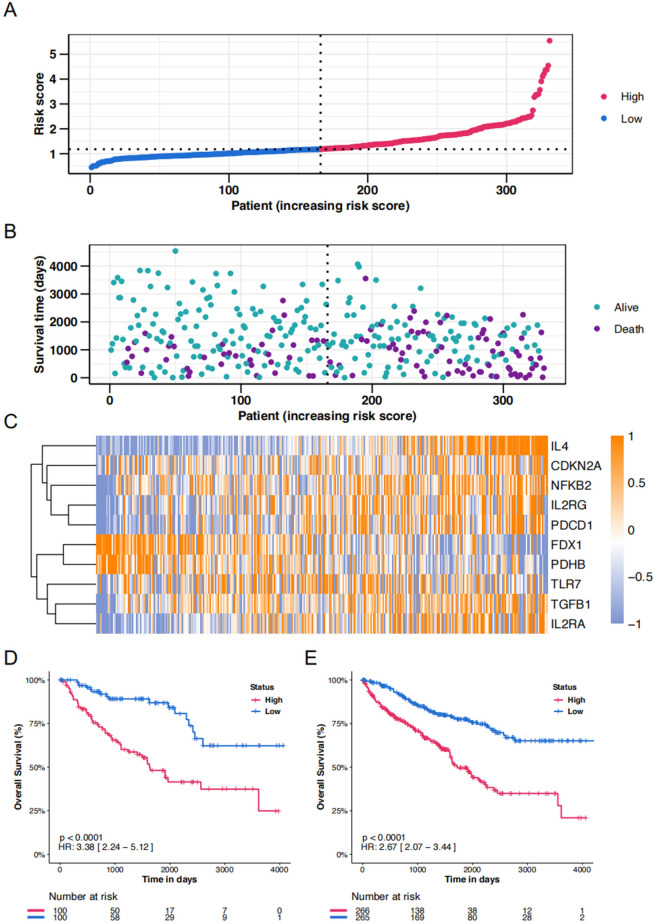
Then we calculated the risk score for the training cohort, and as expected, individuals in the high-risk group exhibited elevated risk scores compared to their low-risk counterparts (Fig. 3A). This group also experienced reduced survival times (Fig. 3B). Figure 3B illustrates the survival status and follow-up durations for patients in the validation cohort, accompanied by the expression profiles of the 10 key genes (Fig. 3C). To verify the prognostic precision, risk scores were computed for both the validation cohort and the entire cohort and were then divided into high-score and low-score groups using the median score as a threshold. Furthermore, Kaplan–Meier survival analysis confirmed superior OS for the low-score group within both the validation and entire cohorts (Fig. 3D and E).
Figure 3.
Risk score analysis of disease-specific survival–related prognostic models. (A) The risk score distribution of the training cohort. (B) The vital status and follow-up time of patients from the high-score group and low-score group in the training cohort. (C) The expression profiles of the top 10 key genes in the training cohort. (D&E) The time-dependent OS rate of high-score and low-score groups in validation and the entire cohort.
Functional enrichment of key genes for ccRCC
To illustrate the clinical prediction model, we developed the forest plot of the unified clinical information of the 531 ccRCC patients from TCGA with the calculated risk score via multivariable Cox regression (Fig. 4A). Afterward, we performed a GO enrichment analysis of all key genes to demonstrate their biological functions (Fig. 4B), and the key genes exhibit a strong relationship with hallmarks of mTORC1, glycolysis, and the mitotic spindle. GSEA analysis also reveals that these key genes are positively related to inflammatory response and hypoxia pathway (Fig. 4C and D).
Figure 4.
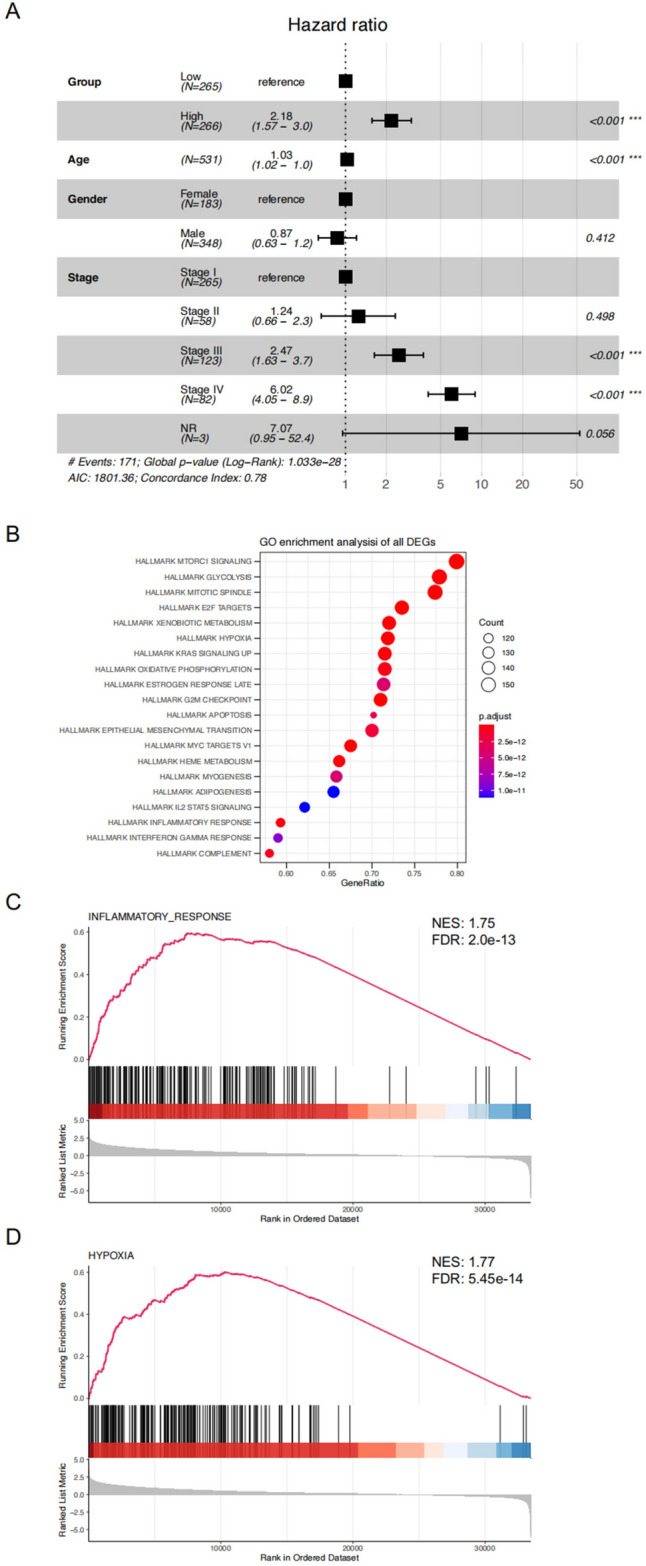
Forest plot of TCGA KIRC and functional enrichment. (A) Forest plot of TCGA KIRC based on the OS of different clinical information. (B) The functional enrichment in Kyoto Encyclopedia of Genes and Genomes analysis. The size of the circles represents the number of enriched genes. (C&D) The gene set enrichment analysis of the relation between the key genes and inflammatory response and hypoxia.
Correlation between key genes and immune infiltration levels in ccRCC
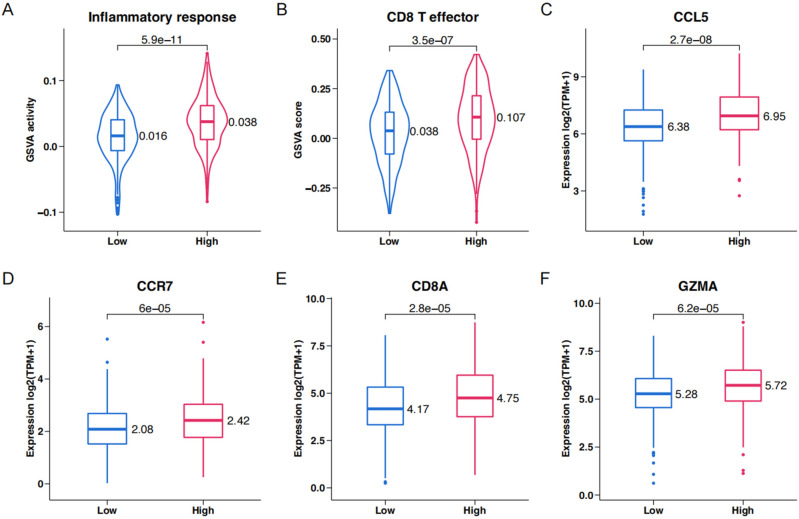
To study the effect of the key genes on TME, GSVA activity score analysis of inflammatory responses (Fig. 5A) and effector CD8 + T cells (Fig. 5B) was performed in the high-score and low-score groups of the entire cohort. The high-score group showed enhanced inflammatory responses and effector CD8 + T cell activity. The expression of T cell and cDCs recruitment chemokines CCL5 and CCR7 (Fig. 5C, D) and the infiltration of effector CD8 + T cells (Fig. 5E, F) were examined.
Figure 5.
Genomic correlations with risk score in TCGA KIRC. (A–C) Violin plots of the inflammatory response and box plots of inflammatory response hallmarks in high-score and low-score groups. (D–F) Violin plots of CD8+ effector T cell and box plots of CD8+ effector T cell in high-score and low-score groups.
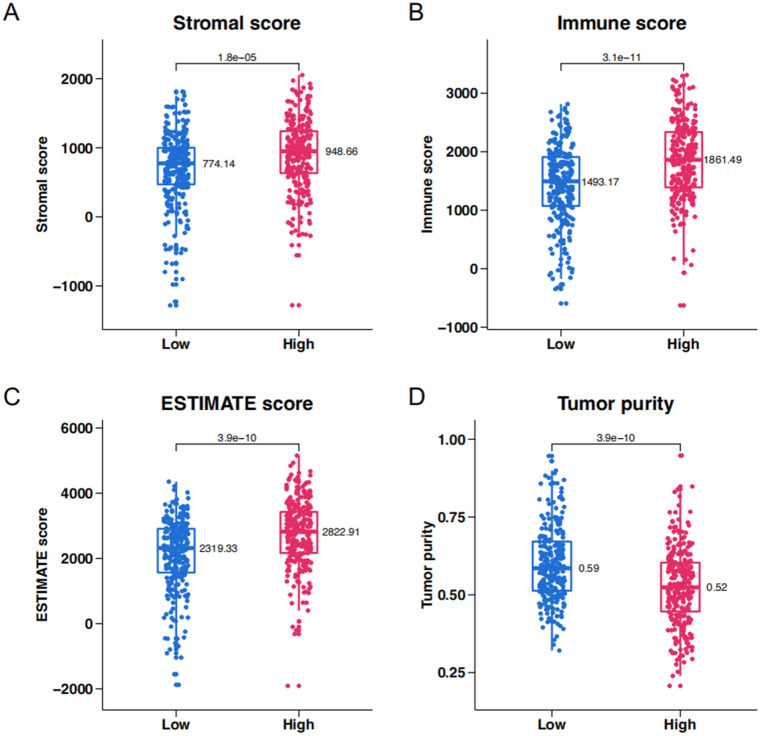
The ESTIMATE algorithm was used to investigate the relationship between key genes and the TME in ccRCC. The stromal score (Fig. 6A), immune score (Fig. 6B), ESTIMATE score (Fig. 6C), and tumor purity (Fig. 6D) were assessed in the high-score and low-score groups. The High-Score group was characterized by a high stromal score, high immune score, high ESTIMATE score, and low tumor purity, consistent with our previous findings.
Figure 6.
ESTIMATE analysis of high-score and low-score groups in TCGA KIRC. (A) Stromal score. (B) Immune score. (C) ESTIMATE score. (D) Tumor purity.
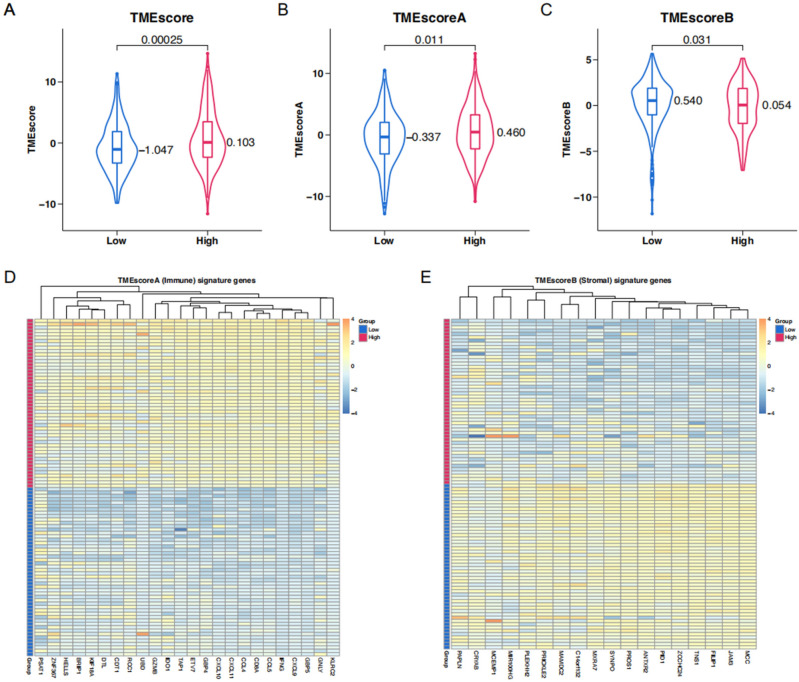
To further inquire about the link between key genes and the TME signature in ccRCC, we performed the TMEScore algorithm. As mentioned above, this algorithm encapsulated the expression of immune-related (TMEScoreA) and stromal-related (TMEScoreB) genes. The High-Score group was characterized by an elevation of TMEScoreA (Fig. 7B) from which arose a picture of increased immune activity. In contrast, in this group TMEScoreB was lowered (Fig. 7C), suggesting a stroma less pronounced. An integrated TMEScore, which was higher overall in the High-Score group, is shown in Fig. 7A. Heatmaps were also created for TMEScoreA and TMEScoreB to illustrate visually the distribution of their immune and stromal signatures across these groups (Fig. 7D, E).
Figure 7.
TMESCORE analysis of high-score and low-score groups in TCGA KIRC. (A–C) TMEscore, TMEscoreA, and TMEscoreB of high-score and low-score groups in TCGA KIRC. (D) The expression profiles of the TMEscoreA gene signatures. (E) The expression profiles of the TMEscoreB gene signatures.
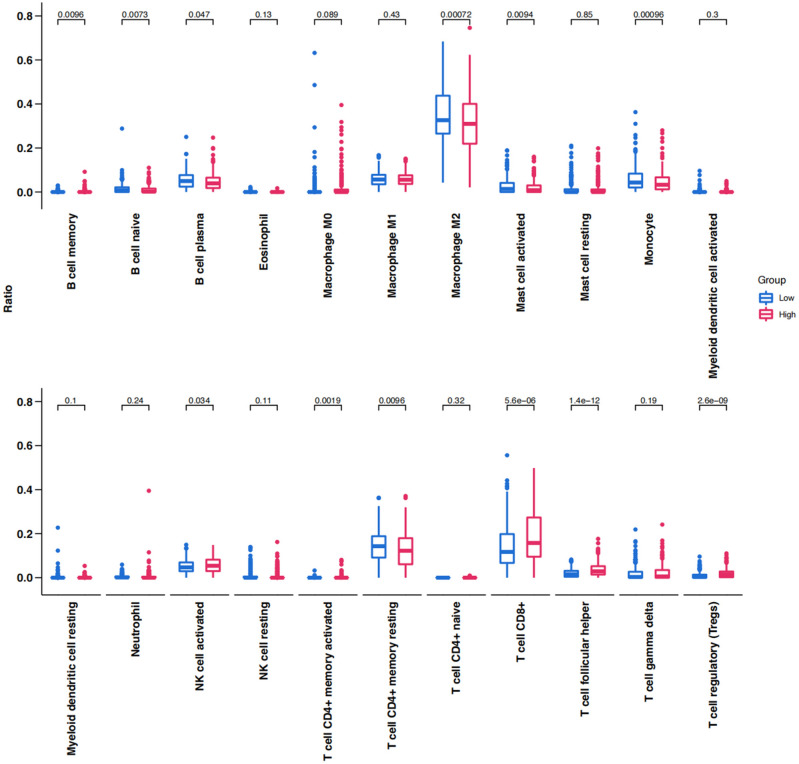
The distribution of tumor-infiltrating lymphocytes in ccRCC was evaluated based on the CIBERSORT algorithm and the top 10% of ccRCC samples are illustrated in Fig. 8. There were significant differences in the distribution between the high-score and low-score groups. The high-score group displayed a significant reduction in M2 macrophages, memory-resting CD4 + T cells, monocytes, plasma cells, and activated mast cells; in contrast, CD8 + T cells, activated NK cells, and T follicular helper cells were notably increased in these groups.
Figure 8.
Box plot showing the infiltrating immune cells of high-score and low-score groups in TCGA KIRC.
Exploration of biological roles of cuproptosis-related genes in ccRCC cells through in vitro studies
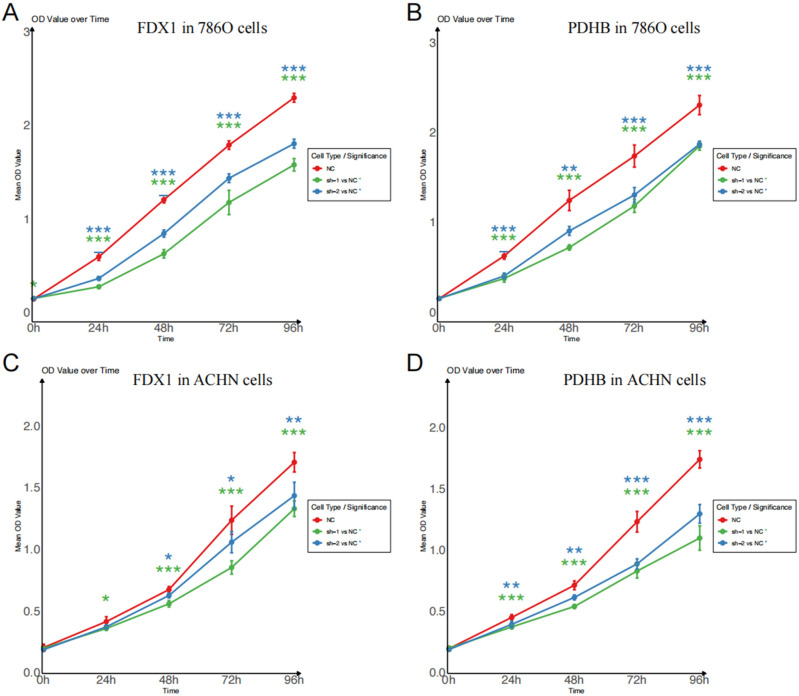
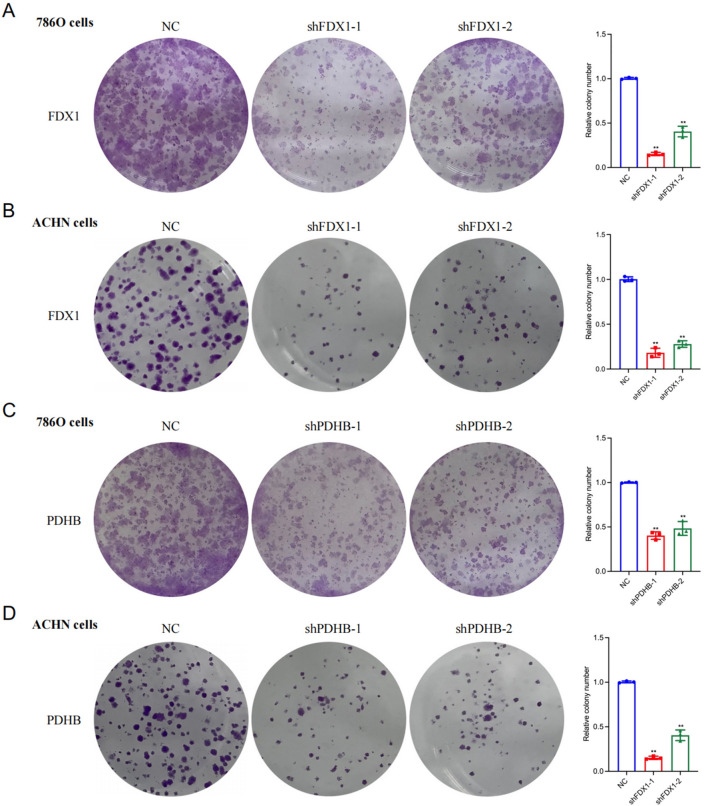
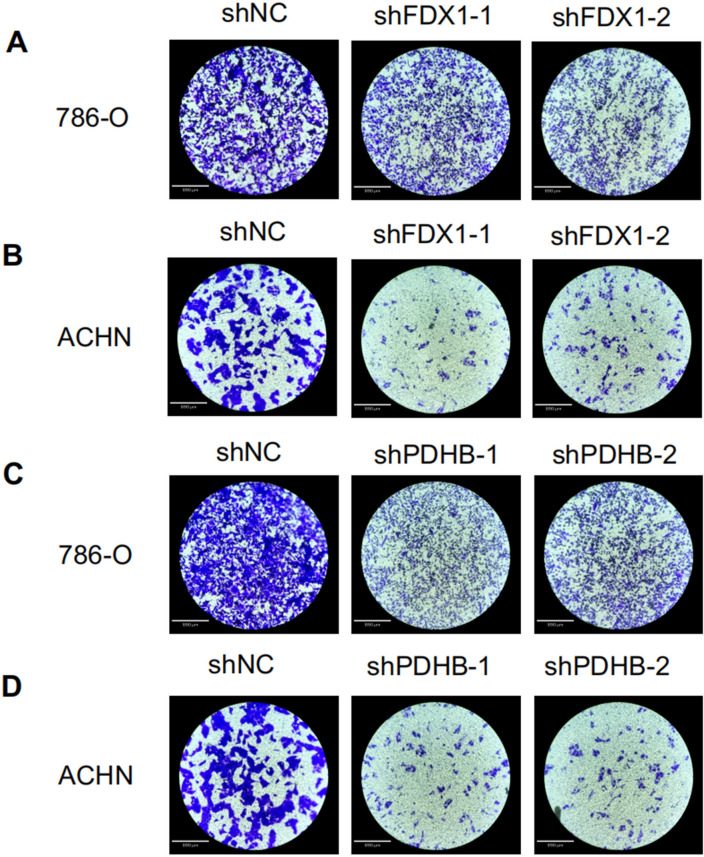
In this study, we aimed to explore the potential effect of FDX1 and PDHB, cuproptosis-related genes, on the progression of RCC. Our findings revealed a substantial decrease in the proliferation capacity of the RCC cell lines 786-O (Fig. 9A, B) and ACHN (Fig. 9C, D) following FDX1 and PDHB knockdown, as evidenced by CCK8 assay. To further extend this observation, we conducted a colony formation assay. After the knockdown of FDX1 and PDHB genes, both the 786-O and ACHN cell lines exhibited a notable reduction in nuclear DNA synthesis, implying that FDX1 (Fig. 10A, B) and PDHB (Fig. 10C, D) may play a role in promoting the proliferation of RCC cell lines. To evaluate the effect of FDX1 and PDHB on RCC cell migration, we also performed a transwell assay. The results indicated that the knockdown of FDX1 and PDHB significantly attenuated the migratory ability of the cells compared with the control group (as depicted in Fig. 11). The observed differences in the colony count and the migratory ability were found to be statistically significant, with a P-value < 0.001.
Figure 9.
Proliferation curves assessed by CCK8 assays. CCK8 assay of FDX1 (A) and PDHB (B) knockdown cell model of 786-O cells. CCK8 assay of FDX1 (C) and PDHB (D) knockdown cell model of ACHN cells. Statistical significance is indicated by the following thresholds: *P < 0.05, **P < 0.01, ***P < 0.001.
Figure 10.
Cell proliferation as measured by colony formation assays. Colony formation assays of FDX1 knockdown cell model in 786-O (A) and ACHN (B) cells. CCK8 assay of PDHB knockdown cell model of 786-O (C) and ACHN (D) cells. Statistical significance is indicated by the following thresholds: *P < 0.05, **P < 0.01, ***P < 0.001.
Figure 11.
Cell migration and invasion were determined by the transwell assays. Transwell assay of FDX1 knockdown cell model in 786-O (A) and ACHN (B) cells. CCK8 assay of PDHB knockdown cell model of 786-O (C) and ACHN (D) cells. The microscope magnification is 40 times.
Discussion
ccRCC is commonly associated with a hypoxic environment and reformed TCA cycle promoting tumor cells to escape immune surveillance15,16. Although there has been some research assessing the relationship between cuproptosis and tumors, the specific impacts of cuproptosis on the ccRCC TME are still not fully understood. In this study, we innovatively predicted 10 cuproptosis-related and 40 TME-pathway-related genes in ccRCC tissues. Since immunotherapy has been a novel and effective therapy for RCC in recent years, this study also predicted the relationship between prognosis and immune response in ccRCC patients by risk score modeling. These findings suggest the potential effectiveness of copper ion carriers in the treatment of ccRCC, with higher risk scores being associated with better immune responses. It lays the foundation for future studies of copper ionophores-based therapies and immune checkpoint inhibitor therapies in ccRCC and other cancers.
LASSO had two appealing properties in this study. First, it was suitable for high-dimensional data and efficient in variable reduction and selection. Thus, the LASSO model was more appropriate than the elastic net and network-regularized Cox regression in this study, as multicollinearity was not serious in our dataset. Second, the good interpretability and computational efficiency of LASSO were essential for associating the expression of genes with the survival of ccRCC, which was in line with our study goals17. Our validation of both the prognostic score in the validation and entire cohorts using OS data revealed a strong association of the key genes with ccRCC patient outcomes. Further analysis suggested their association with mTORC1 signaling, glycolysis pathways, as well as mitotic spindle pathway enrichment. In addition, these genes were shown to correlate with alterations in immune infiltration in the ccRCC TME.
In accordance with the study of Bian et al., in which six genes were substantially down-regulated, and CDKN2A was the only up-regulated gene, comparing tumor and normal kidney tissues. This pattern suggests that ccRCC may be associated with cuproptosis. Against this background, three key genes (FDX1, PDHB, CDKN2A), associated with the TME-pathway signatures, have been mentioned. FDX1, located in the human mitochondrial matrix, is structurally homologous to iron–sulfur clusters and functions as an electron donor in multiple mitochondrial complexes18. It has been implicated in the reduction of Cu2+ to the more toxic Cu+19. In the work of Tsvetkov et al.12 FDX1 and six other proteins were identified as critical for lipoylation of PDHA and thus in regulating cuproptosis. Our findings highlight FDX1 and PDHB in the regulation of immune infiltration of the ccRCC TME and in altering the overall survival (OS) of ccRCC.
PDHB codes for a part of a mitochondrial enzyme complex that converts pyruvate into acetyl-CoA and carbon dioxide20, a vital step in connecting glycolysis to the TCA cycle21,22. CDKN2A, a recognized tumor suppressor gene, produces different proteins through alternative splicing. Mutations and deletions in CDKN2A are associated with a range of cancers23–25. Our risk score analysis revealed that high-score patients expressed lower levels of key cuproptosis genes, particularly FDX1 and PDHB. This is consistent with a previous report by Tsvetkov et al. documenting the expression of FDX1 across multiple cancer cell lines and finding an association between FDX1 and lipoylated proteins like PDHB with cuproptosis sensitivity.
We found 7 genes associated with TME pathways in the risk score model of cuproptosis-related genes, of which IL2RA and IL2RG encode IL-2 receptor proteins, which facilitate immunodeficiency and an immunosuppressive tumor microenvironment26–30, and TLR7, a member of the Toll-like receptor family, which recognizes strands of RNA virus in dendritic cells and B cells31–33, where it is involved in tumor progression in which includes a negative correlation with the risk score in which presence indicates that TLR7 strengthens the immune response in TME of ccRCC. NFKB2, encoding for NF-κB2 and found in various cells, plays roles in inflammation and immune responses. Its dysregulation is linked to immunodeficiency and several TME pathways34–37. Moreover, IL4, TGFB1, and PDCD1 genes encode the immunosuppressive factors IL-4, TGF-β1, and PD-1, often associated with poorer prognoses38–40. In our model, these immunosuppressive genes directly correlate with the risk score highly indicating a high score reflects more immune-evasive TME in ccRCC, highlighting their role in establishing the immunosuppressive landscape in ccRCC as well as their potential impact on patient outcomes.
Cuproptosis, induced by copper ionophores, represents a unique form of cell death that is distinct from apoptosis, ferroptosis, necroptosis, and oxidative stress12; copper ionophores and chelators are now in clinical trials13,41–44. The distinction of cuproptosis from apoptosis and necroptosis12 has raised interest as to whether it might impact OS and the TME in ccRCC patients. We constructed a risk score model based on the top 10 key genes connected to cuproptosis and the TME. Our results suggest that patients with a high score (generally worse OS) might respond differently to those with a low score for immunosuppressive TME during hypoxia. Notably, cuproptosis-related genes like FDX1 and PDHB correlated negatively with the risk score and immune activity. Kevin D. Courtney et al.45 also reported a pronounced enrichment in the glycolysis pathway and concomitant decrease in the TCA cycle, which is in line with our findings showing loss of tumor cell cuproptosis. Functional enrichment analysis found a close relationship between the high-score group and the mTOR 1 and glycolysis pathways. ccRCC, typically in a hypoxic environment, are responsive to mTOR inhibitors, with the mTOR1 pathway connected to numerous immunosuppressive cytokines46–48. Our findings also illustrated the feasibility of cuproptosis-related treatment for ccRCC patients. In addition, since both cuproptosis-related and TME-associated genes were included in the analysis, the negative correlation observed with FDX1 and PDHB suggests that these genes may not be involved in the immunosuppressive processes.
The above results demonstrated that, while both ccRCC patient groups had heightened immune responses, the High-Score group displayed the strongest inflammatory response. Functional enrichment analyses, ESTIMATE score, and TMEScore results all support this conclusion. With the CIBERSORT algorithm, we then identified increased immune infiltration by multiple immune cell subtypes, noting that anti-tumor lymphocytes, such as CD8+ T cells, activated NK cells, and activated memory T cells, were upregulated in this same patient group, while immunosuppressive M2 macrophages were downregulated. However, our findings also indicated a notable rise in the proportion of T follicular helper cells and regulatory T cells, which are key immune regulators contributing to T cell exhaustion and an immunosuppressive TME49–52. RCC is commonly recognized as a highly immunogenic cancer, characterized by extensive infiltration of immune lymphocytes, including cytotoxic CD8+ T cells53–55. Interestingly, unlike many solid tumors, an increase in CD8+ T cells in RCC does not necessarily correlate with improved patient prognosis. Even the presence of PD-1 and PD-L1 has not been conclusively predictive of clinical response to immune checkpoint inhibitors55–57, potentially due to impaired antigen presentation56–58. Our risk score model innovatively combines traditional TME-pathway genes with cuproptosis-related genes, establishing a novel algorithm with key genes. This model not only effectively evaluates the prognosis of ccRCC patients but also links it to the inflammatory response and immune cell recruitment capabilities. According to our model, the high-score group, despite a shorter OS, exhibited enhanced chemotactic abilities for T cells and conventional dendritic cells (cDCs), along with a more robust inflammatory response. These findings suggest that the high-score group might be considered as potential candidates for immune checkpoint inhibitor (ICI) treatment, underscoring the importance of comprehensive profiling in developing personalized and effective therapeutic strategies for ccRCC patients.
In our study, the construction of knockdown models for FDX1 and PDHB in 786-O and ACHN renal cancer cell lines and subsequent in vitro assays, including CCK8, colony formation, and Transwell experiments. We specifically targeted FDX1 and PDHB for validation due to their critical roles in the process of cuproptosis. Although CDKN2A is also detected as one of the Cuproptosis-related key genes, it is also implicated in a broader range of biological processes including alternative splicing. The knockdown of CDKN2A may alter the biological process of 786-O and ACHN via mechanism instead of cuproprosis. Moreover, we excluded the other seven genes from our focus as they are primarily associated with the TME and are more relevant to immune cells rather than the tumor cells themselves, such as in the 786-O and ACHN renal cancer cell lines. The observed reduction in proliferation and migration capabilities in cell lines with diminished expression of FDX1 and PDHB suggests these two cuproptosis-related genes may work as oncogenes in tumor growth and metastasis. These findings align with the results from other cuproptosis-based ccRCC studies, though they are deficient in further biological processes involved59,60.
Our model offers significant advantages. Primarily, we’ve established a cuproptosis and TME-related risk score that effectively predicts the prognosis of ccRCC patients. We’ve uncovered a positive correlation between cuproptosis-related genes, particularly FDX1 and PDHB, and patient outcomes in ccRCC. Interestingly, high levels of FDX1 and PDHB may shift the TME toward an active immune state. Conversely, CDKN2A, another cuproptosis-linked gene, is negatively associated with ccRCC outcomes and may promote an immunosuppressive TME. Notably, although patients in the high-score group have a poorer overall survival (OS), they exhibit a stronger immune response, potentially due to T cell priming amidst an immunosuppressive environment.
However, there are limitations to our findings. Our results are solely based on TCGA analysis, and further studies are warranted. Specifically, it remains to be seen if copper ionophore agents can specifically upregulate FDX1 and PDHB. Additionally, our model suggests enhanced TME activation in the high-score group despite lower cuproptosis. The exact mechanism of the efficacy of copper ionophores on the immune response has not been clarified. Future research should explore whether cuproptosis in ccRCC tumor cells can further stimulate anti-tumor immunity through antigen presentation. Moreover, in-depth functional studies on key genes in ccRCC tumors and the TME, both in vivo and in vitro, are crucial.
Conclusions
In conclusion, this study highlights the potential of copper ionophores in treating ccRCC, focusing on the TME. We found that reducing the expression of FDX1 and PDHB would inhibit the growth and migration of ccRCC cells, pointing to novel therapeutic strategies. Our results show a complex interaction in the TME, especially in high-risk ccRCC patients. These patients have a stronger immune response against the tumor but also face a higher risk of poor survival. This response includes more anti-tumor lymphocytes and fewer suppressive macrophages, along with an increase in certain immune cells like T follicular helper cells and regulatory T cells.
These findings suggest that treating ccRCC requires a careful approach that considers both the direct effects on the tumor and its impact on the immune system. Our study opens doors for further research into copper ionophores as a treatment option and emphasizes the need to understand the TME better. This understanding could lead to more personalized and effective treatments for ccRCC and possibly other cancers.
Methods and materials
Acquisition and pre-processing of TCGA KIRC data
We acquired the mRNA expression data and the clinical information of 531 KIRC (Kidney Renal Clear Cell Carcinoma) tumor tissues along with 71 adjacent normal tissues, excluding those without follow-up time or survival status, from The Cancer Genome Atlas (TCGA) database (http://portal.gdc.cancer.gov/, accessed on 19 June 2022). Following that, we measured the gene expression with STAR and transformed them into transcripts per million (TPM). Subsequently, the gene features, such as gene types, Ensemble IDs, and official symbols, were annotated by the GENCODE project (v22).
Identification of cuproptosis and TME-pathway-related genes’ differential expression
Ten cuproptosis-related genes were identified according to previous studies12,61,62, and 40 TME-pathway-related genes were selected from the MsigDB database (http://www.gsea-msigdb.org/gsea/msigdb/cards/WP_INTERACTIONS_BETWEEN_IMMUNE_CELLS_AND_MICRORNAS_IN_TUMOR_MICROENVIRONMENT). After that, R package DEseq2 (v1.30.1) was employed to evaluate the differential expression of cuproptosis-related genes between ccRCC tumor tissues and adjacent normal tissues via the criteria of P-value < 0.05, and log2(fold change) > 1 or < − 1, respectively.
Construction and validation of the cuproptosis and TME-pathway-related gene based-signature
To construct the cuproptosis and TME-pathway-related signature, we first randomly divided the entire TCGA KIRC cohort into a training cohort (331 samples) and a validation cohort (200 samples). The LASSO Cox analyses were subsequently used for dimensionality reduction and model construction. In brief, the 21 DEGs were subsequently subjected to the least absolute shrinkage and selection operator (LASSO) regression analysis to avoid overfitting using the glmnet package in R. Finally, a total of 10 key genes were included in the risk score model. Hereafter we employed the stepwise multivariate Cox regression analysis to evaluate signature genes and calculate the coefficients of corresponding regression, which further contributed towards calculating the risk score for ccRCC patients according to the formula:
where Exp = expression of 10 key genes, and CoEff = the regression of coefficient.
Evaluating prognostic efficacy of gene-based signatures through survival and ROC analyses
Following that, the risk scores were calculated for the patients of the training cohort, validation cohort, and entire cohort, respectively. Meanwhile, the high-score and low-score groups were distinguished by the median risk score in the training cohort. KM survival analysis was performed to compare the OS of the high-score and low-score groups via survival and survminer packages (v0.4.9) in R. The survivalROC package (v1.0.3) in R was employed to implement the time-dependent receiver operating characteristic (ROC) curves and evaluate the sensitivity and specificity of the gene signature based on the top 10 key genes in predicting OS in ccRCC patients.
Exploring gene expression clustering and univariate survival analysis in prognostic studies
To present the clustering results of the samples and the expression patterns of the 10 key genes, we performed a heatmap clustering analysis via the pheatmap package (v1.0.12) to evaluate their expression patterns in the training cohort. In addition, the clinical information of ccRCC patients from the TCGA KIRC database, such as age, gender, and pathological stage, were subjected to the prognostic forest plot.
Exploring biological mechanisms through combined GO, GSEA, and GSVA of differential gene expression
To further discover the biological processes and pathways of these key genes identified in our study, we performed both gene ontology (GO) enrichment analysis and gene set enrichment analysis (GSEA). With the clusterProfiler package (version 3.10), we performed GO enrichment analysis and classified these genes into three categories: biological processes, molecular functions, and cellular components. A false discovery rate (FDR) was applied to account for false positives, with a threshold set at FDR < 0.05. Following GO analysis, Gene set enrichment analysis (GSEA) was conducted with the fgsea package (version 1.16.0) for this analysis, utilizing gene sets derived from the molecular signatures database (MSigDB). To further uncover the immunological landscape associated with risk stratification, we employed gene set variation analysis (GSVA) to compare the activity of selected immune-related gene sets between high-score and low-score groups. This analysis focused on quantifying the GSVA activities of “inflammatory response”, “CCL7”, and “CCR7”, alongside the GSVA scores for “CD8 T effector”, “CD8A”, and “GZMA”.
Assessment of ccRCC TME and immune cell infiltration based on risk score
To evaluate the TME infiltration in the high-score and low-score groups, the estimate package (v1.0.13) in R was performed to calculate the stromal score, immune score, ESTIMATE score, and tumor purity in samples from different groups. Besides, we also evaluated the TME with the TMEscore package (v0.1.4) in R to calculate the TMEscoreA (representing immune score), TMEscoreB (representing stromal score), and TMEscore. Furthermore, to discover the composition of immunocyte subsets across the different groups, we employed the CIBERSORT algorithm. The proportion of infiltrating immunocytes in high-score and low-score groups in TCGA KIRC were compared with the criteria of P-value < 0.05.
Cell lines, small interfering RNAs, and cell transfection
Two human RCC cells 786-O and ACHN were purchased from the National Collection of Authenticated Cell Cultures (Shanghai, China), and were grown in RPMI Medium 1640 basic (31,870,082, Gibco, Carlsbad, CA, United States) supplemented with 10% fetal bovine serum (10099141C, Gibco, Carlsbad, CA, United States) and 1% penicillin–streptomycin (15,140,122, Gibco, Carlsbad, CA, United States)at 37 °C in a 5% CO2 humidified atmosphere incubator. The specific small interfering RNAs targeting FDX1 and PDHB and non-specific control sequences were synthesized by RiboBio (Guangzhou, China).
Cell proliferation assays
The 786-O and ACHN cells were transfected with siRNA against FDX1 (shFDX1-1: GTCCACTTTATAAACCGTGAT, shFDX1-2: TGGTGAAACATTAACAACCAA), and PDHB (shPDHB-1: GACAGTTCGTGATGCTATAAA, shPDHB-2: AATAATCCTCTTGTCTCCATA), or negative control (NC). Cell viability was assessed every 24 h using a CCK8 kit (BS350A, Biosharp, Hefei, Anhui, China), and optical density was measured at 450 nm using a microplate reader. All data were presented as the means ± SD of three independent experiments. *** P < 0.001.
Cell colony formation assays
Cells were seeded at 500 cells per well of a culture plate. After 14 days of incubation, the cells were fixed with methanol for 15 min and then washed with PBS (10,010,031, Gibco, Carlsbad, CA, United States). After washing with PBS, the cells were stained with 0.1% crystal violet solution (C0121, Beyotime, Shanghai, China) and observed under a microscope.
Transwell assays
Transwell migration assays were performed using a Corning transwell chamber (3422, Corning, United States), with some chambers coated with Matrigel (354,234, Corning, United States) and others left uncoated. Medium containing 10% FBS was placed in the lower chamber, while renal cell carcinoma cells, at a density of 4 × 10⁴ cells per well, were seeded in a serum-free medium in the upper chamber. The chambers were then incubated at 37 °C in a 5% CO2 environment for 24 h. Subsequently, the cells on the lower surface were fixed with methanol and stained with 0.1% crystal violet. After staining, the non-migrating cells on the upper surface of the membrane were gently removed with a cotton swab. Migrated cells on the lower surface of the membrane were observed and quantified using an inverted microscope.
Statistical analysis
All statistical analyses were performed in R (v4.0.3) and the two-sided P-value < 0.05 was considered to be statistically significant.
Ethical approval and consent to participate
Since the data used in this study came from the public database, this study was exempt from ethical review. We obtained the public data in accordance with the databases’ ethical guidelines. Data processing was carried out in accordance with the TCGA Human Subject Protection and Data Access Policy.
Acknowledgements
The authors thank the students, researchers, nurses, and doctors of the Changzhou First People’s Hospital for their great assistance.
Author contributions
Conceptualization, Z.X. and X.H.; methodology, Z.X.; software, Z.X.; validation, Z.X., Y.F. and Y.Y.; formal analysis, Z.X.; investigation, Z.X. and L.C.; resources, L.C.; data curation, Z.X., Y.F., L.C. and Y.Y; writing—original draft preparation, Z.X.; writing—review and editing, L.C., Y.F. and Y.Y.; visualization, Z.X..; supervision, X.H.; project administration, X.H.; funding acquisition, Z.X. and L.C. All authors have read and agreed to the published version of the manuscript.
Funding
This work was supported by the Changzhou Sci & Tech Program (Grant No. CZ20210031), the Youth talent science and technology project of Changzhou Health Commission (Grant No. QN202110), and the National Natural Science Foundation of China (NSFC) (No. 82302141).
Data availability
We obtained the TCGA-KIRC cohort dataset from The Cancer Genome Atlas (TCGA) portal (https://portal.gdc.cancer.gov/).
Competing interests
The authors declare no competing interests.
Footnotes
Publisher's note
Springer Nature remains neutral with regard to jurisdictional claims in published maps and institutional affiliations.
References
- 1.Siegel, R. L., Miller, K. D., Fuchs, H. E. & Jemal, A. Cancer statistics, 2022. CA Cancer J. Clin.72, 7–33. 10.3322/caac.21708 (2022). 10.3322/caac.21708 [DOI] [PubMed] [Google Scholar]
- 2.Aurilio, G. et al. Metabolomic profiling in renal cell carcinoma patients: News and views. Cancers (Basel)13, 5229. 10.3390/cancers13205229 (2021). 10.3390/cancers13205229 [DOI] [PMC free article] [PubMed] [Google Scholar]
- 3.Jonasch, E., Walker, C. L. & Rathmell, W. K. Clear cell renal cell carcinoma ontogeny and mechanisms of lethality. Nat. Rev. Nephrol.17, 245–261. 10.1038/s41581-020-00359-2 (2021). 10.1038/s41581-020-00359-2 [DOI] [PMC free article] [PubMed] [Google Scholar]
- 4.Rizzo, A. et al. Hypertransaminasemia in cancer patients receiving immunotherapy and immune-based combinations: The MOUSEION-05 study. Cancer Immunol. Immunother.72, 1381–1394. 10.1007/s00262-023-03366-x (2023). 10.1007/s00262-023-03366-x [DOI] [PMC free article] [PubMed] [Google Scholar]
- 5.Guven, D. C. et al. The association between albumin levels and survival in patients treated with immune checkpoint inhibitors: A systematic review and meta-analysis. Front. Mol. Biosci.9, 1039121. 10.3389/fmolb.2022.1039121 (2022). 10.3389/fmolb.2022.1039121 [DOI] [PMC free article] [PubMed] [Google Scholar]
- 6.Santoni, M. et al. Real-world outcome of patients with advanced renal cell carcinoma and intermediate- or poor-risk international metastatic renal cell carcinoma database consortium criteria treated by immune-oncology combinations: Differential effectiveness by risk group?. Eur. Urol. Oncol.7, 102–111. 10.1016/j.euo.2023.07.003 (2024). 10.1016/j.euo.2023.07.003 [DOI] [PubMed] [Google Scholar]
- 7.Dall’Olio, F. G. et al. Immortal time bias in the association between toxicity and response for immune checkpoint inhibitors: A meta-analysis. Immunotherapy13, 257–270. 10.2217/imt-2020-0179 (2021). 10.2217/imt-2020-0179 [DOI] [PubMed] [Google Scholar]
- 8.Massari, F. et al. Safety evaluation of immune-based combinations in patients with advanced renal cell carcinoma: A systematic review and meta-analysis. Expert Opin. Drug Saf.19, 1329–1338. 10.1080/14740338.2020.1811226 (2020). 10.1080/14740338.2020.1811226 [DOI] [PubMed] [Google Scholar]
- 9.Rosellini, M. et al. An update on safety evaluation of immune-based combinations in patients with advanced renal cell carcinoma. Expert Opin. Drug Saf.22, 279–291. 10.1080/14740338.2023.2203486 (2023). 10.1080/14740338.2023.2203486 [DOI] [PubMed] [Google Scholar]
- 10.Kim, B. E., Nevitt, T. & Thiele, D. J. Mechanisms for copper acquisition, distribution and regulation. Nat. Chem. Biol4, 176–185. 10.1038/nchembio.72 (2008). 10.1038/nchembio.72 [DOI] [PubMed] [Google Scholar]
- 11.Mishra, V. et al. Application of liquid biopsy as multi-functional biomarkers in head and neck cancer. Br. J. Cancer126, 361–370. 10.1038/s41416-021-01626-0 (2022). 10.1038/s41416-021-01626-0 [DOI] [PMC free article] [PubMed] [Google Scholar]
- 12.Tsvetkov, P. et al. Copper induces cell death by targeting lipoylated TCA cycle proteins. Science (New York)375, 1254–1261. 10.1126/science.abf0529 (2022). 10.1126/science.abf0529 [DOI] [PMC free article] [PubMed] [Google Scholar]
- 13.O’Day, S. J. et al. Final results of phase III SYMMETRY study: Randomized, double-blind trial of elesclomol plus paclitaxel versus paclitaxel alone as treatment for chemotherapy-naive patients with advanced melanoma. J. Clin. Oncol.31, 1211–1218. 10.1200/jco.2012.44.5585 (2013). 10.1200/jco.2012.44.5585 [DOI] [PubMed] [Google Scholar]
- 14.Keith, B., Johnson, R. S. & Simon, M. C. HIF1α and HIF2α: Sibling rivalry in hypoxic tumour growth and progression. Nat. Rev. Cancer12, 9–22. 10.1038/nrc3183 (2011). 10.1038/nrc3183 [DOI] [PMC free article] [PubMed] [Google Scholar]
- 15.Linehan, W. M. et al. The metabolic basis of kidney cancer. Cancer Discov.9, 1006–1021. 10.1158/2159-8290.Cd-18-1354 (2019). 10.1158/2159-8290.Cd-18-1354 [DOI] [PubMed] [Google Scholar]
- 16.Wettersten, H. I., Aboud, O. A., Lara, P. N. Jr. & Weiss, R. H. Metabolic reprogramming in clear cell renal cell carcinoma. Nat. Rev. Nephrol.13, 410–419. 10.1038/nrneph.2017.59 (2017). 10.1038/nrneph.2017.59 [DOI] [PubMed] [Google Scholar]
- 17.Pak, K. et al. A user-friendly, web-based integrative tool (ESurv) for survival analysis: Development and validation study. J. Med. Internet Res.22, e16084. 10.2196/16084 (2020). 10.2196/16084 [DOI] [PMC free article] [PubMed] [Google Scholar]
- 18.Cai, K., Tonelli, M., Frederick, R. O. & Markley, J. L. Human mitochondrial ferredoxin 1 (FDX1) and ferredoxin 2 (FDX2) both bind cysteine desulfurase and donate electrons for iron-sulfur cluster biosynthesis. Biochemistry56, 487–499. 10.1021/acs.biochem.6b00447 (2017). 10.1021/acs.biochem.6b00447 [DOI] [PMC free article] [PubMed] [Google Scholar]
- 19.Tsvetkov, P. et al. Mitochondrial metabolism promotes adaptation to proteotoxic stress. Nat. Chem. Biol.15, 681–689. 10.1038/s41589-019-0291-9 (2019). 10.1038/s41589-019-0291-9 [DOI] [PMC free article] [PubMed] [Google Scholar]
- 20.Fang, R., Nixon, P. F. & Duggleby, R. G. Identification of the catalytic glutamate in the E1 component of human pyruvate dehydrogenase. FEBS Lett.437, 273–277. 10.1016/s0014-5793(98)01249-6 (1998). 10.1016/s0014-5793(98)01249-6 [DOI] [PubMed] [Google Scholar]
- 21.Yonashiro, R., Eguchi, K., Wake, M., Takeda, N. & Nakayama, K. Pyruvate dehydrogenase PDH-E1β controls tumor progression by altering the metabolic status of cancer cells. Cancer Res.78, 1592–1603. 10.1158/0008-5472.Can-17-1751 (2018). 10.1158/0008-5472.Can-17-1751 [DOI] [PubMed] [Google Scholar]
- 22.Tang, H. et al. Pyruvate dehydrogenase B promoted the growth and migration of the nasopharyngeal carcinoma cells. Tumour Biol.37, 10563–10569. 10.1007/s13277-016-4922-4 (2016). 10.1007/s13277-016-4922-4 [DOI] [PubMed] [Google Scholar]
- 23.Kimura, H., Klein, A. P., Hruban, R. H. & Roberts, N. J. The role of inherited pathogenic CDKN2A variants in susceptibility to pancreatic cancer. Pancreas50, 1123–1130. 10.1097/mpa.0000000000001888 (2021). 10.1097/mpa.0000000000001888 [DOI] [PMC free article] [PubMed] [Google Scholar]
- 24.Yu, S. et al. Methylation of p16 gene and reduced expression of p16 protein in insulinoma associated with clinicopathological features. Zhonghua Yi Xue Za Zhi102, 1028–1033. 10.3760/cma.j.cn112137-20211029-02404 (2022). 10.3760/cma.j.cn112137-20211029-02404 [DOI] [PubMed] [Google Scholar]
- 25.Adib, E. et al. CDKN2A alterations and response to immunotherapy in solid tumors. Clin. Cancer Res.27, 4025–4035. 10.1158/1078-0432.Ccr-21-0575 (2021). 10.1158/1078-0432.Ccr-21-0575 [DOI] [PMC free article] [PubMed] [Google Scholar]
- 26.Buhelt, S. et al. IL2RA methylation and gene expression in relation to the multiple sclerosis-associated gene variant rs2104286 and soluble IL-2Rα in CD8(+) T cells. Front. Immunol.12, 676141. 10.3389/fimmu.2021.676141 (2021). 10.3389/fimmu.2021.676141 [DOI] [PMC free article] [PubMed] [Google Scholar]
- 27.Buhelt, S. et al. Biomarkers of systemic inflammation, soluble IL-2Rα and the multiple sclerosis-associated IL2RA SNP rs2104286 in healthy subjects and multiple sclerosis patients. Mult. Scler. Relat. Disord.54, 103140. 10.1016/j.msard.2021.103140 (2021). 10.1016/j.msard.2021.103140 [DOI] [PubMed] [Google Scholar]
- 28.Hou, Y. et al. Somatic reversion of a novel IL2RG mutation resulting in atypical X-linked combined immunodeficiency. Genes13, 35. 10.3390/genes13010035 (2021). 10.3390/genes13010035 [DOI] [PMC free article] [PubMed] [Google Scholar]
- 29.Tuovinen, E. A. et al. Novel hemizygous IL2RG p.(Pro58Ser) mutation impairs IL-2 receptor complex expression on lymphocytes causing X-linked combined immunodeficiency. J. Clin. Immunol.40, 503–514. 10.1007/s10875-020-00745-2 (2020). 10.1007/s10875-020-00745-2 [DOI] [PMC free article] [PubMed] [Google Scholar]
- 30.Yamashita, M. et al. A synonymous splice site mutation in IL2RG gene causes late-onset combined immunodeficiency. Int. J. Hematol.109, 603–611. 10.1007/s12185-019-02619-9 (2019). 10.1007/s12185-019-02619-9 [DOI] [PubMed] [Google Scholar]
- 31.van der Sluis, R. M. et al. TLR2 and TLR7 mediate distinct immunopathological and antiviral plasmacytoid dendritic cell responses to SARS-CoV-2 infection. EMBO J.41, e109622. 10.15252/embj.2021109622 (2022). 10.15252/embj.2021109622 [DOI] [PMC free article] [PubMed] [Google Scholar]
- 32.Brown, G. J. et al. TLR7 gain-of-function genetic variation causes human lupus. Nature605, 349–356. 10.1038/s41586-022-04642-z (2022). 10.1038/s41586-022-04642-z [DOI] [PMC free article] [PubMed] [Google Scholar]
- 33.Mohamed, F. E. Z. et al. Inhibition of TLR7 and TLR9 reduces human cholangiocarcinoma cell proliferation and tumor development. Dig. Dis. Sci.67, 1806–1821. 10.1007/s10620-021-06973-9 (2022). 10.1007/s10620-021-06973-9 [DOI] [PubMed] [Google Scholar]
- 34.Kuehn, H. S. et al. Novel nonsense gain-of-function NFKB2 mutations associated with a combined immunodeficiency phenotype. Blood130, 1553–1564. 10.1182/blood-2017-05-782177 (2017). 10.1182/blood-2017-05-782177 [DOI] [PMC free article] [PubMed] [Google Scholar]
- 35.Dimitrakopoulos, F. D. et al. NF-kB2 genetic variations are significantly associated with non-small cell lung cancer risk and overall survival. Sci. Rep8, 5259. 10.1038/s41598-018-23324-3 (2018). 10.1038/s41598-018-23324-3 [DOI] [PMC free article] [PubMed] [Google Scholar]
- 36.Busino, L., Millman, S. E. & Pagano, M. SCF-mediated degradation of p100 (NF-κB2): Mechanisms and relevance in multiple myeloma. Sci. Signal.5, pt14. 10.1126/scisignal.2003408 (2012). 10.1126/scisignal.2003408 [DOI] [PMC free article] [PubMed] [Google Scholar]
- 37.Vallabhapurapu, S. & Karin, M. Regulation and function of NF-kappaB transcription factors in the immune system. Annu. Rev. Immunol.27, 693–733. 10.1146/annurev.immunol.021908.132641 (2009). 10.1146/annurev.immunol.021908.132641 [DOI] [PubMed] [Google Scholar]
- 38.Liao, H. et al. Protective regulatory T cell immune response induced by intranasal immunization with the live-attenuated pneumococcal vaccine SPY1 via the transforming growth factor-β1-Smad2/3 pathway. Front. Immunol.9, 1754. 10.3389/fimmu.2018.01754 (2018). 10.3389/fimmu.2018.01754 [DOI] [PMC free article] [PubMed] [Google Scholar]
- 39.Hsu, L. H., Li, K. P., Chu, K. H. & Chiang, B. L. A B-1a cell subset induces Foxp3(-) T cells with regulatory activity through an IL-10-independent pathway. Cell Mol. Immunol.12, 354–365. 10.1038/cmi.2014.56 (2015). 10.1038/cmi.2014.56 [DOI] [PMC free article] [PubMed] [Google Scholar]
- 40.Toomer, K. H. & Chen, Z. Autoimmunity as a double agent in tumor killing and cancer promotion. Front. Immunol.5, 116. 10.3389/fimmu.2014.00116 (2014). 10.3389/fimmu.2014.00116 [DOI] [PMC free article] [PubMed] [Google Scholar]
- 41.O’Day, S. et al. Phase II, randomized, controlled, double-blinded trial of weekly elesclomol plus paclitaxel versus paclitaxel alone for stage IV metastatic melanoma. J. Clin. Oncol.27, 5452–5458. 10.1200/jco.2008.17.1579 (2009). 10.1200/jco.2008.17.1579 [DOI] [PubMed] [Google Scholar]
- 42.Cui, L. et al. Mitochondrial copper depletion suppresses triple-negative breast cancer in mice. Nat. Biotechnol.39, 357–367. 10.1038/s41587-020-0707-9 (2021). 10.1038/s41587-020-0707-9 [DOI] [PMC free article] [PubMed] [Google Scholar]
- 43.Tsang, T. et al. Copper is an essential regulator of the autophagic kinases ULK1/2 to drive lung adenocarcinoma. Nat. Cell Biol.22, 412–424. 10.1038/s41556-020-0481-4 (2020). 10.1038/s41556-020-0481-4 [DOI] [PMC free article] [PubMed] [Google Scholar]
- 44.Davis, C. I. et al. Altered copper homeostasis underlies sensitivity of hepatocellular carcinoma to copper chelation. Metallomics12, 1995–2008. 10.1039/d0mt00156b (2020). 10.1039/d0mt00156b [DOI] [PMC free article] [PubMed] [Google Scholar]
- 45.Courtney, K. D. et al. Isotope tracing of human clear cell renal cell carcinomas demonstrates suppressed glucose oxidation in vivo. Cell Metab.28, 793-800.e792. 10.1016/j.cmet.2018.07.020 (2018). 10.1016/j.cmet.2018.07.020 [DOI] [PMC free article] [PubMed] [Google Scholar]
- 46.Clark, P. E. The role of VHL in clear-cell renal cell carcinoma and its relation to targeted therapy. Kidney Int.76, 939–945. 10.1038/ki.2009.296 (2009). 10.1038/ki.2009.296 [DOI] [PMC free article] [PubMed] [Google Scholar]
- 47.Baldewijns, M. M. et al. VHL and HIF signalling in renal cell carcinogenesis. J. Pathol.221, 125–138. 10.1002/path.2689 (2010). 10.1002/path.2689 [DOI] [PubMed] [Google Scholar]
- 48.Fantus, D. & Thomson, A. W. Evolving perspectives of mTOR complexes in immunity and transplantation. Am. J. Transplant.15, 891–902. 10.1111/ajt.13151 (2015). 10.1111/ajt.13151 [DOI] [PubMed] [Google Scholar]
- 49.Dai, E. et al. Epigenetic modulation of antitumor immunity for improved cancer immunotherapy. Mol. Cancer20, 171. 10.1186/s12943-021-01464-x (2021). 10.1186/s12943-021-01464-x [DOI] [PMC free article] [PubMed] [Google Scholar]
- 50.Weinstein, A. M. & Storkus, W. J. Therapeutic lymphoid organogenesis in the tumor microenvironment. Adv. Cancer Res.128, 197–233. 10.1016/bs.acr.2015.04.003 (2015). 10.1016/bs.acr.2015.04.003 [DOI] [PMC free article] [PubMed] [Google Scholar]
- 51.Nishikawa, H. & Koyama, S. Mechanisms of regulatory T cell infiltration in tumors: Implications for innovative immune precision therapies. J. Immunother. Cancer9, e002591. 10.1136/jitc-2021-002591 (2021). 10.1136/jitc-2021-002591 [DOI] [PMC free article] [PubMed] [Google Scholar]
- 52.Santoni, M. et al. Global real-world outcomes of patients receiving immuno-oncology combinations for advanced renal cell carcinoma: The ARON-1 study. Target. Oncol.18, 559–570. 10.1007/s11523-023-00978-2 (2023). 10.1007/s11523-023-00978-2 [DOI] [PubMed] [Google Scholar]
- 53.Şenbabaoğlu, Y. et al. Tumor immune microenvironment characterization in clear cell renal cell carcinoma identifies prognostic and immunotherapeutically relevant messenger RNA signatures. Genome Biol.17, 231. 10.1186/s13059-016-1092-z (2016). 10.1186/s13059-016-1092-z [DOI] [PMC free article] [PubMed] [Google Scholar]
- 54.Chevrier, S. et al. An immune atlas of clear cell renal cell carcinoma. Cell169, 736-749.e718. 10.1016/j.cell.2017.04.016 (2017). 10.1016/j.cell.2017.04.016 [DOI] [PMC free article] [PubMed] [Google Scholar]
- 55.Rooney, M. S., Shukla, S. A., Wu, C. J., Getz, G. & Hacohen, N. Molecular and genetic properties of tumors associated with local immune cytolytic activity. Cell160, 48–61. 10.1016/j.cell.2014.12.033 (2015). 10.1016/j.cell.2014.12.033 [DOI] [PMC free article] [PubMed] [Google Scholar]
- 56.Au, L. et al. Determinants of anti-PD-1 response and resistance in clear cell renal cell carcinoma. Cancer Cell39, 1497-1518.e1411. 10.1016/j.ccell.2021.10.001 (2021). 10.1016/j.ccell.2021.10.001 [DOI] [PMC free article] [PubMed] [Google Scholar]
- 57.Erlmeier, F. et al. Prognostic impact of PD-1 and its ligands in renal cell carcinoma. Med. Oncol. (Northwood, London, England)34, 99. 10.1007/s12032-017-0961-y (2017). 10.1007/s12032-017-0961-y [DOI] [PubMed] [Google Scholar]
- 58.Santoni, M. et al. Clinico-pathological features influencing the prognostic role of body mass index in patients with advanced renal cell carcinoma treated by immuno-oncology combinations (ARON-1). Clin. Genitourin. Cancer21, e309–e319. 10.1016/j.clgc.2023.03.006 (2023). 10.1016/j.clgc.2023.03.006 [DOI] [PubMed] [Google Scholar]
- 59.Wang, N., Huang, X. & Cheng, J. BIRC5 promotes cancer progression and predicts prognosis in laryngeal squamous cell carcinoma. PeerJ10, e12871. 10.7717/peerj.12871 (2022). 10.7717/peerj.12871 [DOI] [PMC free article] [PubMed] [Google Scholar]
- 60.Wu, J. et al. Integrated single-cell and bulk characterization of cuproptosis key regulator PDHB and association with tumor microenvironment infiltration in clear cell renal cell carcinoma. Front. Immunol.14, 1132661. 10.3389/fimmu.2023.1132661 (2023). 10.3389/fimmu.2023.1132661 [DOI] [PMC free article] [PubMed] [Google Scholar]
- 61.Bian, Z., Fan, R. & Xie, L. A novel cuproptosis-related prognostic gene signature and validation of differential expression in clear cell renal cell carcinoma. Genes13, 851. 10.3390/genes13050851 (2022). 10.3390/genes13050851 [DOI] [PMC free article] [PubMed] [Google Scholar]
- 62.Kahlson, M. A. & Dixon, S. J. Copper-induced cell death. Science (New York)375, 1231–1232. 10.1126/science.abo3959 (2022). 10.1126/science.abo3959 [DOI] [PubMed] [Google Scholar]
Associated Data
This section collects any data citations, data availability statements, or supplementary materials included in this article.
Data Availability Statement
We obtained the TCGA-KIRC cohort dataset from The Cancer Genome Atlas (TCGA) portal (https://portal.gdc.cancer.gov/).


