

Abstract
HRB500E rebar is a low-alloy high-strength steel with excellent mechanical properties and good plasticity but suffers from deficient corrosion resistance. This can be solved by adding trace elements, including rare earth elements. Herein, the corrosion-resistant behavior of rebar was evaluated by weightlessness testing and electrochemical measurements, and the effects of Ce on the structural evolution of the corrosion product layer were investigated by scanning electron microscopy (SEM), Electron Probe X-ray Micro-Analyzer (EPMA), X-ray diffraction (XRD), and X-ray photoelectron spectroscopy (XPS). The results showed that adding Ce to the rebar improved the densification of the reinforcing surface corrosion products, as well as reduced the corrosion rate of the experimental rebar. Compared to C0 sample without Ce, the rebar sample containing 0.044 wt.% Ce displayed increased Ecorr by 0.051 V, decreased Icorr by 15.573 mA cm−2, enhanced Rc of the corrosion product layer by 112.71 Ω cm2, incremented α-FeOOH content in the corrosion product layer, and boosted ratio of α/γ* in the corrosion product layer by 10.11%. Furthermore, the oxide (CeO2) formed by Ce in the corrosion layer of the rebar bar surface existed in the rust layer, resulting in a stable corrosion product layer with improved blocking ability of the corrosive medium. Overall, the addition of Ce at certain ratios looks promising to produce HRB500E rebar with excellent corrosion resistance and extended service life under harsh conditions.
Keywords: HRB500E rebar, Rare earth, Electrochemistry, Corrosion products, Corrosion resistance
Subject terms: Composites, Metals and alloys
Introduction
HRB500E rebar is a low-alloy high-strength steel with excellent mechanical properties and good plasticity, widely used in high-rise buildings, cross-sea bridges, large-scale water conservancy, nuclear power stations, special high-rise buildings, and other national key projects. In China, HRB500E rebar is employed in large-scale infrastructure construction to improve the strength of building structures and ensure their safety and stability1,2. The demand for HRB500E rebar has increased in recent years due to its complex and diverse operating environments. However, HRB500E rebar suffers from deficient corrosion resistance, especially under humid environments that results in serious corrosion and damage to the steel surface, ultimately reducing the service life3,4. Therefore, enhancing the corrosion resistance of HRB500E rebar is crucial to extend its service life under harsh conditions, such as high humidity.
Various studies revealed that the addition of trace elements to steel may stabilize and compact the corrosion product layer, conducive to steel protection5. The adjustment of the composition of the steel's alloying elements may enhance the stability of the alloy to meet various production requirements. For instance, Zhou et al. recorded an enrichment phenomenon with the Cr element existing within the rust layer, useful for enhancing the compactness of the alloy through selective oxidation and obstructing the ingress of corrosive agents under atmospheric conditions6. Wang et al. carried out experiments based on emulating industrial marine atmospheres involving Cr in steel and noticed that its presence contributed to the densification and enhancement of the corrosion layer protective function7. This process mediated by Cr enrichment actively repaired pre-existing fractures or flaws within the material. The presence of Cr plays a key role in improving the corrosion resistance of low alloy steel by enriching the rust layer and promoting the formation of stable and dense corrosion products, thereby reducing the corrosion process of the base metal8,9. Other elements like Cu and P are also used as trace elements to improve the corrosion resistance of micro-alloyed steel. The enrichment by Cu and P elements in the rust layer allows the conversion of amorphous Fe complexes into amorphous FeOOH in the corrosion products, conducive to the formation of a dense protective rust layer10–12. Under marine atmospheric conditions, advanced nickel micro-alloyed steels may enhance the corrosion resistance due to precipitated NiFe2O4 within the rust layer allowing conversion of the rust layer from γ-FeOOH to α-FeOOH13,14. Moreover, the presence of NiFe2O4 facilitates the formation of a Fe(O,OH)6 nano-network, useful for improving the ionic exchange properties of the corrosion product film and inhibiting the penetration of chloride ions 15,16.
Rare earth elements can also be added to micro-alloyed steels due to their active chemical properties suitable for modifying inclusions, purifying steel, and microalloying17–19. With the rapid development of offshore engineering, the corrosion behaviors of different steel grades in the presence of rare earth elements have widely been studied. For example, Yu et al. added Ce to steel and noticed that high amounts increased the size and number of inclusions, as well as formed a stronger stress field around large-sized inclusions, reducing the resistance to pitting. Yu et al.20 added Ce to steel and demonstrated that high added amounts increased the size and number of inclusions. Large-sized inclusions created a stronger stress field, reducing resistance to pitting. Quan et al. and Ha et al.21,22 independently assessed the impact of added rare earth (RE) elements on the pitting sensitivity of stainless steel. Incorporating RE elements reduced the density and size of inclusions, decreased the pitting initiation sites, and raised the pitting potential. Liu et al. 23comprehensively analyzed the role of RE-modified inclusions in initiating pitting corrosion in RE micro-alloyed steels. They noticed preferentially dissolved RE-O-S type inclusions in simulated marine environments, facilitating the nucleation of pitting at the inclusion sites. Liu et al.24 explored the effects of rare earth elements on the corrosion behavior of weathering steel. They recorded a decrease in the rate of salt spray corrosion after the enrichment with RE elements at the matrix-rust layer interface. Similarly, Wang et al.18 observed that the enrichment with RE elements at the interface encouraged the inward migration of Si4+, P5+, and Cu2+ in advanced low-alloy steels, leading to the formation of a denser rust layer. Mi et al.25 investigated the corrosion resistance of weathering steel containing phosphorus and rare earth elements under a simulated industrial environment. They demonstrated that soluble rare earth in steel can dissolve and release rare earth ions, slowing down the corrosion of the substrate. Yue et al.26 examined the corrosion resistance of copper-phosphorus weathering steels with different rare earth contents in 0.01 mol/L NaHSO3 corrosion solution using dry and wet cyclic immersion accelerated corrosion tests. They illustrated that rare earth elements can significantly improve the densification of the rust layer and enhance its protective properties.
However, research dealing with the impact of rare earth Ce element on corrosion layers formed on steel surfaces is limited, especially in terms of the Ce state existing in the corrosion product layer of steel surfaces. Current research is limited to surface phenomena while the mechanism of rust layer evolution is lacking. Therefore, clarifying the impact of rare earth Ce on corrosion products would be important for advanced applications.
Herein, the effect of the rare earth element Ce on the structural evolution of the corrosion layer of HRB500E rebar was examined by various techniques, including SEM, EPMA, XRD, and XPS. A corrosion mechanism was proposed to provide a theoretical reference for the production of HRB500E rebar with excellent corrosion resistance.
Materials and methods
Reagents
The experimental rebar was first smelted in a ZG-0.0025 vacuum induction melting furnace, and specimens with various contents of cerium (Ce) were prepared using HRB500E steel as the base material and Ce particles with 99.9% purity to yield a series of samples with different levels of Ce in steel. For comparison, HRB500E steel without Ce was used as reference steel. After deoxidation of steel with aluminum, the metal was forged to a thickness of 20 mm and cooled to room temperature.
The compositions of steel samples were analyzed using analytical various methods. The carbon and sulfur contents were analyzed by an HX-HW8B analyzer. The contents of Si, Mn, P and other conventional elements, as well as the added rare earth Ce, were determined by Inductively plasma emission spectroscopy (ICP-MS). The compositions of the experimental samples are listed in Table 1.
Table 1.
Chemical compositions of various rebar samples (wt.%).
| Sample | C | S | P | Si | Mn | Ce |
|---|---|---|---|---|---|---|
| C0 | 0.248 | 0.045 | 0.045 | 0.711 | 1.582 | – |
| C1 | 0.248 | 0.045 | 0.045 | 0.712 | 1.582 | 0.023 |
| C2 | 0.247 | 0.045 | 0.045 | 0.711 | 1.584 | 0.044 |
| C3 | 0.248 | 0.044 | 0.045 | 0.711 | 1.583 | 0.065 |
The prepared experimental rebar was cut into 10 mm cubic specimens. The resulting samples were polished using an Al2O3 abrasive with a roughness of 0.5 μm followed by cleaning with deionized water and alcohol, then air-dried for subsequent use. The surface of each sample was etched with a 4% nitric acid alcohol solution, and the microstructure was examined by scanning electron microscopy (SEM, JSM-6510).
Immersion experiments and electrochemical measurements
The samples were sealed with epoxy resin and only one side (area 10 mm × 10 mm) was exposed for immersion testing and electrochemical measurements. To ensure accurate results, three identical samples were used for each test under the conditions of 3.5 wt.% NaCl solution (pH 7.05) concocted from deionized water and 99.5% pure NaCl powder. After solution preparation, all samples were immersed in a 3.5 wt.% NaCl solution for 960 h without stirring. Before immersion, the weight of each test specimen was measured. After corrosion, the weight was descaled in a mixed solution containing deionized water (500 ml), hydrochloric acid (500 ml), and hexamethylenetetramine (3.5g)27. After descaling, the test specimen was weighed again, and the corrosion rate was calculated by Eq. (1) 28:
| 1 |
where v represents the corrosion rate (g m–2 h−1), ΔM is the mass lost by the specimen before and after corrosion (g), S denotes the exposed area (m2), and T refers to the immersion time (h).
The electrochemical measurements of rusted samples were carried out in a three-electrode system connected to a CHI660E electrochemical workstation using the platinum sheet as a counter electrode, saturated calomel electrode (SCE) as reference electrode, and the corroded sample as a working electrode (Fig. 1). Before the electrochemical measurements, the OCP was monitored for 1 h until reaching a steady state. Electrochemical impedance spectroscopy (EIS) tests at an amplitude of 10 mV and a frequency range of 10 mHz to 100 kHz were then performed. The obtained Nyquist impedance plots, Bode phase angle plots, and Bode modulus plots were fitted using Zview software. Finally, the kinetic potential polarization tests were performed at the scanning rate of 0.5 mV/s and voltage range of −0.8 to + 0.9 V (versus OCP). The self-corrosion current density and self-corrosion potentials of the reinforcement bars were determined by the Tafel linear extrapolation method.
Figure 1.
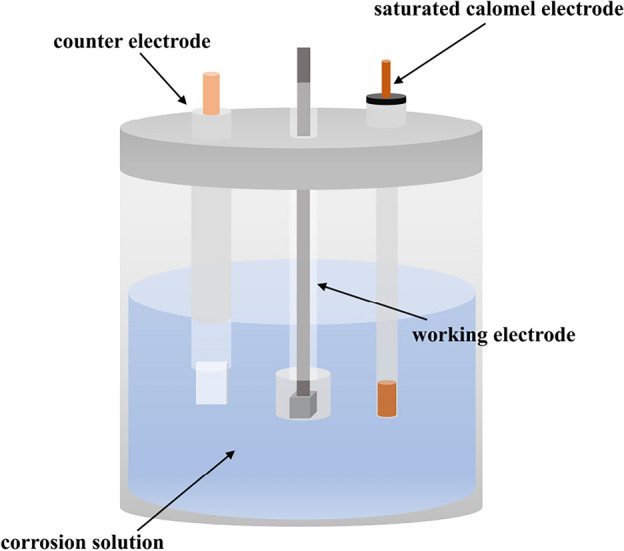
Schematic representation of the three-electrode system.
Corrosion product layer representation and phase analysis
The surfaces and cross-sectional morphologies of the corrosion product layers were observed using scanning electron microscopy (SEM, ZEISS Sigma 300) and electron probe microanalysis (EPMA, JEOL JXA-iHP200F), respectively. The corrosion morphology by SEM was carried out at an accelerating voltage of 3 kV using an SE2 secondary electron detector to optimize the image quality while obtaining detailed information about the sample surface. To calculate the thickness of the corrosion product layer and further analyze the thickness and elemental distribution of the rust layer, the EPMA images of the cross-section morphologies were analyzed using Image-Pro software.
The crystal structures of the corrosion products were analyzed by X-ray diffraction XRD (Bruker D8 Advance) after scraping from the surface of the rebar and finely ground. The XRD conditions were set to an excitation source of Cu target, scanning range of 10°–90°, scanning speed of 5°/min, operating current of 40 mA, and operating voltage of 40 kV.
Specimens with a size of 5 mm × 5 mm × 3 mm were used for immersion experiments according to the test requirements. The specimens were removed after immersion and fixed to a sample tray after stabilization of the rust layer followed by placing them in a Thermo Scientific K-Alpha XPS (X-ray Photoelectron Spectroscopy) chamber. The sample was then transferred to the analysis chamber for detection after the pressure in the sample chamber dropped below 2.0 × 10⁻⁷ mbar. The conditions consisted of Al Kα rays as an X-ray source, spot diameter of 400 μm, operating voltage of 12 kV, filament current of 6 mA, energy transfer of 150 eV, and scan step size of 1 eV. The measured XPS spectral results were calibrated using Advantage software and the charge correction was carried out according to the standard C1s peak (284.8 eV).
Results and discussion
Effect of Ce content on microstructure and mechanical properties of rebar
As shown in Fig. 2, the microstructures of the four experimental rebars (C0, C1, C2, and C3) were mainly composed of ferrite and pearlite. The ferrite possessed an irregular polygonal shape with distinct smooth grain boundaries, while pearlite depicted a layered structure. According to Fig. 2b–d, the addition of Ce increased the percentage of pearlite. The counted lamellar spacing and percentage of pearlite using Image Pro software (Fig. 3a, b) revealed that the addition of Ce significantly refined the pearlite lamellar spacing of the experimental rebar (Fig. 3a). The percentage of pearlite also rose significantly, as shown in Fig. 3b. By comparison, the decrease in pearlite lamellar spacing and increase in the percentage of pearlite enhanced the strength of the rebar. However, the refining of the lamellar spacing of the bodies weakened, and the percentage of pearlite decreased at high added amounts of Ce. As depicted by the stress–strain curves of the four experimental steels (Fig. 3c), the addition of Ce increased the yield and tensile strength of the rebar to a certain extent. Among samples, the C2 rebar displayed the best mechanical properties with a yield strength of 589.04 MPa and a tensile strength of 745.73 MPa.
Figure 2.

Microstructures of experimental steels: (a) C0 rebar, (b) C1 rebar, (c) C2 rebar, and (d) C3 rebar.
Figure 3.

(a) Pearlitic lamellar spacing of experimental rebar, (b) pearlitic percentage of experimental rebar, and (c) stress–strain curve.
Weightlessness experiments
The corrosion rates and weight losses of rebar with different Ce contents in the immersion tests are compared in Fig. 4. The corrosion rates of C0, C1, C2, and C3 rebar specimens showed a similar but differentiated trend. Each group of specimens experienced a process consisting of first increasing and then slowly decreasing until leveling off during the corrosion process. During the corrosion for 384 h (16 days), the corrosion rate of C0 rebar showed a short-lived upward trend attributed to the formation of corrosion products at the beginning of the corrosion process. The resulting corrosion product layer structure looked loose and unstable with the tendency of easily falling off. The rate of the formation of corrosion products was less than that of corrosion products falling off, reducing the effective protection effect of the corrosion layer of the substrate material29. After 576 h (24 days) of corrosion, the corrosion rate of the experimental steel was minimized, with the corrosion rates of C0, C1, C2, and C3 rebars estimated to be 0.483 g m−2 h−1, 0.445 g m−2 h−1, 0.420 g m−2 h−1, and 0.456 g m−2 h−1, respectively. Thus, the corrosion product layer on the experimental rebar surface gradually became flat and continuous, improving the barrier protection of the steel matrix. Accordingly, the addition of Ce element to steel promoted the formation of a corrosion product layer with a protective effect, conducive to improving the long-term corrosion resistance of the rebar. Compared to the pristine rebar, the overall corrosion rate of the Ce-added experimental rebar was significantly reduced. Among samples, C3 showed a relatively high corrosion rate throughout the corrosion process, indicating that the addition of rare earth Ce would not always reduce the corrosion rate.
Figure 4.

(a) Corrosion rates and (b) weight losses of rebar with different Ce contents in the immersion tests.
Effect of Ce content on corrosion resistance of experimental rebar
EIS analysis
The Nyquist impedance plots and Bode curves of the four steels prepared with different Ce contents are shown in Fig. 5. The impedance diagrams were all composed of capacitive arcs, with the diameter directly correlated with a material's corrosion resistance30. Compared to the control sample C0 without Ce, the capacitive arc diameters of the rebar samples increased after the addition of Ce (Fig. 5a), with sample C2 exhibiting the most substantial capacitive arc. The increasing arc radius unequivocally suggested an enhancement in the corrosion resistance of the rebar due to Ce incorporation. Moreover, the maximum phase angle, especially at 0.01 Hz, indicated the material efficacy in hindering substrate dissolution. A larger maximum phase angle would mean higher resistance to solubility and consequently diminished corrosion losses. In Fig. 5b, d, the maximum phase angle enhanced after the addition of Ce to the rebar, improving the protective effect of the corrosion product layer on the substrate and inhibiting corrosion dissolution of the substrate.
Figure 5.

(a) Nyquist plots, (b,c) Bode plots, (d) phase angle at the fixed frequency (f = 0.01 Hz), (e) |Z|f=0.01 Hz, (f) equivalent circuit diagrams, (g) fitting results of Rc, and (h) fitting results of Rct.
The corrosion product layer's resistance was further evaluated using the low-frequency impedance modulus (|Z|f = 0.01Hz) depicted in the Bode plot as a critical semi-quantitative metric quantity. An elevated |Z|f = 0.01Hz value would indicate a heightened limitation on charge transfer, reflecting the impeded penetration of the electrolyte solution and corrosive medium into the substrate. The |Z|f = 0.01Hz of rebar samples with varying Ce contents in Fig. 5c, e highlighted a correlation between the increase in |Z|f = 0.01Hz and Ce content. The maximum value was observed with C2 rebar, inferring Ce enrichment fostering the corrosion product layer's stability and density, thereby diminishing the substrate's susceptibility to corrosion under such environments.
The EIS data were fitted by the equivalent circuit shown in Fig. 5f, where Rs represents the solution resistance, Rc is the corrosion product layer resistance, CPEc refers to the corrosion product layer capacitance, Rct is the charge transfer resistance, and CPEdl denotes the capacitance of the double layer formed between the metal and the solution corresponding to the charge transfer process at the interface between the steel substrate and the electrolyte solution during the electrochemical reaction31. CPE can be defined as follows32:
| 2 |
where CPE0 and n represent the admittance value and fitting index of the constant phase element CPE, with the n value ranging between 0 and 1. z is the angular frequency and i2 = 1.
The effective capacitance Cc of the corrosion product film and the effective capacitance Cdl of the double layer can be calculated according to the Brug formula, Hsu formula and Mansfeld formula 33–37:
| 3 |
| 4 |
The fitting results of Rc, Cc, Rct, and Cdl using the equivalent circuit of Fig. 5f are provided in Fig. 5g, h. The Rc, and Rct of the Ce-added samples were all higher than those of the original rebar. The increase in Rc indicated a rise in the densification of the corrosion product layer. Also, with the highest Rc and Rct values recorded with the C2 sample (247.44 Ω cm2 and 670.88 Ω cm2, respectively). By comparison, the Rc and Rct of C3 decreased to 173.19 Ω cm2 and 610.04 Ω cm2, respectively. Therefore, the introduction of Ce into the corrosion product layer significantly boosted the protective barrier effect of the substrate, effectively obstructing the interfacial charge transfer process and thereby mitigating the penetration of corrosive agents to the substrate surface. Nonetheless, excessive incorporation of Ce reduced the compactness of the corrosion product layer, leading to the emergence of microscopic porosities and consequent diminution of the restrictive interfacial charge transfer by the protective layer.
Potentiodynamic polarization curve analysis
The Tafel plots were derived by applying linear regression to the semi-logarithmic representation of the current density as a function of the potential in the cathodic and anodic domains. The linear equations can be described as follows38:
| 5 |
| 6 |
The Tafel extrapolation method is shown in Fig. 6a, and the taken values of βα and βc are displayed in Fig. 6b. Tafel extrapolation was used to fit the polarization curves of corrosion specimens with different Ce additions and the statistical results are provided in Fig. 6c, d. Obviously, the addition of Ce shifted the potentiodynamic polarization curves to the upper left corner (Fig. 6c), indicating improved protection of the corrosion product layer against substrate corrosion. The Tafel fitting results revealed an upward shift of the potentiodynamic polarization curves of each experimental rebar during the corrosion process to positive potentials, suggesting gradually improved corrosion protection performance of the corrosion product layer on the substrate. Ecorr gradually increased with the addition of Ce, inferring that the addition of rare earth element Ce can effectively improve the thermodynamic stability of the experimental rebar in a specific corrosive medium, thereby reducing its tendency to anodic dissolution reaction39. The trend of Icorr was opposite to that of Ecorr because the addition of rare earth Ce promoted the formation of a denser and more stable corrosion product layer. The latter effectively inhibited the dissolution process of the substrate material, thereby decreasing the corrosion current density and hindering the cathodic reaction for reduced corrosion rate of the experimental steel40,41. The C2 sample displayed the lowest Icorr of 3.35 mA cm−2 and the highest Ecorr of −0.667 V, indicating optimal corrosion resistance. By comparison, the C3 sample depicted increased Icorr of 5.98 mA cm−2 and decreased Ecorr of −0.686 V. Hence, the presence of Ce in solid solution in the rebar enhanced the potential of the substrate surface, suitable for increasing the thermodynamic stability of the matrix40. Overall, the potentiodynamic polarization studies corroborated the impedance analysis, suggesting the weakened beneficial influence of Ce in the solid solution at excess concentrations42. Such reduction can be attributed to lattice distortion, intensifying the rebar's susceptibility to corrosion. Consequently, the efficacy of the corrosion product layer can be compromised under the established regime, manifested in reduced Ecorr and an escalated Icorr42.
Figure 6.

(a) Tafel extrapolation method. (b) Electrochemical parameters: βa and βc values. (c) Potentiodynamic polarization curves of rebars with different Ce contents in the solution. (d) Tafel fitting results.
Comprehensive analysis of corrosion product layers
SEM analysis
The corrosion products formed on the surface of the experimental steel were linked to the corrosion rates. The microscopic morphologies of the oxides formed on the rust layer of the experimental rebar surface viewed by SEM are presented in Fig. 7. The surface of the specimen showed a typical flower-cluster corrosion morphology during the immersion process, mainly attributed to the non-uniform distribution of the corrosive medium on the steel specimen surface and the deposition effect. During the corrosion process and compared to the original rebar without Ce, the corrosion products of the experimental rebars with different additions of Ce showed better corrosion uniformity. The addition of Ce also resulted in a dense rebar rust layer. In the initial stage of corrosion, the main corrosion products consisted of γ-FeOOH, indicating the dominant role played by iron oxides in this stage. A small amount of Ce-containing oxide particles may also be attached to the surface of the rust layer, enriching the structural properties of the rust layer. According to the literature, γ-FeOOH often formed as aggregates resembling petal fracture surfaces, whereas α-FeOOH formed as porous and acicular or rectangular lamellar, together constituting the complex structure of the rust layer 40. As displayed in Fig. 7c, the C2 rebar had more acicular α-FeOOH and the most stable rust layer.
Figure 7.

Morphologies of corrosion products of the four experimental steel: (a) C0 rebar, (b) C1 rebar, (c) C2 rebar, and (d) C3 rebar.
Electron microprobe analysis
The cross-sectional morphologies and elemental compositions of the corrosion product layers with various Ce concentrations were examined by electron microprobe analysis (Fig. 8). The corrosion product layer of the control sample (C0) showcased pronounced cracks with a loose and porous structure (Fig. 8a), indicative of suboptimal densification and minimal substrate protection at this stage. Conversely, the incorporation of Ce led to reduced thickness of the corrosion product layer but significantly enhanced densification, concurrently diminishing the prevalence of cracks and porosities. However, the density of the internal corrosion product layer of the C3 sample was relatively lower than that of C2. The reason for this might have to do with the excess Ce polarized at grain boundaries or defects to induce high chemical activity at this location. This resulted in unstable corrosion products on the rebar surface, which, in turn, intensified the corrosion of the rebar for increased corrosion rate as mentioned earlier. In terms of elemental distribution, the absence of Ce in the rebar resulted in uniformly dispersed oxygen element in the rebar matrix and throughout the layer without obvious areas of enrichment. However, water infiltration facilitated the contact of the oxygen element with the rebar matrix, together with the deposition of chloride ions, conducive to corrosion dissolution of the matrix. In Fig. 8, Ce enrichment was observed at the junction of the corrosion layer and the substrate, hindering the contact of oxygen and chloride ions with the substrate for better protection. The lower Rct value of the C0 sample indicated the presence of more crack defects in the corrosion product layer, facilitating the passage of current through the corrosion product layer for reduced resistance. The formed crack defects in the corrosion layer weakened its ability to limit the infiltration of the electrolyte solution to the substrate. This also weakened the dissolved oxygen in the water reduction reaction, forming a corrosion products layer with poor densification. In Fig. 8, the addition of Ce also reduced the holes in the corrosion product layer and enhanced its blocking ability to the corrosive medium. Therefore, chloride ions and oxygen gradually accumulated in the corrosion product layer, consistent with the literature.
Figure 8.

Distribution of elements in the rust layer of four experimental rebars after 40 days of corrosion: (a) C0 rebar, (b) C1 rebar, (c) C2 rebar, and (d) C3 rebar.
XRD analysis of corrosion products
The impact of Ce addition on the composition of the corrosion product layer was studied by XRD and the results are displayed in Fig. 9. The corrosion product layers predominantly comprised γ-FeOOH, β-FeOOH, α-FeOOH, and a mixture of Fe3O4/Fe2O3 across all samples. The differences in the XRD peak intensities and breadths among the four samples suggested a direct effect of Ce concentration on the compositional balance within the corrosion product layer. Previous studies highlighted γ-FeOOH as electrochemically active and least stable form among all proposed components with characteristics of forming porous structures, serving as conduits for corrosive mediums to infiltrate the substrate for expedited substrate corrosion. Consequently, minimizing the formation of γ-FeOOH can mitigate the corrosion acceleration process 40. However, γ-FeOOH may dissolve to generate amorphous FeOOH after solid-state transformation and form stable Fe2O3 and α-FeOOH. The crystal structure of Fe2O3 would be more dense and thermodynamic stable while α-FeOOH can be ranked as the most thermodynamically stable hydroxyl iron oxide. The strongest protective effect to prevent corrosive ions from intruding into the substrate would result in a good rust layer with a better corrosion protective effect. The addition of Ce decreased the proportion of γ-FeOOH and increased the proportion of α-FeOOH. As a result, the addition of Ce promoted the conversion of γ-FeOOH to α-FeOOH in the corrosion product layer and enhanced its protective effect.
Figure 9.

XRD results of the corrosion product layers with different Ce additions after immersion tests.
The protective efficacy of the corrosion product layer can be evaluated by the ratio α/γ*, where α denotes the content of α-FeOOH and γ* encapsulates the combined contents of γ-FeOOH, β-FeOOH, and Fe3O4/Fe2O343. The comparative analysis revealed that samples alloyed with Ce had elevated α/γ* ratios when compared to their unalloyed counterparts. Thus, the addition of Ce fortified the corrosion product layer's defensive capability against substrate degradation. However, the C3 rebar illustrated a decreasing trend of α/γ* ratio when compared to the C2 rebar, attributed to the high added content of Ce and the large ionic radius of Ce that may resulted in lattice distortion and increased corrosion susceptibility of the rebar. Combined previous studies revealed that excess Ce resulted in the reduced conversion of γ-FeOOH to α-FeOOH in the corrosion product layer. Also, the content of α-FeOOH was declined, the porosity of the corrosion product layer enhanced, and the protective effect of the corrosion product layer was diminished.
XPS analysis of corrosion products
The addition of Ce to rebar facilitated the conversion of γ-FeOOH to α-FeOOH within the corrosion product layer and enhanced the layer's efficacy in impeding water permeation. To gain an in-depth understanding of the compositional nuances in Fe, Ce, and O in the samples, the corrosion product layers were further analyzed by the XPS technique. As shown in Fig. 10a–d, the XPS analysis of the Fe 2p3/2 orbitals revealed the presence of seven significant spectral characteristic peaks. One of the main Fe 2p3/2 peaks at 710.2 eV corresponded to the Fe2O3 iron oxide, while the multiple peaks at 727.7 eV, 730.2 eV, and 733.7 eV were closely related to the Fe3O4 structure. The two peaks at 713.8 eV and 724.3 eV of Fe 2p3/2 can be attributed to FeOOH44. From Fig. 10a–d, the relative proportion of FeOOH displayed an increasing trend after the addition of Ce, along with the proportion of Fe2O3. However, the relative content of Fe3O4 showed less fluctuation. Thus, the addition of rare earth element Ce to the experimental rebar could effectively promote the generation of stable phase FeOOH and Fe2O3 in the corrosion product layer. The accumulation of these phases in the corrosion product layer would enhance the resistance of the entire corrosion layer to the external environment, as well as improve the corrosion resistance of the experimental rebar. The addition of the Ce element optimized the microstructure and composition of the corrosion product layer, conducive to the formation of a denser and more stable protective layer suitable for effectively delaying the corrosion process of rebar in the marine environment.
Figure 10.

XPS spectra of Fe element in the rust layer after corrosion of four experimental rebars: (a) C0 rebar, (b) C1 rebar, (c) C2 rebar, and (d) C3 rebar.
The XPS characteristics of elemental O in the surface corrosion product layer of the experimental rebar were given in Fig. 11. The first significant peak corresponded to the position of the lower binding energy, showing predominant oxygen in the form of H2O molecules originated from the presence of adsorbed or crystalline water within the corrosion product. The other two O 1s peaks were linked to FeOOH and Fe2O3. A comparison of the corrosion samples of different experimental rebars clearly showed an increase in the peak intensity of the O 1s spectrum of the corrosion products in the experimental rebar as a function of the amount of added rare-earth Ce as compared to the experimental rebar without Ce. Moreover, the content of Fe2O3 showed a gradual increase with the addition of rare earth Ce. The peak intensities of O1s in the corrosion products of the C2 rebar reached a maximum as the corrosion product layer became enriched with elemental oxygen. Also, the corrosion product layer showed higher density and corrosion resistance, consistent with Fig. 8. Meanwhile, the addition of rare earth element Ce could effectively promote the generation of α-FeOOH and Fe2O3, two iron oxide phases with high thermodynamic corrosion stability for improved overall densification of the corrosion product layer.
Figure 11.

XPS spectra of O element in the rust layer after corrosion of four experimental steels at different times: (a) C0 rebar, (b) C1 rebar, (c) C2 rebar, and (d) C3 rebar.
The XPS features of the 3d orbitals of the element Ce in the experimental rebar providing the state of Ce in the corrosion product layer are provided in Fig. 12. According to the relevant literature, CeO2 can be more thermodynamically stable than Ce(OH)3, meaning facile CeO2 formation in the corrosion layer on the rebar surface45. The XPS analysis of Ce revealed the presence of the 3d peak, usually used to determine the oxidation state of elemental Ce. The positions and shapes corresponded to different oxidation states. The 3d peak was usually located around 880–890 eV in 3-valent compounds of Ce, while situated around 900–910 eV in 4-valent compounds of Ce46. As shown in Fig. 12b–d, the spectral fitting analysis of the three experimental rebar samples containing rare-earth Ce showed two distinct characteristic peaks of Ce 3d spectra of all the samples. The analyses revealed CeO2 and Ce(OH)3 as substances corresponding to both peaks, indicating facilitated generation of compounds in the presence of Ce within the product layer during the rusting process. The gradual increase in Ce content in the experimental steels first raised the intensity of the Ce 3d spectral peaks and then declined, consistent with Fig. 8. These data together confirmed the influencing mechanism of Ce on optimizing the composition and structure of the corrosion products in a specific content range.
Figure 12.

XPS spectra of Ce element in rust layer of experimental rebar containing Ce after 40 days of corrosion: (a) 4 types of rare earth rebar, (b) C1 rebar, (c) C2 rebar, and (d) C3 rebar.
The XPS semi-quantitative analysis of Fe 2p in Fig. 13a revealed an increase in the ratios of Fe2+/Fe3+ and FeOOH/(Fe2+ + Fe3+) in the layer of corrosion products of the experimental rebar after the addition of Ce. In the C2 rebar, the ratios of Fe2+/Fe3+ and FeOOH/(Fe2+ + Fe3+) reached maximum values of 1.49 and 1.89, respectively. Thus, Ce favored the formation of a denser corrosion product layer. Similarly, the XPS semi-quantitative analysis of O ls in Fig. 13b showed an enhancement in the O2−/OH− of the experimental steels after the addition of Ce, with the highest O2−/OH− ratio of 1.45 obtained for the corrosion product layer of C2 rebar. The XPS semi-quantitative analysis of Ce 3d in Fig. 13c also depicted the highest Ce4+/Ce3+ ratio in the corrosion product layer of C2 rebar. However, the Ce4+ contents in the corrosion product layers of all three experimental steels containing Ce were above that of Ce3+. As a result, Ce formed more CeO2 than Ce(OH)4 in the corrosion layer of the rebar. Thermodynamically, this can be attributed to the better stability of CeO2 than that of Ce(OH)445. Also, the oxide of Ce enriched the structure of the corrosion layer and effectively improved the corrosion resistance of the corrosion layer.
Figure 13.

Semi-quantitative analysis of XPS results.
Corrosion mechanism
Based on the above results, a mechanism dealing with the combined effects of rare earth Ce on the transformation of substances in the corrosion product layer of the experimental rebar was proposed (Fig. 14). In a corrosive solution, rebar first reacted with oxygen and water following Eq. (7) 5:
| 7 |
Figure 14.

Corrosion mechanism of four experimental steels: (a) C0 rebar, (b) C1 rebar, (c) C2 rebar, and (d) C3 rebar.
Fe(OH)2 was then oxidized to form γ-FeOOH as a thermodynamically unstable substance, which, in turn, converted to α-FeOOH in the presence of oxygen and contributed to the formation of Fe3O4. The resulting Fe3O4 reacted with oxygen to form Fe2O3 with higher thermodynamic stability according to Eqs. (8)–(10) 47:
| 8 |
| 9 |
| 10 |
The ratio of α-FeOOH to Fe2O3 in the corrosion product layer increased with the corrosion process and the amount of added rare earth Ce. The increase in the proportion of highly stable corrosion products effectively reduced the dissolution and shedding of corrosion products on the substrate surface during the formation of corrosion products, forming a dense layer of corrosion products on the substrate surface. The enhanced densification of the corrosion product layer reduced the defects on the corrosion product layer surface, as well as declined the transmission channels for corrosive media to contact the substrate, improving the corrosion resistance of the rebar. The addition of Ce rare earth to rebar resulted first in combination with O and S. Unconsumed rare earth elements existing in the form of solid solution and intermetallic compounds easily dissolved in corrosive media due to their chemical instability. In the anode region, a series of reactions took place as shown by Eqs. (11)–(16):
| 11 |
| 12 |
| 13 |
| 14 |
| 15 |
| 16 |
The cathodic reaction consisted of mainly a reduction reaction of oxygen. The OH- produced by the reaction increased the pH in the cathodic region. The Ce dissolved in the corrosion medium generated more oxide or hydroxide in the cathodic region, preventing the contact between oxygen and Cl− with the substrate surface. This, in turn, suppressed the cathodic reaction and reduced the self-corrosion current density, improving the corrosion resistance of experimental rebar. In addition, Ce3+ further oxidized into Ce4+ to produce CeO2, slowing down the corrosion of the experimental rebar. The corrosion mitigation precipitation reaction can be expressed as below:
| 17 |
| 18 |
| 19 |
| 20 |
| 21 |
Thus, the rare earth element Ce was involved in the formation of the corrosion product layer by reacting with hydroxide ion OH− to form Ce(OH)3 followed by subsequent oxidation to CeO2. These reactions underscored Ce's role in facilitating the formation of α-FeOOH and Fe2O3 within the corrosion layer, thereby augmenting the protective capability of the corrosion product layer on the substrate. Moreover, the presence of Ce oxides and hydroxides enhanced the layer's cation selectivity and anion repulsion, effectively inhibiting Cl− penetration and bolstering the layer's ability to obstruct Cl−. Consequently, the corrosion product layer with enhanced barrier effect precluded Cl− from reaching the substrate's surface as corroborated by electrochemical parameters (Rct and Rc). This indicated Ce's efficacy in densifying the corrosion product layer, directly improving the resistance to infiltration of corrosive agents like Cl− for elevated overall corrosion resistance of the steel. The addition of Ce showed a double effect on the corrosion resistance of the experimental steel. The very small solid solution of rare earth Ce element in the liquid steel resulted in maximum solid solubility of Ce in the experimental steel at Ce content exceeding a certain critical value. At this stage, the beneficial effect decreased due to the solid solubility state of Ce in the steel matrix reaching a state of supersaturation.
Conclusions
The effects of different Ce contents on the long-term corrosion behavior of high-strength seismic rebar in simulated marine environments were successfully investigated by weightlessness experiments, electrochemical analyses (polarization curves and impedance spectra), and corrosion product analyses (SEM, EPMA, XRD, Raman, and XPS). The following conclusions can be drawn:
Compared to the experimental rebar without rare earth Ce, the experimental rebar with added 0.044 wt.% Ce showed an increase in self-corrosion potential (Ecorr) of the experimental rebar from −0.718 V to −0.667 V, a decline in the self-corrosion current density (Icorr) from 18.923 to 6.350 mA cm−2, and an enhancement in the resistance of the corrosion product layer (Rc) from 134.73 to 247.44 Ω cm2. Hence, the corrosion product layer possessed enhanced densification, effectively hindering the charge transfer process and preventing the corrosive medium from contacting the substrate.
The corrosion product layer in the experimental rebar without Ce displayed obvious cracks with a loose and porous structure. The addition of Ce changed the surface and cross-sectional morphology of the corrosion product layer and reduced the crack defects. Compared to the experimental rebar without added rare earth Ce, the thickness of the corrosion product layer of the experimental rebar containing 0.044 wt.%. Ce decreased from 324.45 to 224.35 μm and the densification of the corrosion product layer was significantly increased.
The presence of rare-earth Ce promoted the generation of the stable corrosion product α-FeOOH. Compared to the experimental rebar without rare-earth Ce, the addition of 0.044 wt.% Ce increased the α/γ* ratio in the corrosion product layer of the experimental rebar from 33.6 to 43.71%. The oxide CeO2 formed during corrosion enhanced the stability of the corrosion product layer, improved the barrier ability of the corrosion product layer to the corrosive medium, and boosted the corrosion resistance of the experimental rebar.
Acknowledgements
This work was supported by National Nature Science Foundation of China [grant number 52074095]; Guizhou Provincial Basic Research Program (Natural Science) (grant number QKHJC-ZK [2023] YB072); Guizhou Provincial Key Technology R&D Program (grant number QKHZC [2023] YB404); Guizhou Provincial Key Technology R&D Program (grant number QKHZC [2022] YB053); Guizhou Provincial Department of Science and Technology Qianke Synthetic Fruit [2023] General 100 (grant number QKHCG [2023] YB100); Shougang Shuicheng Iron & Steel (Group) Co., Ltd. Project (grant number HT-JSFW-202302-01); Guizhou Provincial Program on Commercialization of Scientific and Technological Achievements Application and Demonstration of Green Production Technology (grant number QKHCG [2024]YB108).
Author contributions
Tianyou Wang: Writing-original draft, Investigation, Data curation. Shangjun Gu: Data curation. Jie Wang: Data curation. Fulong Wei: Data curation. Xiang Xie: Data curation. Zeyun Zeng: Validation, Supervision. Yafei Jiang: Writing-review & editing, Data curation. Hongfeng Shi: Writing-review & editing, Data curation. Changrong Li: Funding acquisition, Data curation. Zhiying Li: Software, Resources, Funding acquisition, Data curation.
Data availability
The datasets generated and/or analyzed during the current study are available from the corresponding author on reasonable request.
Competing interests
The authors declare no competing interests.
Footnotes
Publisher's note
Springer Nature remains neutral with regard to jurisdictional claims in published maps and institutional affiliations.
References
- 1.Li, T. & Qin, M. Effect of rare earth on the characterization of corrosion of low carbon steel in Csp. In Recent Advances in Structural Integrity Analysis—Proceedings of the International Congress (APCF/SIF-2014) (Ye, L. ed.). 375–379 (Woodhead Publishing, 2014).
- 2.Yang, J. C., Yu, H. C. & Wang, X. Y. Effect of the Ce on behavior of corrosion resistance and mechanical properties of A36 plate steel for shipbuilding. In Recent Advances in Structural Integrity Analysis—Proceedings of the International Congress (APCF/SIF-2014) (Ye, L. ed.). 380–385 (Woodhead Publishing, 2014).
- 3.Ma, P. F., Fan, L. & Chen, G. D. Hyperspectral reflectance for determination of steel rebar corrosion and Cl− concentration. Constr. Build. Mater.368, 130506 (2023). 10.1016/j.conbuildmat.2023.130506 [DOI] [Google Scholar]
- 4.Park, J. S., Lee, S. C., Choi, J. K. & Kim, S. J. Advanced Hadfield steel with Cr-optimization resists against corrosion and erosion-corrosion. Appl. Surf. Sci.637, 157875 (2023). 10.1016/j.apsusc.2023.157875 [DOI] [Google Scholar]
- 5.Zhang, T. Y., Xu, X. X., Li, Y. & Lv, X. W. The function of Cr on the rust formed on weathering steel performed in a simulated tropical marine atmosphere environment. Constr. Build. Mater.277, 122298 (2021). 10.1016/j.conbuildmat.2021.122298 [DOI] [Google Scholar]
- 6.Zhou, Y. L., Chen, J., Xu, Y. & Liu, Z. Y. Effects of Cr, Ni and Cu on the corrosion behavior of low carbon microalloying steel in a Cf− containing environment. J. Mater. Sci. Technol.29, 168–174 (2013). 10.1016/j.jmst.2012.12.013 [DOI] [Google Scholar]
- 7.Wang, J. S., Shi, P. Y., Liu, C. J. & Jiang, M. F. Corrosion behavior of S450Ew low-alloy weathering steel in cyclically alternate corrosion environments. J. Iron Steel Res. Int.22, 1020–1023 (2015). 10.1016/S1006-706X(15)30106-0 [DOI] [Google Scholar]
- 8.Liu, W. M. et al. Synergisic effect of Mn, Cu, P with Cr content on the corrosion behavior of weathering steel as a train under the simulated industrial atmosphere. J. Alloy. Compd.834, 155095 (2020). 10.1016/j.jallcom.2020.155095 [DOI] [Google Scholar]
- 9.Qian, Y. H., Ma, C. H., Niu, D., Xu, J. J. & Li, M. S. Influence of alloyed chromium on the atmospheric corrosion resistance of weathering steels. Corros. Sci.74, 424–429 (2013). 10.1016/j.corsci.2013.05.008 [DOI] [Google Scholar]
- 10.Choi, Y., Shim, J. & Kim, J. Effects of Cr, Cu, Ni and Ca on the corrosion behavior of low carbon steel in synthetic tap water. J. Alloy. Compd.391, 162–169 (2005). 10.1016/j.jallcom.2004.07.081 [DOI] [Google Scholar]
- 11.Misawa, T., Asami, K., Hashimoto, K. & Shimodaira, S. The mechanism of atmospheric rusting and the protective amorphous rust on low alloy steel. Corros. Sci.14, 279–289 (1974). 10.1016/S0010-938X(74)80037-5 [DOI] [Google Scholar]
- 12.Misawa, T., Kyuno, T., Suëtaka, W. & Shimodaira, S. The mechanism of atmospheric rusting and the effect of Cu and P on the rust formation of low alloy steels. Corros. Sci.11, 35–48 (1971). 10.1016/S0010-938X(71)80072-0 [DOI] [Google Scholar]
- 13.Fan, Y. et al. Corrosion behaviors of carbon steel and Ni-advanced weathering steel exposed to tropical marine atmosphere. J. Mater. Eng. Perform.29, 6417–6426 (2020). 10.1007/s11665-020-05153-6 [DOI] [Google Scholar]
- 14.Wu, W., Cheng, X., Hou, H., Liu, B. & Li, X. Insight into the product film formed on Ni-advanced weathering steel in a tropical marine atmosphere. Appl. Surf. Sci.436, 80–89 (2018). 10.1016/j.apsusc.2017.12.018 [DOI] [Google Scholar]
- 15.Chen, X., Dong, J., Han, E. & Ke, W. Effect of Ni on the ion-selectivity of rust layer on low alloy steel. Mater. Lett.61, 4050–4053 (2007). 10.1016/j.matlet.2007.01.014 [DOI] [Google Scholar]
- 16.Fu, G. Q., Zhu, M. Y. & Gao, X. L. Rust layer formed on low carbon weathering steels with different Mn, Ni contents in environment containing chloride ions. Mater. Sci.-Medzg.22, 501–505 (2016). [Google Scholar]
- 17.Tang, M. et al. Mechanism Understanding of the role of rare earth inclusions in the initial marine corrosion process of microalloyed steels. Materials12, 3359 (2019). 10.3390/ma12203359 [DOI] [PMC free article] [PubMed] [Google Scholar]
- 18.Wang, L. et al. Study of application of rare earth elements in advanced low alloy steels. J. Alloy. Compd.451, 534–537 (2008). 10.1016/j.jallcom.2007.04.234 [DOI] [Google Scholar]
- 19.Zhao, Y. Y., Wang, J. F., Zhou, S. & Wang, X. D. Effects of rare earth addition on microstructure and mechanical properties of a Fe–15Mn–1.5Al–0.6C twip steel. Mater. Sci. Eng. A-Struct. Mater. Prop. Microstruct. Process.608, 106–113 (2014).
- 20.Yu, Y. C., Zhang, S. H. & Wang, S. B. Effects of cerium on the inclusions and pitting corrosion behavior of 434 ferritic stainless steel. High Temp. Mater. Process.37, 807–814 (2018). 10.1515/htmp-2017-0094 [DOI] [Google Scholar]
- 21.Jeon, S. et al. Effects of cerium on the compositional variations in and around inclusions and the initiation and propagation of pitting corrosion in hyperduplex stainless steels. Corros. Sci.75, 367–375 (2013). 10.1016/j.corsci.2013.06.020 [DOI] [Google Scholar]
- 22.Ha, H., Park, C. & Kwon, H. Effects of Misch metal on the formation of non-metallic inclusions and the associated resistance to pitting corrosion in 25% Cr duplex stainless steels. Scr. Mater.55, 991–994 (2006). 10.1016/j.scriptamat.2006.08.014 [DOI] [Google Scholar]
- 23.Liu, C. et al. Effect of inclusions modified by rare earth elements (Ce, La) on localized marine corrosion in Q460Nh weathering steel. Corros. Sci.129, 82–90 (2017). 10.1016/j.corsci.2017.10.001 [DOI] [Google Scholar]
- 24.Li, T., Qin, M., Jin, Z. L. & Ren, H. P. Effect of rare earth elements on corrosion behavior of low carbon steel in Csp. In Advanced Materials and Processes, PTS 1–3 (Guo Z.N. ed.). International Conference on Advanced Design and Manufacturing Engineering (ADME 2011). 835–840 (2011).
- 25.Mi, F. Y. et al. Industrial atmospheric corrosion resistance of P-Re weathering steel. J. Iron Steel Res. Int.18, 67–73 (2011). 10.1016/S1006-706X(11)60080-0 [DOI] [Google Scholar]
- 26.Yue, L. J., Wang, L. M. & Han, J. S. Effects of rare earth on inclusions and corrosion resistance of 10Pcure weathering steel. J. Rare Earths.28, 952–956 (2010). 10.1016/S1002-0721(09)60219-2 [DOI] [Google Scholar]
- 27.Xia, F. et al. Exploring the influence of Cu addition on the microstructure and substance transformation in corrosion product layer of X80 steel. Mater. Character.207, 113589 (2024). 10.1016/j.matchar.2023.113589 [DOI] [Google Scholar]
- 28.Wu, W., Dai, Z. Y., Liu, Z. Y., Liu, C. & Li, X. G. Synergy of Cu and Sb to enhance the resistance of 3%Ni weathering steel to marine atmospheric corrosion. Corros. Sci.183, 109353 (2021).
- 29.Li, S. W. et al. Research progress of corrosion induced by second-phase particles in microalloyed high-strength rebars—Review. Metals12, 925 (2022). 10.3390/met12060925 [DOI] [Google Scholar]
- 30.Liu, Z. et al. Effects of rare earth elements on corrosion behaviors of low-carbon steels and weathering steels. Mater. Corros.71, 258–266 (2020). 10.1002/maco.201911150 [DOI] [Google Scholar]
- 31.Zhao, Y. G. et al. Clarify the effect of reversed austenite on the pitting corrosion resistance of super 13Cr martensitic stainless steel. Corros. Sci.213, 110992 (2023). 10.1016/j.corsci.2023.110992 [DOI] [Google Scholar]
- 32.Porcayo-Calderon, J. et al. Sustainable development of palm oil: Synthesis and electro-chemical performance of corrosion inhibitors. J. Electrochem. Sci. Technol.8, 133–145 (2017). 10.33961/JECST.2017.8.2.133 [DOI] [Google Scholar]
- 33.Hirschorn, B. et al. Constant-phase-element behavior caused by resistivity distributions in films II. Applications. J. Electrochem. Soc.157, C458–C463 (2010). 10.1149/1.3499565 [DOI] [Google Scholar]
- 34.Córdoba-Torres, P. et al. On the intrinsic coupling between constant-phase element parameters Α and Q in electrochemical impedance spectroscopy. Electrochim. Acta.72, 172–178 (2012). 10.1016/j.electacta.2012.04.020 [DOI] [Google Scholar]
- 35.Hirschorn, B. et al. Determination of effective capacitance and film thickness from constant-phase-element parameters. Electrochim. Acta.55, 6218–6227 (2010). 10.1016/j.electacta.2009.10.065 [DOI] [Google Scholar]
- 36.Orazem, M. E. et al. Dielectric properties of materials showing constant-phase-element (Cpe) impedance response. J. Electrochem. Soc.160, C215–C225 (2013). 10.1149/2.033306jes [DOI] [Google Scholar]
- 37.Hsu, C. H. & Mansfeld, F. Technical note: Concerning the conversion of the constant phase element parameter Y0 into a capacitance. Corrosion.57, 747–748 (2001). 10.5006/1.3280607 [DOI] [Google Scholar]
- 38.McCafferty, E. Validation of corrosion rates measured by the Tafel extrapolation method. Corros. Sci.47, 3202–3215 (2005). 10.1016/j.corsci.2005.05.046 [DOI] [Google Scholar]
- 39.Ruifeng, D. et al. The influence of rare earth elements lanthanum on corrosion resistance of steel plate for offshore platform. Mater. Res. Exp.8, 96526 (2021). 10.1088/2053-1591/ac2343 [DOI] [Google Scholar]
- 40.Hu, G., Zhu, C., Xu, D., Dong, P. & Chen, K. Effect of cerium on microstructure, mechanical properties and corrosion properties of Al–Zn–Mg alloy. J. Rare Earths.39, 208–216 (2021). 10.1016/j.jre.2020.07.010 [DOI] [Google Scholar]
- 41.Li, Z. et al. Synergy of ball-milling and pre-oxidation on microstructure and corrosion resistance of hot-dip zinc coating of nodular cast iron. J. Mater. Res. Technol.16, 1402–1412 (2022). 10.1016/j.jmrt.2021.12.052 [DOI] [Google Scholar]
- 42.Mousavi, S. A., Hashemi, S. H., Ashrafi, A., Shoja Razavi, R. & Ghazi Mirsaeed, S. M. Characterization and corrosion behavior of Al–Co–rare earth (Ce–La) amorphous alloy. J. Rare Earths41, 771–779 (2023).
- 43.Jia, J. H., Cheng, X. Q., Yang, X. J., Li, X. G. & Li, W. A study for corrosion behavior of a new-type weathering steel used in harsh marine environment. Constr. Build. Mater.259, 119760 (2020). 10.1016/j.conbuildmat.2020.119760 [DOI] [Google Scholar]
- 44.Li, C. et al. Exploring the influence of flue gas impurities on the electrochemical corrosion mechanism of X80 steel in a supercritical Co2-saturated aqueous environment. Corros. Sci.211, 110899 (2023). 10.1016/j.corsci.2022.110899 [DOI] [Google Scholar]
- 45.Brewer, L. The thermodynamic properties of the oxides and their vaporization processes. Chem. Rev.52, 1–75 (1953). 10.1021/cr60161a001 [DOI] [Google Scholar]
- 46.Sharma, S., Mukri, B. D. & Hegde, M. S. Direct evidence of redox interaction between metal ion and support oxide in Ce0.98Pd0.02O2−Δ by a combined electrochemical and Xps study. Dalton Trans.40, 11480 (2011). [DOI] [PubMed]
- 47.Zhang, T. et al. Effects of Cu on the corrosion resistance of heat-treated weathering steel in a marine environment. Mater. Today Phys.36, 101160 (2023). 10.1016/j.mtphys.2023.101160 [DOI] [Google Scholar]
Associated Data
This section collects any data citations, data availability statements, or supplementary materials included in this article.
Data Availability Statement
The datasets generated and/or analyzed during the current study are available from the corresponding author on reasonable request.