Abstract
Slow and deep breathing (SDB) is a relaxation technique that can increase vagal activity. Respiratory sinus arrhythmia (RSA) serves as an index of vagal function usually quantified by the high-frequency power of heart rate variability (HRV). However, the low breathing rate during SDB results in deviations when estimating RSA by HRV. Besides, the impact of the inspiration-expiration (I: E) ratio and guidelines ways (fixed breathing rate or intelligent guidance) on SDB is not yet clear. In our study, 30 healthy people (mean age = 26.5 years, 17 females) participated in three SDB modes, including 6 breaths per minute (bpm) with an I:E ratio of 1:1/ 1:2, and intelligent guidance mode (I:E ratio of 1:2 with guiding to gradually lower breathing rate to 6 bpm). Parameters derived from HRV, multimodal coupling analysis (MMCA), Poincaré plot, and detrended fluctuation analysis were introduced to examine the effects of SDB exercises. Besides, multiple machine learning methods were applied to classify breathing patterns (spontaneous breathing vs. SDB) after feature selection by max-relevance and min-redundancy. All vagal-activity markers, especially MMCA-derived RSA, statistically increased during SDB. Among all SDB modes, breathing at 6 bpm with a 1:1 I:E ratio activated the vagal function the most statistically, while the intelligent guidance mode had more indicators that still significantly increased after training, including SDRR and MMCA-derived RSA, etc. About the classification of breathing patterns, the Naive Bayes classifier has the highest accuracy (92.2%) with input features including LFn, CPercent, pNN50,
 , SDRatio,
 , and LF. Our study proposed a system that can be applied to medical devices for automatic SDB identification and real-time feedback on the training effect. We demonstrated that breathing at 6 bpm with an I:E ratio of 1:1 performed best during the training phase, while intelligent guidance mode had a more long-lasting effect.
Keywords: Slow deep breathing, heart rate variability (HRV), inspiration-expiration ratio, multimodal coupling analysis (MMCA), detrended fluctuation analysis (DFA)
I. Introduction
Slow and deep breathing (SDB), as a non-pharmacological technique, has been widely used in adjunctive therapy and biofeedback training programs [1], [2], [3], [4]. Spontaneous breathing in adults usually ranges from 12 to 20 breaths per minute (bpm), while SDB is normally carried out in paced breathing of around 6 bpm [5]. Studies reported that the underlying mechanism of SDB is to enhance cardiac vagal activity by stimulating respiratory sinus arrhythmia (RSA) and the baroreflex [2], [4], [6]. Therefore, monitoring changes in vagal activity during SDB training in real-time supports assessing the effectiveness of such breathing exercises.
The most widely used method to quantify cardiac autonomic function is heart rate variability (HRV) [7]. Previous studies reported that the high-frequency (HF, 0.15-0.4 Hz) band power of R-R interval signals reflects the function of the cardiac vagal or parasympathetic nervous system (PNS), while the low-frequency (LF, 0.04-0.15 Hz) band power is affected by both cardiac sympathetic nervous system (SNS) and PNS activity [7], [8], [9]. However, the unavoidable fact that the breathing rate of SDB (around 0.1 Hz) lies in the LF band but not the HF band, results in a confusing physiological interpretation of the observed HRV parameters, e.g., if the LF-band power increases, does it reflect SDB practicing or SNS function per se [6]. Nevertheless, Kromenacker et al. showed that in practicing SDB (4-9 bpm), LF-band power was greatly reduced by parasympathetic blockade while sympathetic blockade had no significant effect [10], manifesting LF prone to reflect vagal activity during SDB [11]. Another widely used vagal-function indicator is the root mean square of successive differences (RMSSD). One recent study showed that RMSSD is a biased estimator that preferentially weights high-frequency components, thus underestimating vagal activity during SDB [12].
RSA refers to the phenomenon that heart rate fluctuates with the respiratory cycle, i.e., heart rate increases in inspiration and reduces in expiration [13]. RSA is caused by the action of central respiratory neurons on vagal motor neurons and a decrease in respiratory rate leads to an increase in RSA [14]. As a widely-used marker of PNS function, RSA is usually quantified by HF of HRV, which is unfitted if the breathing rate is outside the range. Many alternative RSA quantification methods have been proposed to address issues related to respiratory rate, including redefining the HF band [15] and entropy quantifications [16], [17], [18]. However, these methods all use the entire signals which cannot eliminate the interferences of transient perturbations. Multimodal coupling analysis (MMCA) method, based on the Hilbert-Huang transform, is a newly proposed RSA quantification method [19]. It applies ensemble empirical mode decomposition (EEMD) to adaptively decompose an R-R interval signal into several intrinsic mode functions (IMFs), and then the RSA-related IMF can be picked out in accordance with the instantaneous frequency of the respiratory signal. The coupling between different electrophysiological signals reflects nonlinear interactions between different physiological systems [20], [21]. MMCA calculated the phase synchronization between the selected RSA-related IMF and the respiratory signal, which is another form of cardiopulmonary coupling, to exclude periods of low interactions between the cardiac and respiratory systems. In this research, we applied MMCA to assess the activation of RSA during breathing training.
The impact of the inspiration-expiration ratio (I:E ratio) on SDB is not yet clear. De Couck et al. investigated the effects of symmetric breathing pattern (inhalation equals to exhalation) and skewed breathing pattern (exhalation longer than inhalation) on SDB in HRV, they found that the HRV indices (LF, RMSSD, and standard deviation of the R-R intervals (SDRR)) of both patterns increased, but there was no significant difference between the two breathing modes [22]. Strauss-Blasche et al. demonstrated that when breathing at around 10 bpm, the amplitude of RSA during inhalation shorter than exhalation was higher than that of inhalation longer than exhalation [23]. However, these studies did not control the respiratory rate of different breathing patterns to be consistent. Lin et al. compared the effects of four breathing modes (breathing rate of 6/5.5 bpm with I:E ratios of 5:5/4:6) on HRV parameters and revealed that the vagal activations and baroreflex function increased the most at the mode of 5.5 bpm with 5:5 I:E ratio among all breathing modes [11].
Baroreflex is a reflex that responds to changes in blood pressure by adjusting heart rate. When blood pressure rises and baroreceptors in the carotid artery and aorta are activated, cardiac vague nerves are then stimulated and produce a reflex decrease in heart rate to lower the blood pressure [24]. Due to the inertia of blood in the vascular system, baroreflex takes approximately five seconds to induce the corresponding changes in blood pressure, and thus the heart rate fluctuates at the resonance frequency (between 0.075 and 0.12 Hz) [25]. Therefore, breathing at resonance frequency (around 0.1 Hz) can increase baroreflex and further enhance cardiac vagal activity. The resonance frequency of baroreflex is associated with the blood volume. Hence, the taller and more muscular people, the lower the resonance frequency [25]. In addition to the empirical value of 0.1Hz, an individual biofeedback estimation method was proposed to reduce the respiratory rate until the lowest heart rate at expiration [26]. However, whether breathing at one’s most comfortable respiratory rate around 6 bpm can better match the resonance frequency has not been demonstrated.
The classification of breathing patterns is also an interesting issue, especially for smart devices that need to monitor the beginning and the end of SDB exercises. Machine-learning classifiers and decoders now widely used in clinical and electrophysiology studies [27]. In this paper, different machine learning classifiers are used to classify SDB breathing (parameters during paced SDB of all modes) and spontaneous breathing (parameters during baseline stage). To improve the accuracy and efficiency of the machine-learning classifier, we applied the max-relevance and min-redundancy (mRMR) method for feature selection. mRMR applies mutual information technology to compute feature weights which are equal to the contribution of features to the classification results [28]. Feature with high weight also means that it is less redundant.
In this research, three breathing modes were designed to examine the impact of I:E ratio and guidance modes (fixed or intelligent guidance) on SDB, including 6 bpm with two I:E ratios (1:1 and 1:2), and an intelligent guidance mode (I:E ratio is 1:2, and instructed participants to reduce their breathing rate to 6 bpm according to their ability). Parameters derived from MMCA, linear and nonlinear HRV analyses (including Poincaré plot and detrended fluctuation analysis) were applied to evaluate the performance of participants during different breathing exercises. Moreover, we applied mRMR and multiple machine learning classifiers to find the best way for breathing pattern classification. We developed a novel system to evaluate the effects of different SDB training modes and classify breathing patterns.
II. Materials and Methods
A. Subjects
In this work, 30 healthy participants aged 22–35 years were recruited from the General Hospital of the People’s Liberation Army, including 17 females and 13 males. None of them had cardiovascular disease, severe mental disease, or neurological disorders, nor did they take any drugs that affect the function of ANS. All participants were asked not to smoke, or consume alcohol, or coffee 24 hours before the study. The demographic data and baseline parameters are presented in Table 1.
TABLE 1. Basic Information of Participants (N = 30).
| Baseline demographic data | |
|---|---|
| Age (years) | 26.5 (3.3) |
| Gender (F/M) | 17/13 |
| BMI (kg/m2) | 21.2 (3.4) |
| Heart rate (beats/min) | 75.4 (8.6) |
| Respiratory rate (breaths/min) | 13.0 (3.1) |
| Baseline indices | |
| SDRR (ms) | 47.4 (16.3) |
| RMSSD (ms) | 30.1 (12.0) |
| pNN50 (%) | 9.3 (10.4) |
| VLF (ms2) | 940.1 (700.8) |
| LF (ms2) | 988.9 (1377.6) |
| HF (ms2) | 474.4 (448.1) |
| Tpower (ms2) | 2523.1 (2028.1) |
| LFn (a.u.) | 0.582 (0.206) |
| HFn (a.u.) | 0.332 (0.178) |
| LF/HF (a.u.) | 3.600 (5.036) |
| SD1 (a.u.) | 21.3 (8.4) |
| SD2 (a.u.) | 63.4 (22.0) |
| SDRatio (a.u.) | 0.339 (0.089) |
 (a.u.) (a.u.) |
1.259 (0.272) |
 (a.u.) (a.u.) |
0.850 (0.203) |
| CPercent (%) | 43.9 (26.6) |
| RSA (ms2) | 459.6 (654.1) |
Data were presented as mean (standard deviation). The baseline indices were calculated by the baseline stage of three slow deep breathing modes.
B. Experiment
The SDB experiment began with wearing a multi-sensor smart vest and taking a short rest until breathing stabilized. The vest was used to detect ECG and respiration signals. One SDB experiment included three phases:
-
(1)
Baseline (Pre, 5 min): participants sat comfortably in a quiet room and breathed in their normal rhythm;
-
(2)
Paced breathing (Dur, 11 min): the guided animations were displayed on the monitor. Participants were instructed to inhale as the gas in the animated lung increased, and exhale when the gas discharged. Three SDB modes were designed in this phase:
Mode 1: breathed at 6 bpm with the I:E ratio was 1:1;
Mode 2: breathed at 6 bpm with the I:E ratio was 1:2;
Mode 3: intelligent guidance mode, instructed participants to reduce their breathing rate to 6 bpm as much as possible according to their ability and willingness with the I:E ratio was 1:2. Participants adjusted their breathing rhythm by following the animation generated by the Breathing Pattern Optimization APP;
-
(3)
Recovery (Post, 5 min): participants sat comfortably in the quiet room and breathed in their normal rhythm;
The subjects participated in three SDB modes in random order according to their registration for the study. The whole experiment was up to about 63 min ((baseline 5 min + SDB exercise 11 min + recovery 5 min) * 3).
C. Measurements and Data Preprocessing
Medical-grade wearable monitoring device, SensEcho (Beijing SensEcho Science & Technology Co., Ltd.) [29] was used to monitor the participants’ physiological signals, including ECG, respiratory signals, triaxial acceleration monitoring, and SpO2 signals, etc. The single-lead ECG signals were obtained by three fabric electrode patches embedded in the vest. Respiratory signals were obtained by Respiratory Inductive Plethysmography using elastic straps. The ECGs and respiratory signals were digitized at 200 Hz and 25 Hz respectively.
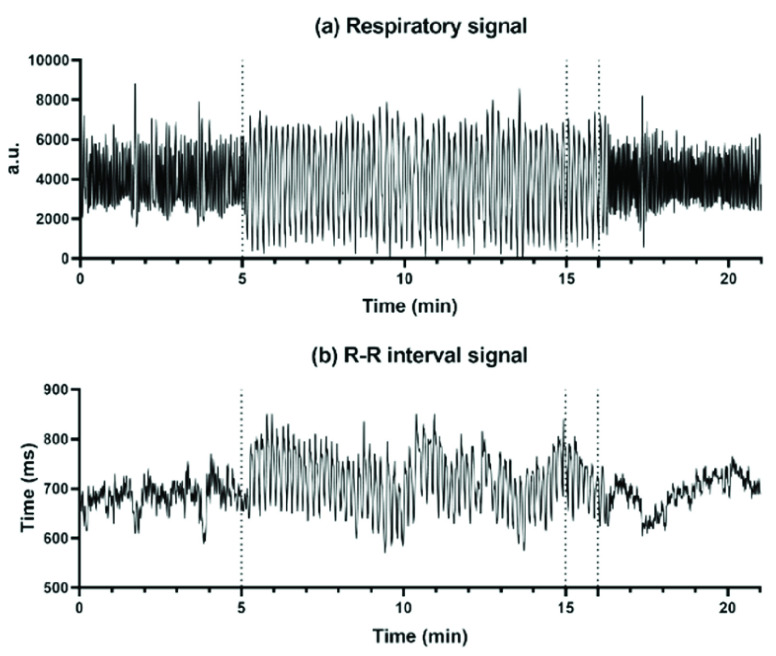
Firstly, we applied a 0.5-30 Hz bandpass filter to the ECG signals, followed by a Savitzky-Golay filter for smoothing [30]. The Pan-Tompkins algorithm was used to detect the occurrences of R peaks in each record [31]. To eliminate improper detections or missed detections, we then conducted a visual inspection of the QRS wave complex corresponding to the detected R peaks. R-R intervals were calculated as per the differences between adjacent R peaks. A representative example of respiratory signal and R-R interval throughout one SDB experiment is shown in Fig. 1. R-R intervals were cubic interpolated at 8 Hz to satisfy the Nyquist theorem, and the respiratory signals were down-sampled to 8 Hz.
FIGURE 1.
(a) The respiratory signal and (b) R-R interval signal throughout one SDB exercise, including the 5-min baseline stage, 11-min paced breathing stage (I:E ratio = 1:2; breathing rate = 6 bpm), and 5-min recovery stage.
The baseline stage (5 min) and recovery stage (5 min) were split as we described in the Experiment section. The first 10 minutes of the 11-minute paced breathing stage were selected for analysis.
D. Methods and Classifiers
1). Traditional HRV Analysis
Traditional HRV time-domain and frequency-domain parameters were calculated in this manuscript [7]. Time-domain HRV parameters including the mean of R-R interval (MeanRR), the standard deviation of R-R interval (SDRR), the square root of the mean squared differences of successive R-R signal (RMSSD), and the proportion of differences between adjacent R-R intervals greater than 50ms (pNN50). For frequency-domain HRV parameters, we applied fast Fourier transformation to compute the power of R-R intervals in very low frequency (VLF, 0.0033-0.04 Hz) band, low frequency (LF, 0.04-0.15 Hz) band, high frequency (HF, 0.15-0.40 Hz) band and the total power (Tpower, 0-0.4 Hz). We also calculated the normalized low frequency (LFn, LF/(Tpower-VLF)), normalized high frequency ((HFn, HF/(Tpower-VLF))) and the ratio of LF and HF (LF/HF).
RMSSD, pNN50, LFn, and LF were used as markers of the PNS function during SDB in this research. SDRR and Tpower reflect the overall HRV. Although the physiological significance of the other parameters during SDB is not clear, they were also calculated for follow-up classification of SDB phases. LF/HF was used to observe changes in cardiac autonomic balance in different breathing patterns.
2). Poincaré Plot
Non-linear HRV analysis Poincaré plot was applied in this study. The Poincaré plot was obtained by plotting the values of
 against the values of
 , which can be fitted by an ellipse. SD1 and SD2 represent the standard deviations of the points along the semi-short axis and the semi-long axis of the fitted ellipse respectively. In this work, SD1, SD2, and SD1/SD2 (SDRatio) were obtained based on the standard deviation of the successive differences of the RR intervals (SDSD) and SDRR [32]:
 |
where SD1 indicates PNS activity and SD2 reflects the overall level of HRV.
3). Detrended Fluctuation Analysis (DFA)
DFA utilizes fractal dynamics to characterize the long-term correlations of nonstationary time series [33]. The DFA algorithm firstly integrates the R-R interval time series x(i), and gets
 :
:
 |
where
 is the average of the R-R interval time series. Then divide
 into non-overlapping segments of equal length n, and a least square linear regression is fitted to each segment, denoted as
 . The average fluctuation of the detrended time series is defined as:
 |
After repeating the process for all time scales, i.e., segment length, a log-log plot of fluctuations (
 against time scales (n) can be obtained. The fitting slope of the DFA curve is the scaling exponent
 , which represents the power-law correlation. When
 <0.5, there exists power-law anti-correlations. If
 <1, there is a long-range power-law correlation. And when
 is equal to 0.5, the series is uncorrelated white noise. We will get a 1/f noise, when
 = 1, and a Brownian noise, when
 = 1.5 [34].
The bi-fractal phenomenon has been found in R-R interval analysis, which means the DFA curve has two fitting slopes for short-time scales and long-time scales respectively [8]. In this manuscript, scaling exponents of
 were used to measure the strength of the short-term (4-9 beats) correlation and
 for the long-term scales (>10 beats).
4). Multimodal Coupling Analysis (MMCA)
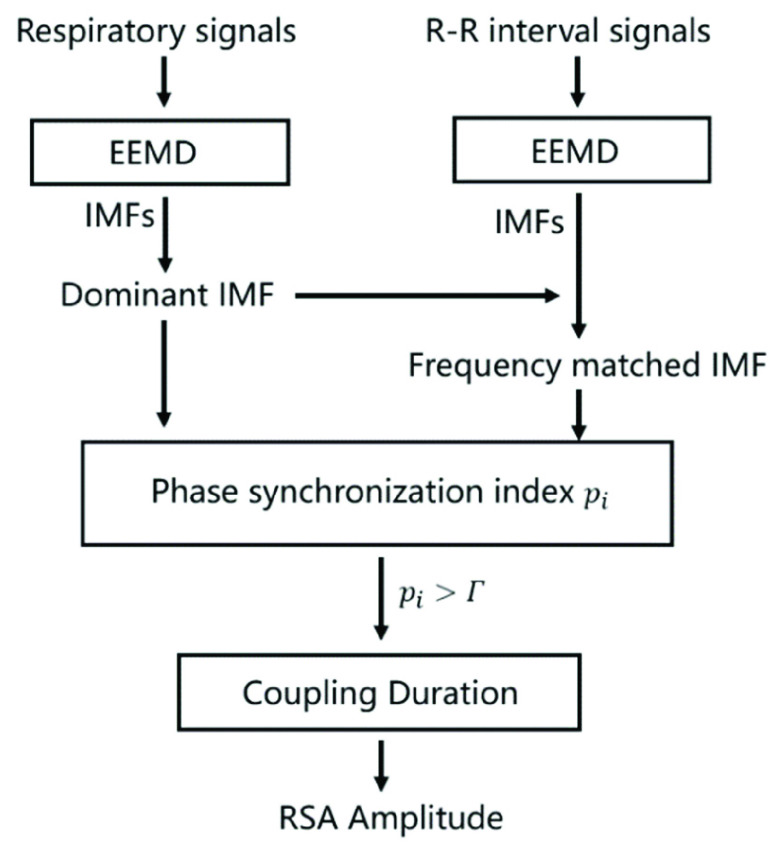
MMCA is a novel method of calculating the amplitude of RSA and measuring the interactions between the cardiac and respiratory systems [19]. The detailed algorithm of MMCA is as follows (Fig. 2):
FIGURE 2.
The scheme of MMCA for the assessment of cardiorespiratory dynamics.
EEMD was firstly applied to decompose the R-R interval and its synchronous respiratory signal into several IMFs respectively. For IMFs of respiratory signal, the one with the greatest power is chosen as the Dominant IMF, which enables the elimination of nonstationary interferences from body movement, coughing, or swallowing.
Then the Hilbert-Huang transform (HHT) was applied to compute the instantaneous frequencies and phases of the IMFs of the R-R interval and the Dominant IMF of respiratory signal:
 |
where P is the Cauchy principal value,
 and z(t) are the corresponding Hilbert transform and the analytic signal of the IMFs, which is represented as
 in equations. A(t) and
 are the instantaneous amplitude and phase of
 respectively. The instantaneous frequency is obtained by differentiating the instantaneous phase. Afterwards, the RSA-related IMF (i.e., Frequency matched IMF) of R-R signal which shares the minimum mean difference of instantaneous frequency from the Dominant IMF is selected, which is the portion of heart rate fluctuations that are only regulated by respiration.
The normalized phase synchronization index
 between the Dominant IMF and the Matched IMF is then calculated by a sliding window, which reflects the strength of cardiorespiratory synchronization:
 |
where
 is the difference between the instantaneous phases of the Dominant IMF and the Frequency matched IMF. Considering the length of signals and computation time, the length of window T was set as
 in this work and moved forward
 at a time.
Finally, the instantaneous amplitude of RSA can be quantified by calculating the power of the Matched IMF. According to previous research, the threshold of
 was set as 0.8, which can eliminate 98% of the false-positive error rate for cardiopulmonary synchronization [19]. Then, the non or random-coupling epochs (i.e.,
 is less than the threshold) can be excluded, and only the average of the RSA within strongly synchronized epochs is calculated:
 |
The amplitude of RSA and the proportion of strongly coupled segment (CPercent, the length of time that
 divided by the total length of time) of each SDB stage were calculated in this work, where RSA reflects the PNS function and CPercent reflects the strength of cardiorespiratory interaction [35].
5). Feature Selection and Classification
Identifying the most characterizing features of the observed data is critical to minimize the classification error. However, the combination of multiple good features does not necessarily lead to good classification performance because of redundant information among features.
In this work, we used max-relevance and min-redundancy (mRMR) for feature selection [36]. The max-relevance criterion is implemented by computing the mean value of all mutual information values between feature and class. The idea of the min-redundancy is that the classification results do not change very much when one of the redundant features is removed. Based on the weights of features calculated by mRMR, top n features were selected as the input to classifiers to examine by which parameters can classify the breathing patterns effectively and accurately [28].
The machine-learning classifiers used in this work include Decision Tree (DT), k-nearest Neighbor (kNN), Logistic Regression (LR), Naive Bayes (NB), and Random Forest (RF). Accuracy was used to evaluate the effectiveness of these classification methods.
E. Statistical Analysis
The normal distribution was tested by the Shapiro-Wilk test. To explore whether there were significant differences between the baseline stage and the paced breathing stage, as well as between the baseline stage and the recovery stage, paired Student’s t test or Mann-Whitney U test was applied to these comparisons. Comparison of parameters during each stage (baseline stage, paced breathing stage, and recovery stage) under three SDB modes was performed by Mixed model test. Results were considered statistically significant if the p-values were less than 0.05. *, **, and *** correspond to p-values less than 0.05, 0.01, and 0.001, respectively.
III. Result
A. Comparison of Parameters During SDB
Comparisons of parameters during the baseline stage among all SDB modes showed no statistical difference, which means the baseline state has no effect on the SDB training. The comparison of parameters for SDB of mode 2 (breathed at 6 bpm with the I:E ratio was 1:2) participants including baseline vs paced breathing and baseline vs recovery stage are summarized in Table 2, which showed the most significant and representative trends among all SDB modes. The results of SDB of mode 1 and mode 3 are also presented in Table 3 (Appendix) and Table 4 (Appendix) respectively. Parameters derived from time-domain HRV, frequency-domain HRV, Poincaré plot, DFA, and MMCA measures were used for monitoring vagal activity during SDB training, where RMSSD, pNN50, SD1, and MMCA-derived RSA are considered to be able to reflect PNS function regardless of respiratory rate. For spontaneous breathing, HF and HFn are recognized to be markers of vagal function while LF and LFn are affected by both PNS and SNS function. For slow deep breathing, LF and LFn are more appropriate PNS markers. Parameters including SDRR, Tpower, and SD2 can reflect the overall level of HRV. CPercent is the reflection of the strength of cardiopulmonary interaction.
TABLE 2. The Mean and Standard Deviation of Time-Domain HRV, Frequency-Domain HRV, Poincaré Plot, DFA, and MMCA Measures at Different Stages of Breathing Exercise (I: E = 1:2; Breathing Rate = 6 bpm).
| Stage | p-Value | ||||
|---|---|---|---|---|---|
| Pre | Dur | Post | Pre vs Dur | Pre vs Post | |
| Time Domain | |||||
| MeanRR | 802.8(93.44) | 800.9(72.7) | 797.8(76.3) | ||
| SDRR | 45.1(11.1) | 68.8(50.2) | 50.1(18.6) | *** | |
| RMSSD | 29.4(9.9) | 37.8(14.3) | 29.6(14.1) | *** | |
| pNN50 | 9.2(9.9) | 14.0(10.2) | 10.1(11.7) | *** | |
| Frequency domain | |||||
| VLF | 827.3(481.2) | 1127.9(762.0) | 1145.9(1091.9) | * | |
| LF | 798.7(629.3) | 3574.8(2484.1) | 1141.7(1156.3) | *** | |
| HF | 437.6(359.9) | 404.5(337.8) | 456.7(483.4) | ||
| Tpower | 2157.4(1046.5) | 5154.6(3250.9) | 2859.0(2278.2) | *** | * |
| LFn | 0.575(0.208) | 0.895(0.084) | 0.636(0.201) | *** | * |
| HFn | 0.343(0.177) | 0.101(0.040) | 0.302(0.183) | *** | |
| LF/HF | 3.495(5.446) | 10.626(4.907) | 4.741(6.033) | *** | |
| Poincaré plot | |||||
| SD1 | 20.8(7.0) | 26.8(10.1) | 21.0(10.0) | *** | |
| SD2 | 14.7(2.7) | 93.4(27.9) | 67.5(25.1) | *** | * |
| SDRatio | 0.347(0.082) | 0.282(0.043) | 0.313(0.092) | *** | * |
| DFA | |||||
 |
1.243(0.290) | 1.644(0.099) | 1.336(0.276) | *** | * |
 |
0.837(0.208) | 0.564(0.129) | 0.871(0.194) | *** | |
| MMCA parameters | |||||
| CPercent | 50.1(26.9) | 61.8(23.7) | 46.5(25.3) | ||
| RSA | 361.6(327.6) | 1335.3(247.7) | 534.2(651.1) | *** | |
TABLE 3. The Mean and Standard Deviation of Time-Domain HRV, Frequency-Domain HRV, Poincaré Plot, DFA, and MMCA Measures at Different Stages of Breathing Exercise (I: E = 1:1; Breathing Rate = 6 bpm).
| Stage | p-Value | ||||
|---|---|---|---|---|---|
| Pre | Dur | Post | Dur vs Pre | Post vs Pre | |
| Time Domain | |||||
| MeanRR | 803.8(86.1) | 802.5(79.0) | 803.0(84.5) | ||
| SDRR | 50.1(21.6) | 72.7(23.4) | 54.5(21.2) | *** | |
| RMSSD | 30.4(13.7) | 39.3(15.0) | 30.1(12.9) | *** | |
| pNN50 | 10.0(11.6) | 16.2(12.3) | 9.7(9.6) | ** | |
| Frequency domain | |||||
| VLF | 1039.3(887.2) | 1056.0(713.5) | 1584.8(1484.5) | ||
| LF | 1326.2(2199.4) | 4388.4(3237.4) | 1218.7(1451.8) | *** | |
| HF | 498.7(549.9) | 337.4(239.6) | 448.9(455.2) | ||
| Tpower | 2967.7(2929.5) | 5826.9(3660.0) | 3414.4(2680.6) | *** | |
| LFn | 0.598(0.214) | 0.916(0.053) | 0.640(0.186) | *** | |
| HFn | 0.327(0.182) | 0.078(0.033) | 0.277(0.171) | *** | |
| LF/HF | 3.890(5.547) | 15.233(9.581) | 5.311(7.465) | *** | |
| Poincaré plot | |||||
| SD1 | 21.5(9.7) | 27.8(10.6) | 21.3(9.1) | *** | |
| SD2 | 67.3(29.4) | 99.0(31.6) | 73.8(29.3) | *** | *** |
| SDRatio | 0.327(0.082) | 0.276(0.035) | 0.300(0.092) | ** | * |
| DFA | |||||
 |
1.293(0.275) | 1.672(0.079) | 1.381(0.222) | *** | |
 |
0.826(0.226) | 0.516(0.147) | 0.867(0.216) | *** | |
| MMCA parameters | |||||
| CPercent | 37.3(25.6) | 63.3(23.3) | 33.6(24.2) | *** | |
| RSA | 601.8(1055.3) | 1464.0(1440.3) | 549.0(729.3) | * | |
TABLE 4. The Mean and Standard Deviation of Time-Domain HRV, Frequency-Domain HRV, Poincaré Plot, DFA, and MMCA Measures at Different Stages of Breathing Exercise (I: E = 1:2; Breathing Rate was Guided as Slowly as Possible).
| Stage | p-Value | ||||
|---|---|---|---|---|---|
| Pre | Dur | Post | Dur Vs Pre | Post Vs Pre | |
| Time Domain | |||||
| MeanRR | 804.0(92.5) | 803.2(80.9) | 807.0(94.3) | ||
| SDRR | 46.1(13.1) | 65.0(18.9) | 53.8(17.5) | *** | *** |
| RMSSD | 29.9(11.6) | 36.5(13.7) | 28.4(11.7) | *** | |
| pNN50 | 10.4(9.5) | 15.0(10.7) | 8.1(9.6) | *** | * |
| Frequency domain | |||||
| VLF | 909.2(581.1) | 1084.2(722.5) | 1528.8(1389.5) | ** | |
| LF | 792.7(602.8) | 3050.0(2067.3) | 1232.1(990.8) | *** | ** |
| HF | 461.2(406.9) | 374.7(286.0) | 353.5(361.1) | * | |
| Tpower | 1362.2(248.7) | 4578.8(2494.7) | 3202.6(2105.7) | *** | *** |
| LFn | 0.576(0.201) | 0.892(0.131) | 0.709(0.161) | *** | *** |
| HFn | 0.329(0.179) | 0.115(0.055) | 0.238(0.145) | *** | ** |
| LF/HF | 3.397(4.159) | 9.581(4.508) | 5.296(5.414) | *** | ** |
| Poincaré plot | |||||
| SD1 | 21.1(8.2) | 25.8(9.7) | 20.1(8.3) | *** | |
| SD2 | 61.4(17.5) | 88.2(25.2) | 73.3(23.9) | *** | *** |
| SDRatio | 0.346(0.104) | 0.288(0.046) | 0.277(0.073) | ** | *** |
| DFA | |||||
 |
1.241(0.258) | 1.621(0.093) | 1.440(0.191) | *** | *** |
 |
0.888(0.172) | 0.602(0.152) | 0.887(0.198) | *** | |
| MMCA parameters | |||||
| CPercent | 43.2(26.4) | 54.3(24.4) | 34.3(27.7) | * | |
| RSA | 364.1(294.6) | 1234.3(1129.2) | 564.3(493.8) | *** | ** |
B. Changes in PNS Activity at Different Stages
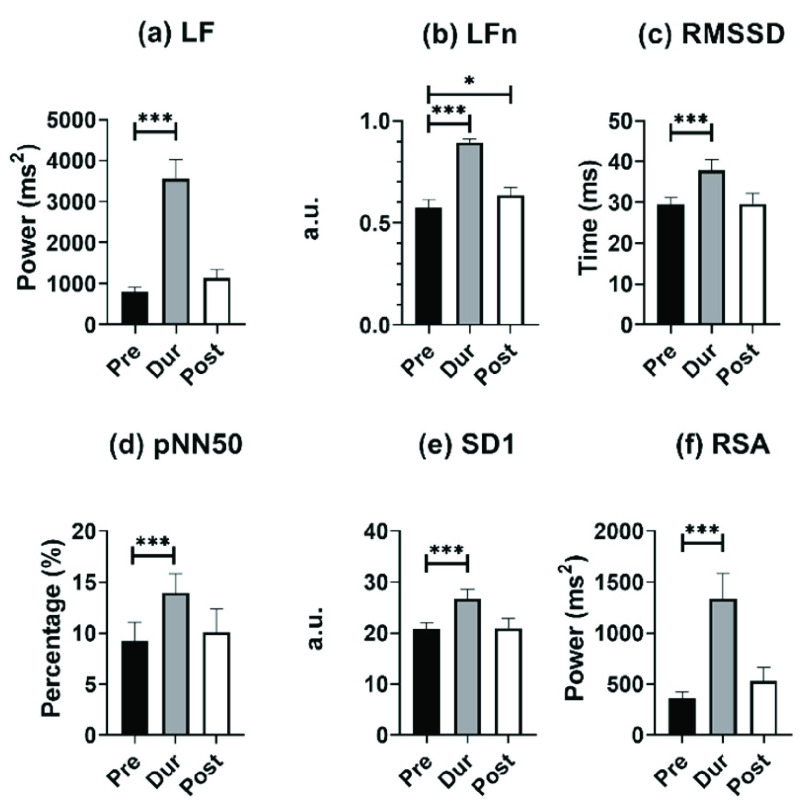
For monitoring PNS activity, LF, LFn, RMSSD, pNN50, SD1, and RSA are the appropriate markers for individuals undergoing SDB exercises. The comparison results of the above parameters at different stages of mode 2 are shown in Fig. 3.
FIGURE 3.
Results of (a) LF, (b) LFn, (c) RMSSD, (d) pNN50, (e) SD1, and (f) MMCA-derived RSA for individuals undergoing slow deep breathing excises at different stages (I: E = 1:2; breathing rate = 6 bpm). *, **, *** correspond to
 , 0.01, and 0.001, respectively.
From Fig. 3, all PNS functional markers significantly increased during SDB (
 ) compared to the baseline stage. The value of LF (increased by 551%) and MMCA-derived RSA (increased by 509%) showed the most significant increases, with LF increasing from 798.7 ± 629.3 to 3574.8 ± 2484.1, and MMCA-derived RSA increasing from 361.6 ± 327.6 to 1335.3 ± 247.7. RMSSD showed the slowest growth (30.3%) during SDB exercise among other PNS functional markers, increasing from 29.4 ± 9.9 to 37.8 ± 14.3. The PNS functional markers during the other two SDB modes had the same results and were also significantly higher than the baseline stage results.
As for PNS functional markers at the recovery stage and baseline stage, only LFn of mode 2 at the recovery stage was significantly higher than that of the baseline stage (0.636 ± 0.201 vs. 0.575 ± 0.208). In SDB of mode 3, the values of LF, LFn, and MMCA-derived RSA at the recovery stage were significantly higher than those in the baseline stage, but pNN50 showed opposite changes and was statistically lower than the baseline stage (8.1 ± 9.6 vs.10.4 ± 9.5,
 ). However, mode 1 did not exhibit the same results. All PNS functional markers at the recovery stage in mode 1 did not show significant differences compared to the baseline stage.
C. Changes in Other Parameters at Different Stages
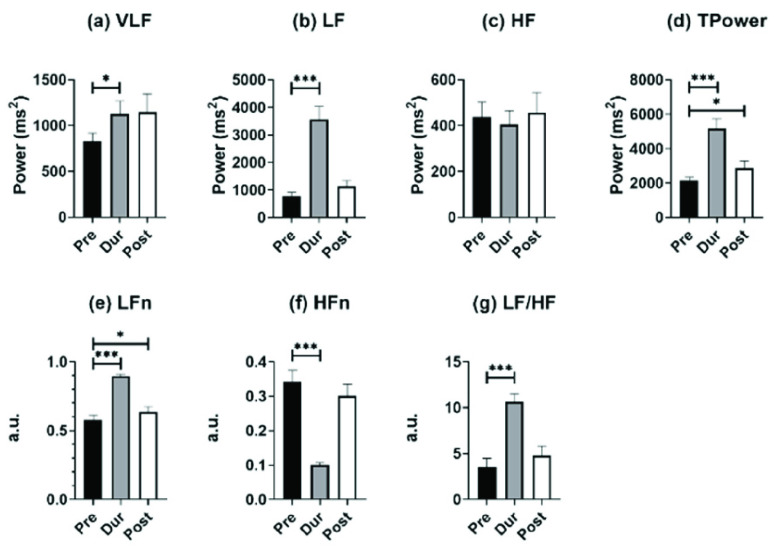
Fig. 4 depicts frequency-domain HRV parameters for individuals undergoing SDB training in mode 2 at different stages. For comparisons between baseline and paced breathing stage, Tpower and LF/HF increased significantly (Fig. 4(d) and Fig. 4(g)), and the other two SDB modes shared the same results. This significant increase was mainly caused by changes in LF (Fig. 4(b)), as HF did not show statistically significant differences between all stages (Fig. 4(c)) whatever SDB modes were. As for the results of VLF, it only showed a slight statistical increase in mode 2 SDB between baseline and paced breathing stage (1127.9 ± 762.0 vs. 827.3 ± 481.2). The HFn significantly decreased during the breathing stage compared to the baseline stage of all three SDB modes, which were opposite to the changes in LFn.
FIGURE 4.
Results of frequency-domain HRV parameters for individuals undergoing slow deep breathing exercises at different stages (I:E = 1:2; breathing rate = 6 bpm). *, **, *** represent
 , 0.01, and 0.001, respectively.
For the comparison of the baseline stage and recovery stage, all the frequency-domain HRV parameters did not show statistical differences for mode 1. However, compared to the baseline stage, the LFn and Tpower in the mode 2 recovery stage significantly increased, due to the recovery of participants’ autonomous breathing and residual PNS function return to the HF band. In mode 3, almost all the frequency-domain HRV parameters showed a significant increase in the recovery stage compared to the baseline stage except for HF (461.2 ± 406.9 vs. 353.5 ± 361.1) and HFn (0.329 ± 0.179 vs. 0.238 ± 0.145) statistically decreased. The reason for this phenomenon might be that mode 3 had a more lasting impact on participants, so the PNS function during the recovery stage was still represented by the LF band (1231.2 ± 990.8 vs. 792.7 ± 602.8) instead of the HF band. Compared to the baseline stage, the LF/HF in mode 3 accordingly increased significantly.
For time-domain HRV parameters, MeanRR at the paced breathing stage and recovery stage did not show a statistical difference compared to the baseline stage in three SDB modes (Table 2, Table 3, and Table 4). Apart from this, SDRR showed a significant increase at the paced breathing stage compared to the baseline stage for all modes (Table 2, Table 3, and Table 4), and in mode 3, SDRR was also significantly higher at the recovery stage than at baseline stage (Table 4).
In the results of the Poincaré plot, SD2 increased significantly at the paced breathing stage and recovery stage of all SDB modes compared to the baseline stage. The changes in SD2 were in accordance with TPower which reflected the overall level of HRV. SDRatio is a sign of autonomic nervous balance and is positively correlated with PNS function. However, in all SDB modes, the value of SDRatio at the paced breathing stage and recovery stage was statistically lower than the baseline stage, which should increase during SDB training according to our assumptions. This phenomenon might be caused by the underestimation of the PNS activity of SD1 during the paced breathing stage, as both LF and MMCA derived RSA at the paced breathing stage increased by over 500% compared to the baseline stage in mode 2, while SD1 only increased by 30.4% (Fig. 3).
In the results of DFA,
 , as an indicator for short-range correlation, significantly increased during the paced breathing stage compared to the baseline stage in all modes (p <0.001 for all modes). Besides,
 at the recovery stage of mode 2 and mode 3 was also statistically higher than that of the baseline stage, noting that such a trend was not retained under mode 1. On the other side,
 is an indicator of long-range correlation. We found that
 significantly decreased to around 0.5 at the paced breathing stage compared to the baseline stage in all modes (p <0.001 for all modes), implying that the fluctuations of R-R intervals resemble that of the white noise. Therefore, during the paced breathing stage, the R-R intervals shifted from pure tones (
 ) to Brownian noise (
 ) at small scales, and changed from the pattern of long-range power-law correlations (
 ) toward uncorrelated white noise (
 ) at large scales.
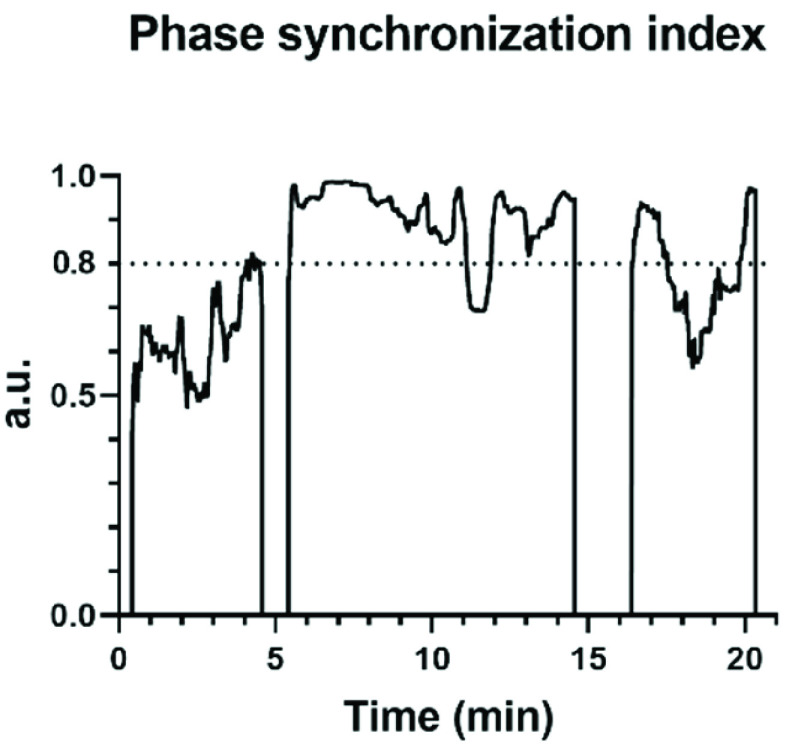
The dynamic changes of phase synchronization index calculated by MMCA during once SDB of mode 2 was shown in Fig. 5. During the paced breathing stage and recovery stage, the value of the phase synchronization index and the proportion of strongly coupled segment (CPercent) all increased compared to the baseline stage. Breathing exercises significantly enhanced the interactions between the cardiac and respiratory systems and this phenomenon lasted for a while after breathing training. CPercent during paced SDB of mode 1 and mode 3 was also significantly higher than that of the baseline stage, which means all SDB modes improved cardiopulmonary interaction to a certain extent.
FIGURE 5.
The phase synchronization index between R-R interval and respiratory signal obtained by MMCA during once slow deep breathing (I:E = 1:2; breathing rate = 6 bpm). The periods with a phase synchronization index greater than 0.8 are strongly coupled.
D. Comparisons Among All Modes
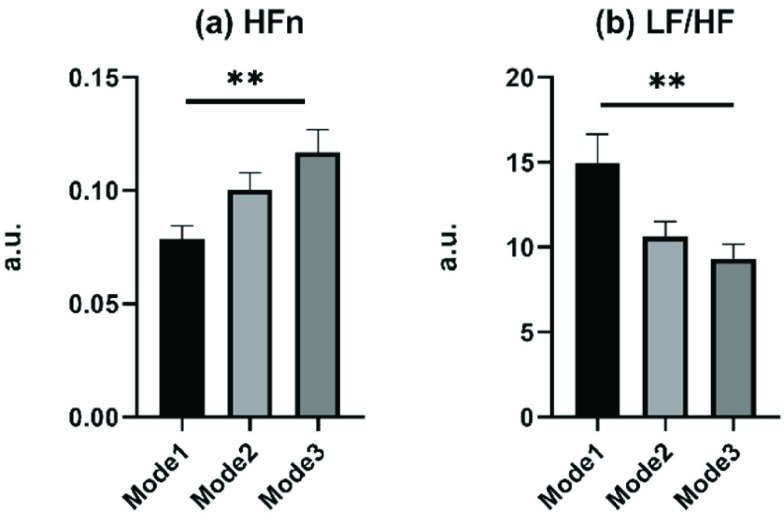
The parameters of all modes at the paced breathing stage and recovery stage were compared afterward. As no statistical difference during the recovery stage among all modes, the comparison results of the paced breathing stage were presented in Fig. 6. Only two frequency-domain HRV parameters, HFn and LF/HF, showed statistical differences among SDB modes at the paced breathing stage. And in SDB of mode 1, the HFn showed the smallest value and LF/HF showed the biggest value, which indicated that in SDB of mode 1, the LF occupied a large proportion of the sum of LF and HF.
FIGURE 6.
Comparison of parameters among different modes of slow deep breathing exercise, including mode 1 (I: E = 1:1; breathing rate = 6 bpm), mode 2 (I: E = 1:2; breathing rate = 6 bpm), and mode 3 (I: E = 1:2; breathing rate was guided as slowly as possible). Only parameters presenting statistical differences are displayed. ** corresponds to
 .
.
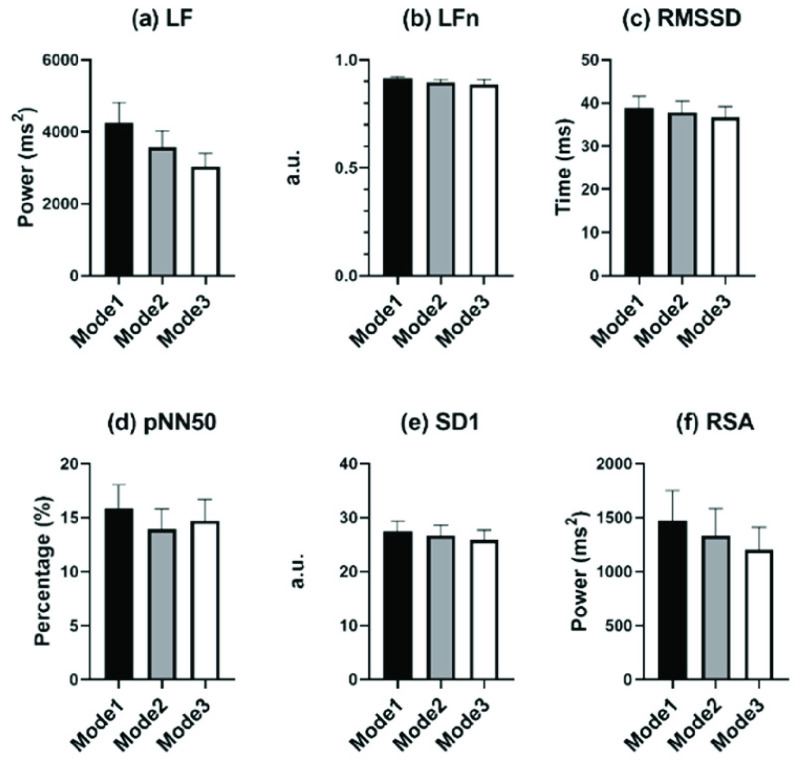
Fig. 7 shows the comparisons of PNS-function markers among all SDB modes. Though no parameters presented statistical differences, all PNS-function markers of mode 1 showed the biggest mean value among all SDB modes. And the difference among the three SDB modes displayed by LF and RSA was the most pronounced.
FIGURE 7.
Comparisons of PNS function markers among different modes of slow deep breathing, including (a) LF, (b) LFn, (c) RMSSD, (d) pNN50, (e) SD1, and (f) MMCA-derived RSA. No parameters showed statistical differences.
As for the comparison of the number of parameters between the baseline and recovery stage of all modes, mode 3 had the most indicators with the statistical difference (Table 2, Table 3, and Table 4). All frequency-domain HRV parameters (except for HF), SDRR, SD2, SDRatio,
 , and MMCA-derived RSA at the recovery stage of mode 3 were statistically different from the baseline stage, which had the same trend as paced breathing vs baseline stage. This result indicated that the SDB of mode 3 might have a longer-lasting impact compared to other breathing-training modes.
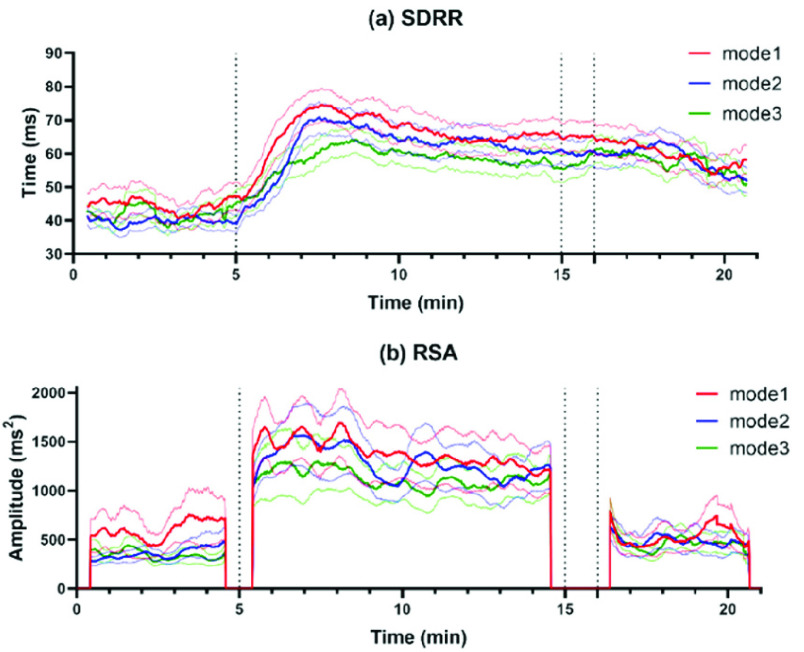
As for the dynamic changes in SDRR and MMCA-derived RSA of all participants throughout the whole SDB exercises, the dynamic fluctuation was presented in Fig. 8. We can find that both SDRR and MMCA-derived RSA of mode 1 showed a most significant increase during the paced breathing stage, but the highest values turned to mode 3 at the recovery stage.
FIGURE 8.
The dynamic changes (mean ± standard error) in (a) SDRR and (b) MMCA-derived RSA throughout the whole SDB exercises among the three modes, including mode 1 (red line, I: E = 1:1; breathing rate = 6 bpm), mode 2 (blue line, I: E = 1:2; breathing rate = 6 bpm) and mode 3 (green line, I: E = 1:2; breathing rate was guided as slowly as possible). Compared to the baseline stage (start-5min), parameters during the paced breathing stage (5-16 min) of all modes significantly increased, but in the recovery stage (about 16 min-end), only mode 3 showed significantly increased values. All indicators are calculated by a sliding window of 50 seconds with a 1-second step size.
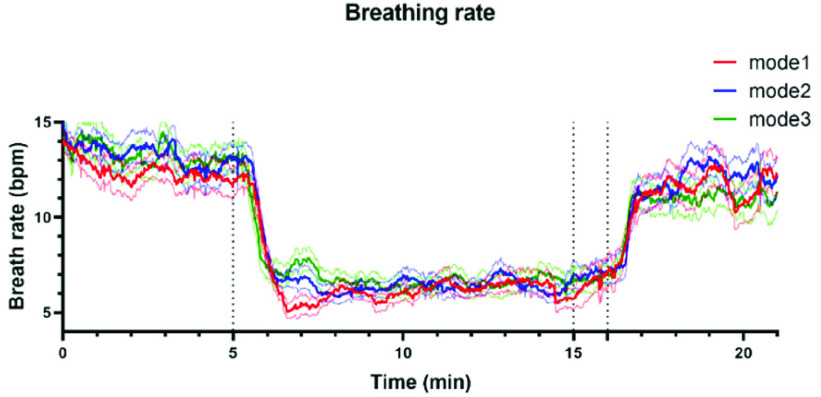
Fig. 9 shows the dynamic changes in breathing rate throughout the whole SDB exercises among the three kinds of SDB modes, we can find that the breathing rate of mode 3 turned to the lowest at the recovery stage among all SDB modes. These results all proved that mode 3 had the most long-lasting impact on participants of SDB among all three modes.
FIGURE 9.
The dynamic changes (mean ± standard error) of breathing rate throughout the whole SDB exercises among the three modes of slow deep breathing, including mode 1 (red line, I: E = 1:1; breathing rate = 6 bpm), mode 2 (blue line, I: E = 1:2; breathing rate = 6 bpm) and mode 3 (green line, I: E = 1:2; breathing rate was guided as slowly as possible).
E. Feature Selection and Classification
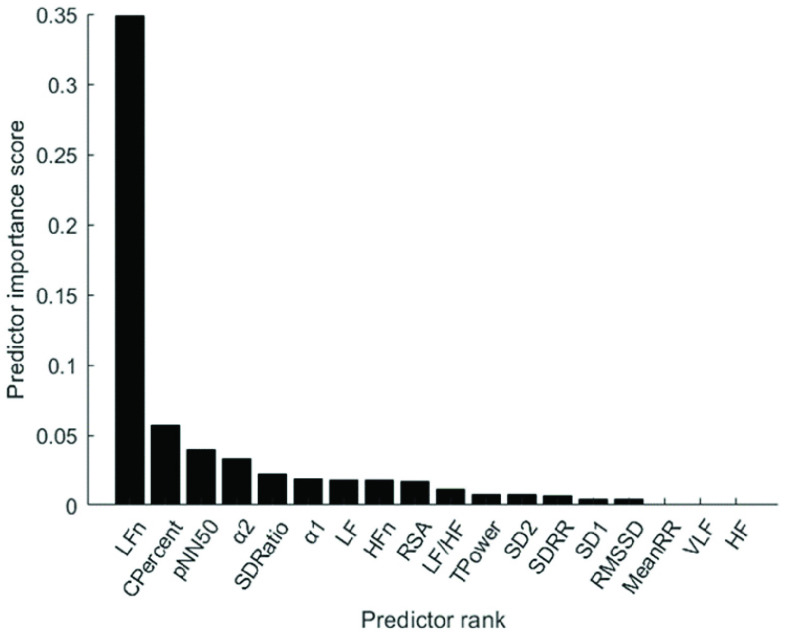
Fig. 10 depicts the predictor rank of parameters between baseline and paced breathing stage calculated by mRMR. From Fig. 10, LFn has the highest weight among all features which means it is the most effective feature in classifying breathing patterns. Besides, features derived from MMCA (CPercent, RSA) and DFA (
 ,
,
 ) showed a higher overall performance compared to the traditional HRV parameters and Poincaré plot.
FIGURE 10.
The importance of features in the detection of breathing exercises, calculated by max-relevance and min-redundancy (mRMA) feature selection method.
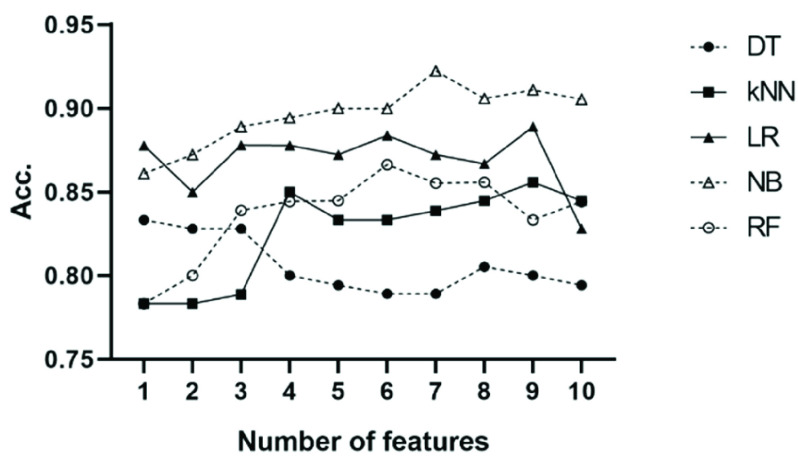
According to the importance of all parameters in the detection of breathing exercises, the top n (from 1 to 10) features were selected as the input of classifiers. Based on 10-fold Cross-Validation, the accuracy of each classifier was calculated on the baseline stage and the paced-breathing stage of all the three SDB modes, and the average accuracy was summarized in Fig. 11. Among all classifiers, Random Forest is the slowest with prediction speed of 680 observations per second (obs./sec). The prediction speed of Logistic Regression and k-nearest Neighbor is around 4000 obs./sec while Decision Tree and Naive Bayes are beyond 6000 obs./sec.
FIGURE 11.
The mean accuracy of the five tested classifiers using top n features selected by mRMR to classify spontaneous breathing and slow-deep breathing from the three datasets. The datasets used for classification consist of the baseline stage and paced-breathing stage of three SDB modes. DT: Decision Tree; kNN: k-Nearest Neighbor; LR: Logistic Regression; NB: Naive Bayes; RF: Random Forest.
Fig. 11 shows that the Naive Bayes was the most effective and accurate classifier, and the classification accuracy can reach 89.4% with only four features (LFn, CPercent, pNN50, and
 ). When using the first seven features as input, the Naive Bayes achieved the highest accuracy (92.2%) among all classifiers. The performance of the Decision Tree is the worst with its accuracy fluctuating around 80% when features other than LFn, CPercent, and pNN50 were introduced. When using the first four features as input, k-Nearest Neighbor achieved its second-highest accuracy (85%), while when inputting the first three features, Random Forest achieved stable accuracy. The accuracy of Logistic Regression is stable regardless of the number of features.
IV. Discussion
The major findings of this study included: (1) Compared with autonomous breathing pattern, all modes of slow deep breathing can significantly increase PNS function; (2) Statistically, the SDB mode of 6 bpm with 1:1 I:E ratio is the most effective way of activating PNS function among all three modes in this study; (3) The intelligent-guided SDB mode (I:E ratio of 1:2, guiding participants to lower their breathing rate to 6 bpm based on their ability and willingness) has the most lasting impact on participants; (4) Naive Bayes with input features including LFn, CPercent, pNN50,
 , SDRatio,
 , and LF is an effective and accurate way for classifying breathing patterns, with an accuracy rate of 92.2%. units for each quantity in an equation.
A. The Changes of PNS Function Between Baseline and Paced Breathing Stage
Slow deep breathing is a low-cost and efficient way to improve autonomic nervous system function by elevating PNS activities [37]. In this work, the parameters reflecting PNS function and the overall HRV level during the paced breathing stage are all higher than that of the baseline stage regardless of the SDB modes.
Affected by the influence of breathing rate, the frequency-domain HRV parameters have different physiological meanings. Especially, LF effects by both PNS and SNS activity during autonomous breathing while it turns to a marker of PNS function during slow deep breathing [10]. The results showed that the LF (3574.8 ± 2484.1) during slow deep breathing (mode 2) was several times higher than the baseline stage LF (798.7 ± 629.3) or HF (437.6 ± 359.9). The significant differences in other frequency-domain HRV parameters (LFn, HFn, TPower, LF/HF) were all caused by changes in LF, as there is almost no change in HF or VLF. These findings demonstrate a significant improvement in PNS activity during SDB compared to spontaneous respiration, rather than simply shifting the frequency band. Chaitanya et al. also demonstrated that LF (1587.6 to 2546.16,
 ), rather than HF (
 ), measures PNS function when breathing in the range of 4.5-7 bpm [38]. Breathing at 6 bpm is expected to stimulate respiratory sinus arrhythmia (RSA) and baroreflex [6], thereby regulating the sinus node and ultimately leading to a significant increase in LF. However, we cannot tell the extent of RSA growth precisely by LF because it has different physiological interpretations during slow deep breathing, and spontaneous breathing.
Besides, PNS-functional markers including RMSSD and SD1 all underestimated changes in PNS activity in our research [12]. Ali et al. reported that RMSSD did not show significant changes throughout SDB (6 bpm) in healthy individuals and patients with functional bowel disorders [39]. Therefore, MMCA-derived RSA is the most reliable PNS-functional marker, without taking into account respiratory rate. Furthermore, MMCA can provide us with the dynamic changes in PNS activity (Fig. 8) by calculating the variance of the respiratory-related IMF of R-R signals [19]. The way MMCA calculates RSA meets the needs of medical devices to observe the real-time effect during breathing exercises. The improvement in overall HRV levels (TPower, SD2) and cardiopulmonary interaction (CPercent) also validated the beneficial effects of breathing training on participants’ cardiopulmonary coupling [40].
B. Comparison of Three SDB Modes
Among the three SDB modes, mode 1 (breathing at 6 bpm with an I:E ratio of 1:1) had the highest LF/HF value and the lowest HFn value during the paced SDB stage, indicating the highest LF value or PNS activity during mode 1. Although no statistical difference was shown, the mean of all PNS-functional markers was the highest during the paced breathing stage in mode 1. All these results demonstrate that breathing with an I:E ratio of 5:5 is statistically the most effective in activating the PNS function [11]. Some studies have found that individuals breathing in skewed patterns (exhalation longer than inhalation) exhibit better behavior or no differences compared to symmetrical patterns (exhalation equals inhalation) [22], [41]. The lack of strict breathing rate control and insufficient comparable parameters (HFn, LF/HF) in the above research might be the reasons for drawing different conclusions.
The intelligent guidance mode is the most comfortable SDB pattern, in which the participants were guided to lower their breathing rate to 6 bpm as much as possible according to their ability and willingness with the I:E ratio was 1:2. In the comparison between recovery stage and baseline stage among SDB modes, the intelligent guidance mode has the most statistically significant indicators, which have the same trend as paced breathing stage compared to baseline stage (except for pNN50). This result indicates that the intelligent guidance mode may have a more lasting impact on participants. In the study of resonance frequency, Steffen et al. showed breathing at the resonance frequency (around 6 bpm) had a higher value of LF/HF after SDB than at other respiratory frequencies [42]. In our research, LF/HF in intelligent guidance mode had the same trend (3.397 to 5.296) after SDB, which infers intelligent guidance mode may better align with resonance frequency. The LF of the other two SDB modes showed no difference between the recovery stage and the baseline stage, as the respiratory pattern returned to autonomous respiration and the PNS activity biomarker reverted to HF (the average breathing rate at recovery stage of mode 1 and mode 2 were 11.1 and 11.5, respectively). However, due to the influence of inertia, individuals who engage in intelligent guided breathing exercises still maintain slow deep breathing for a while(the average breathing rate at the recovery stage of the intelligent guidance mode was 10.6).
C. Feature Selection and Breathing-Pattern Classification
The importance of features obtained by the feature selection method mRMR indicates that LFn contributes the most to respiratory pattern detection (Fig. 10). Besides, parameters derived from MMCA and DFA have higher overall performance. During SDB,
 increased to around 1.5 (Brownian noise) may indicate an increase in the baroreflex sensitivity of participants, with their R-R intervals approaching sine-waves [43].
 of DFA has been demonstrated to have a high correlation with normalized VLF band (VLF/(VLF+LF)) [44]. Considering SNS function mainly acts on the VLF band during SDB [10], the decrease of
 indicates that the ANS function conversed to a PNS-dominant type. The enhancement of synchronization between R-R interval and respiratory signal is also a typical feature of SDB (Fig. 8) [45]. The physiological explanations infer that MMCA and DFA as crucial indicators for respiratory-pattern classification.
The Naive Bayes classifier has the highest accuracy (92.2%) in classifying breathing patterns with the input features including LFn, CPercent, pNN50,
 , SDRatio,
 , and LF (Fig. 11). This finding can be applied to the design and improvement of reliable wearable devices for home-based healthcare services. Based on these key parameters (LFn, CPercent, pNN50,
 , SDRatio,
 , and LF), clinicians can formulate more professional and individualized SDB training programs for patients, and monitor the effectiveness of changes in breathing patterns in SDB training.
D. Clinical Translation
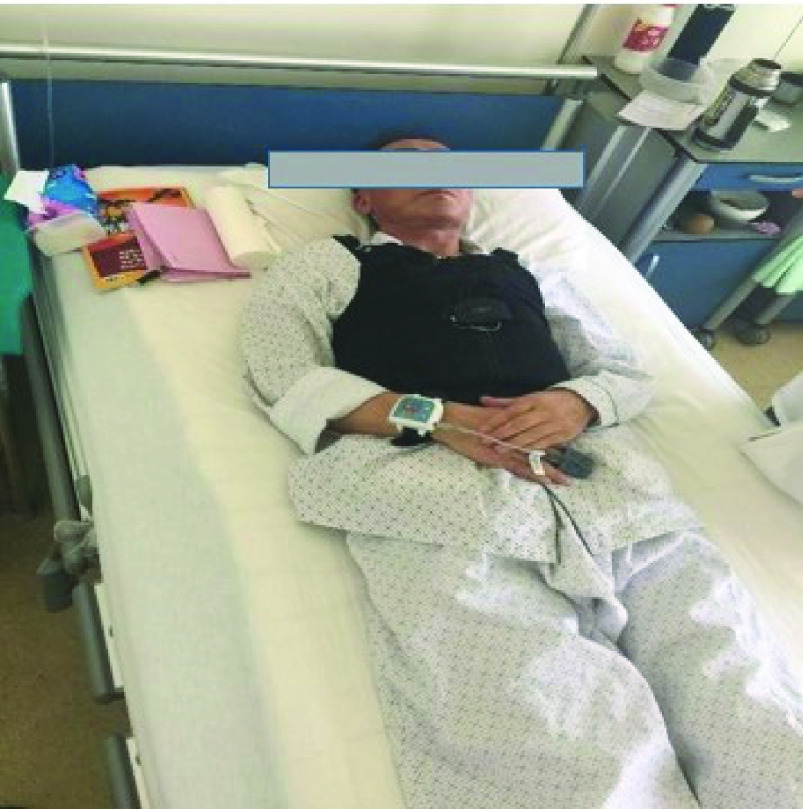
Our study proposed an automatic monitoring and evaluation system for breathing training. As per the physiological signals accessed by the multi-sensor smart vest and electrophysiological analyses (MMCA, linear and non-linear HRV analyses), each individual can obtain the most accurate means (classifier with specific input features) for SDB detection. The SDB performed by each individual throughout the day can be automatically recognized and then evaluated by the methods described above, especially MMCA. Subjects can improve their breathing exercise based on the assessment results. Our system is effective for all groups and has been used in the rehabilitation of patients with respiratory diseases (Fig. 12).
FIGURE 12.
Patient with respiratory disease wore a multi-sensor smart vest.
E. Limitation
The purpose of this study is to reveal the impact of SDB modalities on ANS function and explore which SDB patterns are the best. We found that the SDB mode of breathing at 6 bpm with I:E ratio of 1:1 was the most effective way to activate the PNS function statistically. This conclusion is drawn through analyzing SDB data from healthy young individuals.
However, age has significant impact on one’s autonomic regulation of cardiopulmonary coupling [46]. Therefore, the applicability of our findings on optimal SDB modes in older adults remains to be studied.
Besides, the impact of SDB modes on patients with cardiovascular diseases such as chronic obstructive pulmonary disease, hypertension, and heart failure still needs to be further verified. Cardiopulmonary diseases cause significant individual changes, and choosing 0.1 Hz as a fixed baroreflex-resonance frequency is not appropriate. The intelligent guidance SDB mode may have better effects on activating the PNS function of patients with cardiovascular or respiratory diseases.
V. Conclusion
In this study, we designed a system for recognizing each breathing training and evaluating the effects. MMCA method, nonlinear methods, and traditional linear HRV analysis were applied to examine the impact of three SDB modes on PNS activity. We found that breathing at 6 bpm with I:E ratio of 1:1 was the most effective way to activate the PNS function statistically while intelligent guidance SDB mode had more lasting effects. Additionally, Naive Bayes with input features including LFn, CPercent, pNN50,
 , SDRatio,
 , and LF was demonstrated to have the best performance for breathing-pattern classification which may be helpful for the development of relevant devices.
Supplementary Materials
Appendix
Funding Statement
This work was supported in part by the National Natural Science Foundation of China under Grant 62171028, Grant 62001026, and Grant 62171471; in part by Beijing Natural Science Foundation under Grant L232139; in part by the Open Project of Key Laboratory of Medical Electronics and Digital Health of Zhejiang Province under Grant MEDH202204 and Grant MEDC202303; and in part by the High-Level Fellow Research Fund Program under Grant 3050012222022.
Contributor Information
Wenbin Shi, Email: shiwb@bit.edu.cn.
Zhengbo Zhang, Email: zhengbozhang301@gmail.com.
Chien-Hung Yeh, Email: chien-hung.yeh@bit.edu.cn.
References
- [1].Santino T. A., Chaves G. S., Freitas D. A., Fregonezi G. A., and Mendonca K. M., “Breathing exercises for adults with asthma,” Cochrane Database Systematic Rev., vol. 3, no. 3, Mar. 2020, Art. no. CD001277. [DOI] [PMC free article] [PubMed] [Google Scholar]
- [2].Jafari H., et al. , “Can slow deep breathing reduce pain? An experimental study exploring mechanisms,” J. Pain, vol. 21, nos. 9–10, pp. 1018–1030, Sep./Oct. 2020. [DOI] [PubMed] [Google Scholar]
- [3].Lee J.-N., Whang M.-C., and Kang B.-G., “Process design for optimized respiration identification based on heart rate variability for efficient respiratory sinus arrhythmia biofeedback,” Int. J. Environ. Res. Public Health, vol. 19, no. 4, p. 2087, Feb. 2022. [DOI] [PMC free article] [PubMed] [Google Scholar]
- [4].Lehrer P., et al. , “Heart rate variability biofeedback improves emotional and physical health and performance: A systematic review and meta analysis,” Appl. Psychophysiol. Biofeedback, vol. 45, no. 3, pp. 109–129, Sep. 2020. [DOI] [PubMed] [Google Scholar]
- [5].Laborde S., et al. , “Effects of voluntary slow breathing on heart rate and heart rate variability: A systematic review and a meta-analysis,” Neurosci. Biobehav. Rev., vol. 138, Jul. 2022, Art. no. 104711. [DOI] [PubMed] [Google Scholar]
- [6].Sevoz-Couche C. and Laborde S., “Heart rate variability and slow-paced breathing: When coherence meets resonance,” Neurosci. Biobehav. Rev., vol. 135, Apr. 2022, Art. no. 104576. [DOI] [PubMed] [Google Scholar]
- [7].Electrophysiology Task Force of the European Society of Cardiology the North American Society of Pacing Electrophysiology, “Heart rate variability,” Circulation, vol. 93, no. 5, pp. 1043–1065, 1996. [PubMed] [Google Scholar]
- [8].Yeh C.-H., et al. , “The critical role of respiratory sinus arrhythmia on temporal cardiac dynamics,” J. Appl. Physiol., vol. 127, no. 6, pp. 1733–1741, Dec. 2019. [DOI] [PubMed] [Google Scholar]
- [9].Sassi R., et al. , “Advances in heart rate variability signal analysis: Joint position statement by the e-cardiology ESC working group and the European heart rhythm association co-endorsed by the Asia Pacific heart rhythm society,” Europace, vol. 17, no. 9, pp. 1341–1353, Sep. 2015. [DOI] [PubMed] [Google Scholar]
- [10].Kromenacker B. W., Sanova A. A., Marcus F. I., Allen J. J. B., and Lane R. D., “Vagal mediation of low-frequency heart rate variability during slow yogic breathing,” Psychosomatic Med., vol. 80, no. 6, pp. 581–587, 2018. [DOI] [PubMed] [Google Scholar]
- [11].Lin I. M., Tai L. Y., and Fan S. Y., “Breathing at a rate of 5.5breaths per minute with equal inhalation-to-exhalation ratio increases heart rate variability,” Int. J. Psychophysiol., vol. 91, no. 3, pp. 206–211, Mar. 2014. [DOI] [PubMed] [Google Scholar]
- [12].Natarajan A., “Heart rate variability during mindful breathing meditation,” Frontiers Physiol., vol. 13, Jan. 2023, Art. no. 1017350. [DOI] [PMC free article] [PubMed] [Google Scholar]
- [13].Yasuma F. and Hayano J.-I., “Respiratory sinus arrhythmia: Why does the heartbeat synchronize with respiratory rhythm?,” Chest, vol. 125, no. 2, pp. 683–690, Feb. 2004. [DOI] [PubMed] [Google Scholar]
- [14].Angelone A. and Coulter N. A., “Respiratory sinus arrhythmia: A frequency dependent phenomenon,” J. Appl. Physiol., vol. 19, pp. 479–482, May 1964. [DOI] [PubMed] [Google Scholar]
- [15].Yamuza M. T. V., et al. , “Human emotion characterization by heart rate variability analysis guided by respiration,” IEEE J. Biomed. Health Informat., vol. 23, no. 6, pp. 2446–2454, Nov. 2019. [DOI] [PubMed] [Google Scholar]
- [16].Javorka M., et al. , “Respiratory sinus arrhythmia mechanisms in young obese subjects,” Frontiers Neurosci., vol. 14, p. 204, Mar. 2020. [DOI] [PMC free article] [PubMed] [Google Scholar]
- [17].Nemati S., Edwards B. A., Lee J., Pittman-Polletta B., Butler J. P., and Malhotra A., “Respiration and heart rate complexity: Effects of age and gender assessed by band-limited transfer entropy,” Respiratory Physiol. Neurobiol., vol. 189, no. 1, pp. 27–33, Oct. 2013. [DOI] [PMC free article] [PubMed] [Google Scholar]
- [18].Shi W., Feng H., Zhang X., and Yeh C.-H., “Amplitude modulation multiscale entropy characterizes complexity and brain states,” Chaos, Solitons Fractals, vol. 173, Aug. 2023, Art. no. 113646. [Google Scholar]
- [19].Lin C., et al. , “Probing age-related changes in cardio-respiratory dynamics by multimodal coupling assessment,” Chaos, vol. 30, no. 3, Mar. 2020, Art. no. 033118. [DOI] [PubMed] [Google Scholar]
- [20].Zhang C., Yeh C.-H., and Shi W., “Variational phase-amplitude coupling characterizes signatures of anterior cortex under emotional processing,” IEEE J. Biomed. Health Informat., vol. 27, no. 4, pp. 1935–1945, Apr. 2023. [DOI] [PubMed] [Google Scholar]
- [21].Yeh C.-H., Zhang C., Shi W., Lo M.-T., Tinkhauser G., and Oswal A., “Cross-frequency coupling and intelligent neuromodulation,” Cyborg Bionic Syst., vol. 4, p. 0034, Jan. 2023. [DOI] [PMC free article] [PubMed] [Google Scholar]
- [22].De Couck M., Caers R., Musch L., Fliegauf J., Giangreco A., and Gidron Y., “How breathing can help you make better decisions: Two studies on the effects of breathing patterns on heart rate variability and decision-making in business cases,” Int. J. Psychophysiol., vol. 139, pp. 1–9, May 2019. [DOI] [PubMed] [Google Scholar]
- [23].Strauss-Blasche G., Moser M., Voica M., McLeod D. R., Klammer N., and Marktl W., “Relative timing of inspiration and expiration affects respiratory sinus arrhythmia,” Clin. Exp. Pharmacol. Physiol., vol. 27, no. 8, pp. 601–606, Aug. 2000. [DOI] [PubMed] [Google Scholar]
- [24].Norcliffe-Kaufmann L., “The vagus and glossopharyngeal nerves in two autonomic disorders,” J. Clin. Neurophysiol., vol. 36, no. 6, pp. 443–451, Nov. 2019. [DOI] [PubMed] [Google Scholar]
- [25].Vaschillo E. G., Vaschillo B., and Lehrer P. M., “Characteristics of resonance in heart rate variability stimulated by biofeedback,” Appl. Psychophysiol. Biofeedback, vol. 31, no. 2, pp. 129–142, Jun. 2006. [DOI] [PubMed] [Google Scholar]
- [26].Paul L. and Evgeny V., “The future of heart rate variability biofeedback,” Biofeedback, vol. 36, no. 1, pp. 11–14, 2008. [Google Scholar]
- [27].Yeh C.-H., et al. , “Auditory cues modulate the short timescale dynamics of STN activity during stepping in Parkinson’s disease,” Brain Stimulation, vol. 17, no. 3, pp. 501–509, 2024. [DOI] [PMC free article] [PubMed] [Google Scholar]
- [28].Wang Y., Shi W., and Yeh C.-H., “A novel measure of cardiopulmonary coupling during sleep based on the synchrosqueezing transform algorithm,” IEEE J. Biomed. Health Informat., vol. 27, no. 4, pp. 1790–1800, Apr. 2023. [DOI] [PubMed] [Google Scholar]
- [29].Xu H., et al. , “Construction and application of a medical-grade wireless monitoring system for physiological signals at general wards,” J. Med. Syst., vol. 44, no. 10, p. 182, Sep. 2020. [DOI] [PMC free article] [PubMed] [Google Scholar]
- [30].Varon C., Caicedo A., Testelmans D., Buyse B., and Van Huffel S., “A novel algorithm for the automatic detection of sleep apnea from single-lead ECG,” IEEE Trans. Biomed. Eng., vol. 62, no. 9, pp. 2269–2278, Sep. 2015. [DOI] [PubMed] [Google Scholar]
- [31].Pan J. and Tompkins W. J., “A real-time QRS detection algorithm,” IEEE Trans. Biomed. Eng., vol. BME-32, no. 3, pp. 230–236, Mar. 1985. [DOI] [PubMed] [Google Scholar]
- [32].Brennan M., Palaniswami M., and Kamen P., “Do existing measures of Poincare plot geometry reflect nonlinear features of heart rate variability?,” IEEE Trans. Biomed. Eng., vol. 48, no. 11, pp. 1342–1347, Nov. 2001. [DOI] [PubMed] [Google Scholar]
- [33].Peng C.-K., Havlin S., Stanley H. E., and Goldberger A. L., “Quantification of scaling exponents and crossover phenomena in nonstationary heartbeat time series,” Chaos: Interdiscipl. J. Nonlinear Sci., vol. 5, no. 1, pp. 82–87, Mar. 1995. [DOI] [PubMed] [Google Scholar]
- [34].Ma Y., Shi W., Peng C.-K., and Yang A. C., “Nonlinear dynamical analysis of sleep electroencephalography using fractal and entropy approaches,” Sleep Med. Rev., vol. 37, pp. 85–93, Feb. 2018. [DOI] [PubMed] [Google Scholar]
- [35].Ma D., et al. , “Multimodal coupling and HRV assessment characterize autonomic functional changes in congestive heart failure patients with sinus rhythm or severe arrhythmia,” Biomed. Signal Process. Control, vol. 89, Mar. 2024, Art. no. 105764. [Google Scholar]
- [36].Peng H., Long F., and Ding C., “Feature selection based on mutual information criteria of max-dependency, max-relevance, and min-redundancy,” IEEE Trans. Pattern Anal. Mach. Intell., vol. 27, no. 8, pp. 1226–1238, Aug. 2005. [DOI] [PubMed] [Google Scholar]
- [37].Jerath R., Edry J. W., Barnes V. A., and Jerath V., “Physiology of long pranayamic breathing: Neural respiratory elements may provide a mechanism that explains how slow deep breathing shifts the autonomic nervous system,” Med. Hypotheses, vol. 67, no. 3, pp. 566–571, 2006. [DOI] [PubMed] [Google Scholar]
- [38].Chaitanya S., Datta A., Bhandari B., and Sharma V. K., “Effect of resonance breathing on heart rate variability and cognitive functions in young adults: A randomised controlled study,” Cureus, vol. 14, no. 2, Feb. 2022, Art. no. e22187. [DOI] [PMC free article] [PubMed] [Google Scholar]
- [39].Ali M. K., et al. , “Root mean square of successive differences is not a valid measure of parasympathetic reactivity during slow deep breathing,” Amer. J. Physiol.-Regulatory, Integrative Comparative Physiol., vol. 324, no. 4, pp. R446–R456, Apr. 2023. [DOI] [PubMed] [Google Scholar]
- [40].Dick T. E., Mims J. R., Hsieh Y.-H., Morris K. F., and Wehrwein E. A., “Increased cardio-respiratory coupling evoked by slow deep breathing can persist in normal humans,” Respiratory Physiol. Neurobiol., vol. 204, pp. 99–111, Dec. 2014. [DOI] [PMC free article] [PubMed] [Google Scholar]
- [41].Wang Y.-P., Kuo T. B. J., Lai C.-T., Chu J.-W., and Yang C. C. H., “Effects of respiratory time ratio on heart rate variability and spontaneous baroreflex sensitivity,” J. Appl. Physiol., vol. 115, no. 11, pp. 1648–1655, Dec. 2013. [DOI] [PubMed] [Google Scholar]
- [42].Steffen P. R., Austin T., DeBarros A., and Brown T., “The impact of resonance frequency breathing on measures of heart rate variability, blood pressure, and mood,” Frontiers Public Health, vol. 5, p. 222, Aug. 2017. [DOI] [PMC free article] [PubMed] [Google Scholar]
- [43].Francis D. P., et al. , “Physiological basis of fractal complexity properties of heart rate variability in man,” J. Physiol., vol. 542, no. Pt 2, pp. 619–629, Jul. 2002. [DOI] [PMC free article] [PubMed] [Google Scholar]
- [44].Weippert M., Behrens K., Rieger A., Kumar M., and Behrens M., “Effects of breathing patterns and light exercise on linear and nonlinear heart rate variability,” Appl. Physiol., Nutrition, Metabolism, vol. 40, no. 8, pp. 762–768, Aug. 2015. [DOI] [PubMed] [Google Scholar]
- [45].Noble D. J. and Hochman S., “Hypothesis: Pulmonary afferent activity patterns during slow, deep breathing contribute to the neural induction of physiological relaxation,” Frontiers Physiol., vol. 10, p. 1176, Sep. 2019. [DOI] [PMC free article] [PubMed] [Google Scholar]
- [46].Li J., Zhang X., Shi W., and Yeh C. H., “A novel dynamic cardiorespiratory coupling quantification method reveals the effect of aging on the autonomic nervous system,” Chaos: Interdiscipl. J. Nonlinear Sci., vol. 33, no. 12, Dec. 2023, Art. no. 123106. [DOI] [PubMed] [Google Scholar]
Associated Data
This section collects any data citations, data availability statements, or supplementary materials included in this article.


