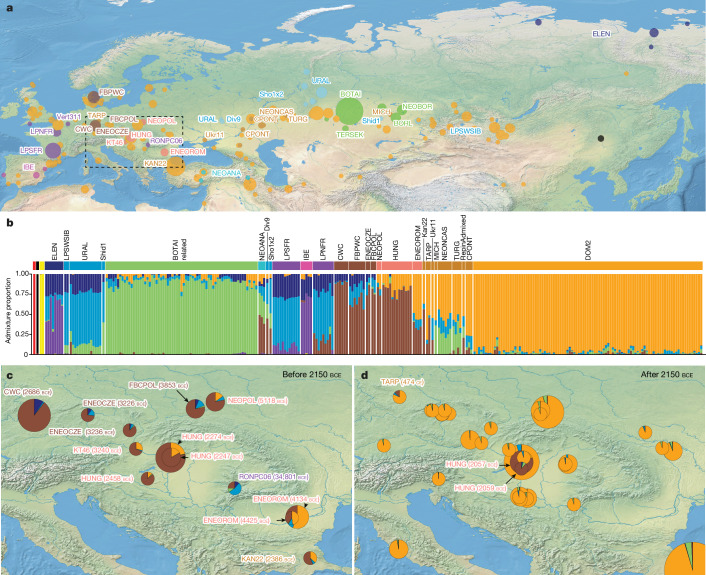
Fig. 1. Geographic distribution and genetic profiles of the 475 ancient horse genomes analysed in this study.
a, Geographic location of the archaeological sites. The size of each location is proportional to the number of horse genomes sequenced. The black dot points to the location of E. ovodovi outgroups. b, Struct-f4 genetic ancestry profiles considering K = 9 components. The top panel provides the colour legend for a. c,d, Genetic ancestry profiles (K = 9) across central Europe, the Carpathian and Transylvanian Basins before (c) and after (d) 2150 bce. The midpoint of the radiocarbon dating range obtained for each site is indicated between parentheses.

