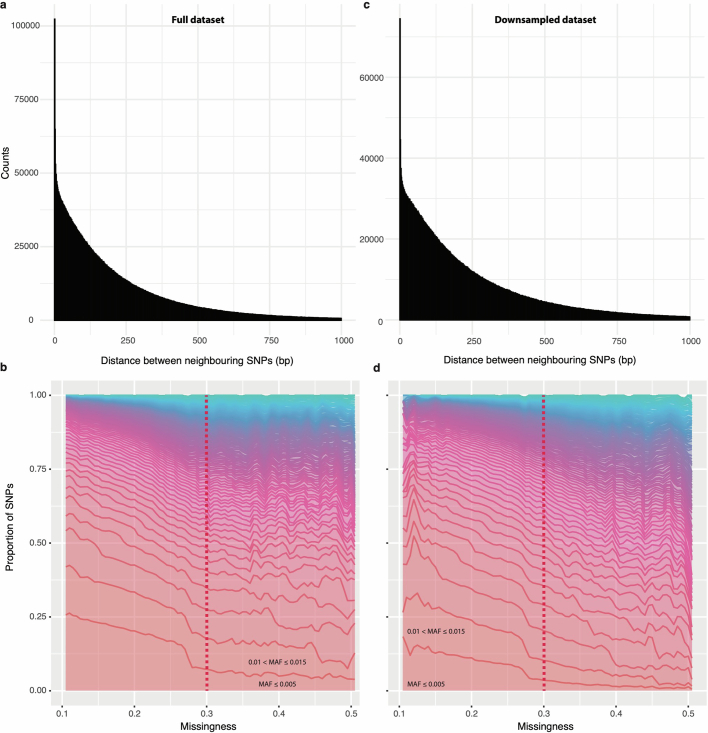
Extended Data Fig. 1. QC filtering.
a) Histogram showing the distance between adjacent nucleotide transversions, if separated by less than 1Kbp. This revealed an excess of mutations at contiguous genomic positions (ie. 1 bp away). Although these could correspond to true single nucleotide polymorphism (SNPs) or multiple nucleotide variants (MNVs), they could also be enriched for spurious variants resulting from mis-mapping around small DNA insertions and deletions. b) Proportion of mutations within pre-defined MAF bins (Minor Allele Frequency), as a function of missingness across the specimens. Pre-defined MAF bins range from low- (pink) to high-frequency variants (green). The dashed line delimits the positions included (left) or excluded (right) from the analyses. The identifiability of low-frequency variants decreases with greater missingness, as expected. c) Same as panel a), for the ~7.1 M nucleotide transversions of the downsampled data set. d) Same as panel b), for the ~7.1 M nucleotide transversions of the downsampled data set.

