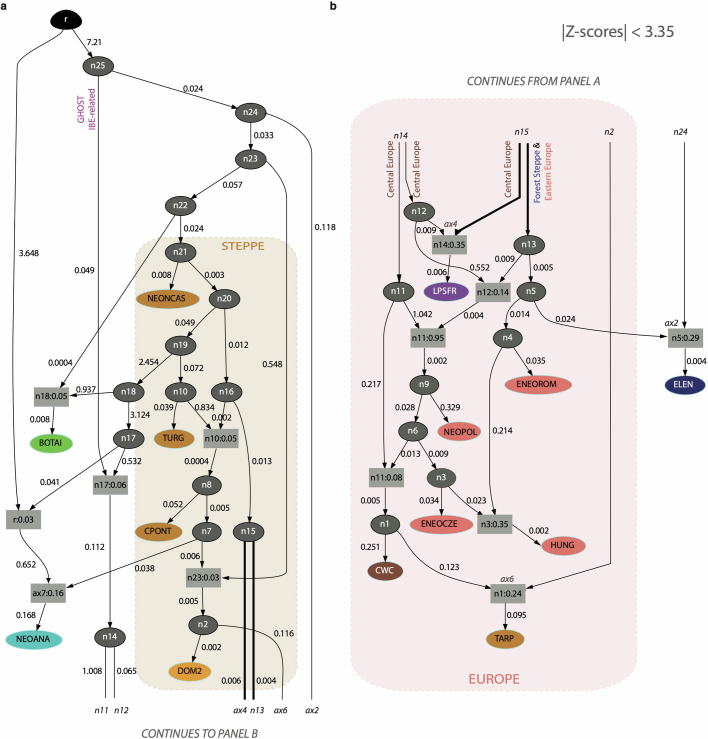
Extended Data Fig. 4. Most supported population graph.
This graph summarizes the evolutionary history of pre- and post-domestication horse lineages, with CWC horses not receiving any direct genetic contribution from the steppe. The model is split into 2 panels for clarity. The numbers reported within boxes reflect the admixture contributions from the nodes specified, while those adjacent to arrows indicate the amount of genetic drift leading to individual nodes. Population groups are detailed in Table S1 and colors are according to Fig. 1a.

