

Abstract
This study aimed to evaluate the value of low-dose dual-input computed tomography perfusion (CTP) imaging in the differential diagnosis of benign and malignant pulmonary ground-glass opacity nodules (GGO). A retrospective study was conducted in patients with GGO who underwent CTP in our hospital from January 2021 to October 2023. All nodules were confirmed via pathological analysis or disappeared during follow-up. Postprocessing analysis was conducted using the dual-input perfusion mode (pulmonary artery and bronchial artery) of the body perfusion software to measure the perfusion parameters of the pulmonary GGOs. A total of 101 patients with pulmonary GGOs were enrolled in this study, including 43 benign and 58 malignant nodules. The dose length product of the CTP (348 mGy.cm) was < 75% of the diagnostic reference level of the unenhanced chest CT (470 mGy.cm). The effective radiation dose was 4.872 mSV. The blood flow (BF), blood volume (BV), mean transit time (MTT), and flow extraction product (FEP) of malignant nodules were higher than those of the benign nodules (p < 0.05). The FEP had the highest accuracy for the diagnosis of malignant nodules (area under the curve [AUC] = 0.821, 95% confidence interval [CI]: 0.735–0.908) followed by BV (AUV = 0.713, 95% CI 0.608–0.819), BF (AUC = 0.688, 95% CI 0.587–0.797), and MTT (AUC = 0.616, 95% CI 0.506–0.726). When the FEP was ≥ 19.12 mL/100 mL/min, the sensitivity was 91.5% and the specificity was 62.8%. To distinguish between benign nodules and malignant nodules, the AUC of the combination of BV and FEP was 0.816 (95% CI 0.728–0.903), whereas the AUC of the combination of BF, BV, MTT, and FEP was 0.814 (95% CI 0.729–0.900). Low-dose dual-input perfusion CT was extremely effective in distinguishing between benign from malignant pulmonary GGOs, with FEP exhibiting the highest diagnostic capability.
Keywords: Ground-glass opacity nodules, Dual-input perfusion computed tomography, Blood volume, Blood flow, Flow extraction product
Subject terms: Cancer, Oncology
Introduction
The global cancer statistics of 20201 showed that the incidence of lung cancer ranks second in the world, and the mortality rate ranks first. Previous studies showed that 5-year survival rate of patients with lung cancer was less than 20% in China2,3. However, for early diagnosed and completely resected cases of adenocarcinoma in situ and minimally invasive adenocarcinoma, the 10-year disease-specific survival rates were 100% and 100%, and the overall survival rates were 95.3% and 97.8%, respectively4. Pulmonary ground-glass opacity nodule (GGO) is defined as an area of indistinct dense opacity on HRCT in which bronchial or pulmonary vascular structures are still visible, with a maximum diameter of less than 3 cm5. Some long-standing pulmonary GGOs may have malignant characteristics or tend to be come malignant. Therefore, early diagnosis and treatment of lung cancer have become one of the hot topics in clinical oncology research.
In recent years, the detection rate of GGO has increased considerably with the widespread application of computed tomography (CT) in lung cancer screening6. The diagnosis of pulmonary GGOs increasingly relies on various noninvasive imaging examinations, including CT, magnetic resonance imaging, and 18F-fluorodeoxyglucose positron-emission tomography7–9, as well as invasive procedures, such as needle biopsy10. Although conventional CT is considered as the standard technique for clinically assessing nodule characteristics, there are many similarities morphological features between the benign and malignant. To distinguish benign from malignant GGO nodules, differentiation based on morphology and density findings is only helpful when nodules have typical features11.
During the process of tumor occurrence and development, there is simultaneous growth of neovascularization in the tumor. The formation of new blood vessels within tumors is necessary for tumor growth and metastasis. Formation of new blood vessels leads to a series of pathophysiological changes, particularly increases in perfusion, blood volume (BV), and capillary permeability12. CT perfusion imaging (CTP) can not only provide morphological and density information regarding lesions but also quantitatively analyze the blood supply of lesions by measuring blood flow (BF), BV, mean transit time (MTT), flow extraction product (FEP), and other lesion parameters13. These parameters reflect the functional activity of the lesion and are considered to be substitutes for the physiological and molecular processes of tumor angiogenesis14,15. In most previous studies on lung CTP, the aorta has been considered to be the sole input artery in a single-input perfusion model16,17. This model reflects the dominant blood supply to lung tumors but often overlooks the blood perfusion of the parts receiving lesser blood supply parts. Moreover, previous CTP studies have mainly focused on solid pulmonary nodules18,19. However, a few studies have used dual-input CTP for the identification of benign and malignant GGOs. It was originally believed that the blood supply of most lung tumors was provided by the bronchial arterial system20,21. The lung has two blood supply systems: pulmonary circulation and systemic circulation. Under physiological conditions, the pulmonary circulation system provides the primary blood supply to the lung parenchyma, accounting for approximately 95% of the total lung BF. Although bronchial circulation accounts for a small portion of the total lung BF, it play a crucial role in maintaining airway and lung function. Therefore, the pulmonary artery can theoretically provide blood supply to tumors, which has been confirmed via postmortem stereoscopic microangiography and in vivo experiments22,23. Therefore, single-input CTP cannot accurately and clearly reflect the proportion of dual blood supply to the lung and cannot quantitatively analyze the proportion of systemic and pulmonary circulation in lung lesions. This study aimed to investigate the value of dual-input CTP imaging in the differential diagnosis of benign and malignant pulmonary GGOs.
Materials and methods
Patients
This retrospective study was conducted in patients with GGO nodules who underwent perfusion CT in our hospital between January 2021 and October 2023. This study was approved by the Medical Ethics Committee of Chengdu First People’s hospital (2022 KT 003) and was conducted following the guidelines of the Declaration of Helsinki. Written informed consent was obtained from all patients before performing CT. The inclusion criteria were as follows: (1) patients who could cooperate with CTP; (2) those who had pure GGOs (pGGOs) or part-solid GGOs with diameters ≥ 0.6 cm and < 3 cm; (3) those shoeing dynamic images with acceptable respiratory motion artifacts according to the observer and CT perfusion software; and (4) those whose conditions were confirmed via surgical or nonsurgical pathological biopsy. The interval between the time of pathological sampling and CTP should be < 3 months. Alternatively, confirmation of lesion disappearance through follow-up (indicating a diagnosable benign GGO) can also be considered. The following exclusion criteria were used: (1) patients with common contraindications of iodinated contrast injection; (2) those with nephrotic syndrome, diabetic nephropathy, hypertensive nephropathy, chronic renal insufficiency, and other basic nephropathy; (3) those who could not hold their breath during CT scanning, resulting in incorrect perfusion values and parameter map artifacts; and (4) those who had nodule too close (distance < 0.5 cm) to the heart border or diaphragm, resulting in excessive motion artifacts on the images, which can make the analysis challenging. This was judged by a radiologist who has an experience of > 5 years (H.xy).
CT perfusion imaging protocols
A SOMATOM Definition Flash scanner (Siemens, Germany) was used to perform CT. Initially, we performed low-dose spiral CT using automatic exposure control (Care KV) and automatic tube current modulation (Care Dose 4D), with a reference tube voltage of 100 kV and tube current of 40 mAs. The gantry rotation time was 280 ms, and the pitch was 1.5. The slice thickness and interval were both 1 mm. The I50f. Medium Sharp ASA with SAFIRE algorithm was used to perform iterative reconstruction. The central slice of plain CT imaging containing GGOs was selected. Using this slice as the reference, the scanning range covered 15 cm along the Z-axis that included the entire nodule for subsequent CTP. After the plain scan was completed, 30 mL of a contrast agent, iodomyren (400 mg/mL), was injected at a rate of 4.5 mL/s through a high-pressure syringe into the cubital vein. Immediately after injection of the contrast agent, the tube was flushed with 30 mL of normal saline to enhance perfusion. The CTP parameters were as follows: tube voltage: 70 kV, tube current: 100 mAs, and 4D range: 150 mm. The rotation time was 280 ms, and the total exposure time was 13 times. The first acquisition was performed 6 s after injecting the contrast agent, the acquisition intervals between the 1st to 10th was 3 s, the acquisition intervals between the 11th to 13th was 4.5 s, and the total scan time was 43.65 s. The scan slice thickness was 3 mm, the reconstruction slice thickness was 3 mm, and the reconstruction matrix was 512 × 512. The reconstruction algorithm was B20f. smooth.
Image postprocessing
After scanning, all images were transferred to a postprocessing workstation (syngo.via VB20A) for data analysis using body perfusion software. First, we selected the liver as the target organ. The liver model of the software can analyze the dual blood supply of the liver tissue or a lesion, whereas the lung mode can only analyze the single blood supply. Therefore, this study used a liver model to analyze the dual blood supply (pulmonary artery and bronchial artery) of pulmonary nodules. Second, the phase with the best image quality was selected for motion correction and denoising. The deconvolution method was used to calculate the perfusion parameters. The HU value threshold was used to remove air and bone pixels, resulting in a selection range of 50–150 HU. Third, vessel selection was performed as follows24. The attenuation peak of the tumor-free lung tissue was used to divide the time–density curve (TDC) of the pulmonary nodules. The TDC before the attenuation peak of lung tissue was defined as the pulmonary artery phase, during which bronchial artery perfusion was considered negligible because the contrast agent in the aorta was assumed to be negligible. The TDC after the peak was defined as the bronchial artery phase (Fig. 1). The procedure was as follows: (1) The region of interest (ROI) was placed in the main pulmonary artery to identify it as the input artery. The ROI was placed as far as possible in the main pulmonary artery. If the main pulmonary artery was not included in the scanning slice, the ROI was placed in the largest pulmonary artery segment in the slice. (2) The ROI was placed in the descending aorta to identify the bronchial artery as the input artery. (3) The ROI was placed within tumor-free lung tissue, and blood vessels were avoided as much as possible. (4), while avoiding the cavity and necrotic component, 50%–70% of the ROI encompassing the lesion size was manually delineated on the coronal, sagittal, and axial images to measure the perfusion parameters, including the BF, BV, MTT, and FEP, and the TDC of the nodules was obtained. The ROI for background lung used for TDC settings can be found in supplementary Fig. 1. The above procedures were performed using a blinded method by two radiologists with > 5 years of work experience (H.xy, with 7 years of work experience, and W.ls with 15 years of work experience), and the data obtained by the two radiologists were checked for consistency to evaluate interobserver agreement. Finally, the average value obtained by the two radiologists was used as the perfusion parameter value.
Figure 1.

Time–density curve (TDC) of input arteries. The yellow arrow indicates the attenuation peak of the tumor–free lung tissue. The TDC on the left of the yellow arrow is defined as the pulmonary artery phase, and the TDC on the right of the yellow arrow is defined as the bronchial artery phase.
The quality of the perfusion image was evaluated based on the TDC of the lesion14. The TDC is mainly affected by motion calibration and beam hardening. A 3-point scale was used with 1 indicating excellent (accurate TDCs), 2 indicating appropriate (small-bundle sclerosis or misregistration, acceptable TDCs), and 3 indicating poor (misregistration or extensive beam hardening not acceptable for TDCs).
Radiation dose analysis
After scanning, the volume CT dose index (CTDIvol, mGy) and dose length product (DLP, mGy.cm) were collected and recorded. The effective radiation dose (ED, mSv) was calculated according to the following formula:
where k = 0.014 mSv/mGy.cm.
The results were compared with the Chinese diagnostic reference levels (DRLs)25 and the updated 2017 American College of Radiology (ACR) DRLs26.
Statistical analyses
The Statistical Package for the Social Sciences (version 22; IBM Statistics for Windows, IBM Corp., Armonk, NY) was used to perform all data analyses. The Kolmogorov–Smirnov normality test and Levene’s test for homogeneity of variance were performed for all data. Data that followed a normal distribution and homogeneity of variance, were represented as the mean ± standard deviation, and an independent-samples t-test was used to compare the differences between the benign and malignant groups. Nonparametric tests were performed to compare non-normally distributed data. P-values of < 0.05 were considered to indicate statistical significance. As the BF, BV, MTT, and FEP data were not normally distributed in both groups, the Mann–Whitney U test was performed to compare the perfusion parameters between the two groups. Receiver operating characteristic (ROC) curve analysis was performed to evaluate the diagnostic ability of the CT perfusion parameters to differentiate between benign nodules from malignant nodules, and the Youden index was used to determine the best cutoff value. The intraclass correlation coefficient (ICC) was used to check the consistency between the data obtained by the two radiologists.
Results
Basic patient information
Overall, 101 patients were included in this study (50 males, 51 females), with an average age of 58.92 ± 12.87 years. There were 43 benign nodules with an average diameter of 0.9 ± 0.75 cm and 58 malignant nodules with an average diameter of 1.0 ± 0.74 cm. All malignant nodules (100%, 58/58) were pathologically confirmed via surgical resection. Among the 43 benign nodules, 11 (25.58%, 11/43) were pathologically confirmed via surgical resection, and 32 disappeared or decreased in size during follow-up and were confirmed as benign nodules. The basic information of patients and morphological features of nodules are shown in Table 1. A flow chart of the patient selection is presented in Fig. 2.
Table 1.
Basic patient information of patients and morphological features of nodules.
| Characteristic | Malignant nodules | Benign nodules | p |
|---|---|---|---|
| N | 58 | 43 | / |
| Ago (y, mean ± SD) | 60.19 ± 10.81 | 56.53 ± 15.01 | 0.109 |
| Sex | / | / | 0.07 |
| Male | 22 | 28 | / |
| Female | 36 | 15 | / |
| Underlying lung disease | / | / | 0.029 |
| No | 54 | 36 | / |
| COPD | 2 | 7 | / |
| Size (cm,M ± IQR) | 1.0 ± 0.74 | 0.9 ± 0.75 | 0.042 |
| Density | / | / | < 0.001 |
| pGGO | 34 | 7 | / |
| Part-solid GGN | 24 | 34 | / |
| Pathology | / | / | / |
| MIA | 31 | / | / |
| IA | 27 | / | / |
| Location | / | / | / |
| Right upper lobe | 23 | 4 | / |
| Right middle lobe | 3 | 8 | / |
| Right lower lobe | 10 | 17 | / |
| Left upper lobe | 16 | 7 | / |
| Left lower lobe | 6 | 7 | / |
| Lobulation | / | / | < 0.001 |
| + | 34 | 4 | / |
| − | 24 | 39 | / |
| Spiculation | / | / | 0.014 |
| + | 17 | 4 | / |
| − | 41 | 39 | / |
| Vacuole sign | / | / | 0.437 |
| + | 5 | 2 | / |
| − | 53 | 41 | / |
| Vascular anomaly | / | / | < 0.001 |
| + | 53 | 27 | / |
| − | 5 | 16 | / |
| Lesion surrounding lung tissue | / | / | 0.742 |
| Normal | 56 | 42 | / |
| Surrounding emphysematous | 2 | 1 | / |
| Pleural invasion | 0 | 0 | / |
| Distance to pleural | / | / | 0.545 |
| < 0.1 cm | 7 | 7 | |
| > 0.1 cm | 51 | 36 |
MIA minimally invasive adenocarcinoma, IA invasive adenocarcinoma, COPD chronic obstructive pulmonary disease.
Figure 2.

Flow chart of the patient selection.
Image quality assessment
Of the 101 pulmonary nodules included, 78 showed excellent TDC and 33 showed appropriate TDC.
ICC
Two chest radiologists with > 5 years of work experience independently measured the BF, BV, MTT, and FEP values of the GGOs by constructing ROIs on coronary, sagittal, and axial images. The average values were calculated, and the ICC was used to check the consistency between the data obtained by the two radiologists. The results are shown in Table 2.
Table 2.
Consistency test of the data obtained by the two radiologists.
| BF | BV | MTT | FED | |
|---|---|---|---|---|
| ICC (95% CI) | 0.99 (0.985–0.994) | 0.987 (0.981–0.991) | 0.984 (0.976–0.989) | 0.99 (0.986–0.993) |
| p | < 0.001 | < 0.001 | < 0.001 | < 0.001 |
Comparison of CT perfusion parameters
The values of BF, BV, MTT, and FEP of malignant nodules were significantly higher than those of benign nodules (P < 0.05). The results are presented in Table 3. Figure 3 shows the CT images and TDC of patient with benign nodules, and Fig. 4 shows the CT images and TDC of patient with malignant nodules.
Table 3.
Comparison of perfusion parameters between benign and malignant nodules.
| Benign nodules | Malignant nodules | z | p | |
|---|---|---|---|---|
| BF (mL/100 mL/min) | 89.37 ± 110.14 | 140.51 ± 94.96 | − 2.75 | 0.007 |
| BV (mL/100 mL) | 6.01 ± 8.49 | 9.76 ± 6.43 | 3.65 | < 0.001 |
| MTT (/s) | 3.88 ± 1.63 | 4.56 ± 2.63 | 1.985 | 0.047 |
| FEP (mL/100 mL/min) | 12.34 ± 26.39 | 37.82 ± 37.68 | 5.501 | < 0.001 |
Figure 3.

Inflammatory GGO nodules. A 56-year-old woman patient presented with cough and sputum for 3 weeks. (a) Unenhanced CT on April 16, 2023, showed a part-solid nodule in the lower lobe of the right lung. (b) Based on the TDC of CT perfusion of the nodule on April 17, 2023, the curve shows a slowly rise pattern, followed by a plateau, and slowly decreasing pattern. (c) Based on the follow-up CT on May 19, 2023, the density of the nodule was decreased. (d) Based on the follow-up CT on December 6, 2023, the nodule in the lower lobe of the right lung have disappeared.
Figure 4.
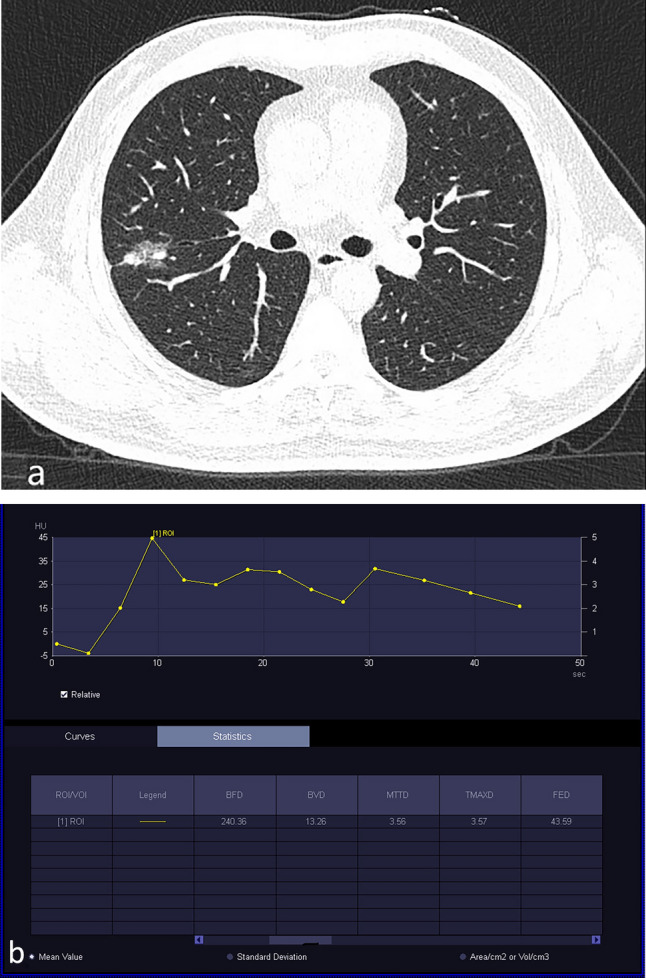
Invasive adenocarcinoma. A 56-year-old man underwent physical examination, which revealed pulmonary nodules. (a) Plain CT showed part-solid GGO nodules in the upper lobe of the right lung. (b) Based on the TDC of CT perfusion of the part-solid nodule, the curve shows a rapidly increasing pattern followed by a slowly decreasing pattern.
Diagnostic efficacy of CT perfusion parameters in distinguishing benign from malignant nodules
The area under the ROC curve (AUC) for BF to distinguish benign from malignant nodules was 0.688, with a 95% confidence interval (CI) of 0.587–0.797. When the BF threshold was set at 98.38 mL/100 mL/min for diagnosing malignant nodules, the sensitivity was 81.4% and the specificity was 55.8%. The AUC for BV to distinguish benign from malignant nodules was 0.713, with a 95% CI of 0.608–0.819. When the BV threshold was set at 6.87 mL/100 mL for diagnosing malignant nodules, the sensitivity was 86.4% and the specificity was 53.5%. The AUC for MTT to distinguish benign from malignant nodules was 0.616, with a 95% CI of 0.506–0.726. When the MTT threshold was set at 5.17/s for diagnosing malignant nodules, the sensitivity was 47.5% and the specificity was 76.7%. The AUC for FEP to distinguish benign from malignant nodules was 0.821, with a 95% CI of 0.735–0.908. When the FEP threshold was set at 19.12 mL/100 mL/min for diagnosing malignant nodules, the sensitivity was 91.5% and the specificity was 62.8%. The AUC of the combination of BV and FEP to distinguish of benign from malignant nodules was 0.816, with a 95% CI of 0.728–0.903. When the BV ≥ 7.17 mL/100 mL and the FEP ≥ 16.56 mL/100 mL/min were used as the threshold for the diagnosis of malignant nodules, the sensitivity was 60.5% and the sensitivity was 93.1%. The AUC of the combination of BF, BV, MTT, and FEP to distinguish benign from malignant nodules was 0.814, with a 95% CI of 0.729–0.900. When BF ≥ 114.71 mL/100 mL/min, BV ≥ 12.85 mL/100 mL, MTT ≥ 7.42/s, and FEP ≥ 16.56 mL/100 mL/min were used as the threshold for the diagnosis of malignant nodules, and the sensitivity was 60.5% and the specificity was 91.4%.
Radiation dose
The same scanning protocol was used for all included patients. The DLP of CT perfusion was 348 mGy.cm and CTDIvol was 22.61 mGy. The DLP was < 75% of the Chinese DRL25 of chest unenhanced CT (DLP: 470 mGy.cm) and < 50% of the updated 2017 ACR DRL26 of enhanced chest CT (DLP: 374 mGy.cm). The effective radiation dose was 4.87 mSV.
Discussion
In this study, the differences in perfusion parameters between benign and malignant GGOs were analyzed by performing dual-input CT perfusion. The results showed that the BF, BV, MTT, and FEP of malignant nodules were higher than those of benign nodules. Both BV and FEP had high accuracy for diagnosis of benign and malignant GGOs. When BV ≥ 6.87 mL/100 mL or FEP ≥ 19.12 mL/100 mL/min were used as the threshold for the diagnosis of malignant nodules, the sensitivity was high. These findings indicate that dual-input CT perfusion can help clinicians improve the diagnostic accuracy of malignant GGOs, thus enabling the development of appropriate diagnosis and treatment plans for patients and ultimately improving patient outcomes.
In this study, all malignant nodules were confirmed by pathological examination after surgical resection. In the benign nodule group, 11 cases were pathologically confirmed by surgical resection. The pathological changes of these cases were mainly interstitial fibroplasia with carbon dust deposition and inflammatory cell aggregation. The 32 benign nodules were followed up by CT, and the nodules were found to shrink or disappear, indicating inflammatory nodules. Benign lesions, including focal interstitial fibrosis, infection, inflammatory processes, or pulmonary hemorrhage27, may appear as part-solid nodules on CT. The main component of focal fibrosis is interstitial septal thickening with fibroblast proliferation28. The solid component may be related to fibrotic lesions or alveolar collapse. If the alveolar hemorrhage exudates more, it may also present as part-solid nodules. However, malignant GGOs were more likely to show signs such as lobulation, spiculation, vacuole sign, and vascular changes (including vascular dilation, twisting, vascular bundle sign, etc.) than GGOs in our study, which were consistent with previous studies29,30. In this study, benign nodule patients were more likely to have chronic obstructive pulmonary disease (COPD). Due to the poor lung function in COPD patients, they were more susceptible to infections. The surrounding lung tissue of benign and malignant pulmonary ground-glass nodules rarely showed abnormalities. Only a few nodules exhibited emphysematous changes around them, but these were all due to COPD. In our study, we found no cases of pleural invasion. Some of the nodules were close to the pleura, which did not differ between the benign and malignant nodules. If the nodules invaded the pleura, the intercostal artery, subclavian artery, axillary artery, and inferior phrenic artery may be involved. However, these arteries all belong to the aortic system and will not affect our dual blood supply model, as the bronchial artery originate from the aortic system.
The results of our study showed that the BF and BV of malignant nodules were higher than those of benign nodules. This finding is consistent with that of previous studies31–34. The number and maturity of tumor blood vessels paly roles in their biological behavior and a key role in tumor growth35. As the tumor grows and its invasiveness increases, it develops new blood vessels to facilitate its growth and meet the increasing demands. A previous31 showed that the microvessel density, vascular lumen area, number of vessels, and vascular perimeter of malignant nodules were higher than those of benign nodules. BF indicates the blood flow per unit time through the vascular structures (including arteries, capillaries, veins, and venous sinuses). BV indicates the vascular bed volume per unit volume within an ROI, including capillaries and large vessels, which is related to the diameter and number of blood vessels. Both BF and BV are significantly positive correlations with microvessel density, vascular lumen area, number of vessels, and vascular perimeter31,36. Therefore, the BF and BV of malignant nodules were higher than those of benign nodules.
Our study results showed that the FEP of malignant nodules was higher than that of benign nodules. This is because the FEP primarily reflects the permeability of blood vessels. Malignant nodules have extensive neovascularization, immature blood vessel development, incomplete vessel walls, and increased capillary permeability due to the presence of vascular endothelial growth factor and other angiogenic factors. In contrast, benign nodules have relatively straight vessel branches, relatively mature vessels, and lower vessel-wall permeability35,37. Therefore, the FEP of malignant nodules was higher than that of benign nodules, consistent with the findings of previous studies31,32.
This study showed that the MTT of benign nodules was shorter than that of malignant nodules. MTT primarily reflects the average time required for contrast agents to flow through vascular structures, including arteries, capillaries, venous sinuses, and veins. Stimulation by various factors causes neovascularization in tumors, thereby supplying sufficient nutrients for their growth and metastasis. However, the newly formed vascular network in tumors differs from that in normal vasculature. The new vasculature is often tortuous and irregularly shaped. Compared with normal blood vessels, tumor blood vessels are characterized by structural abnormalities, which may lead to significant functional defects and uneven hemodynamics38, thereby increasing the transit time of a contrast agent through the blood vessels. However, as the vessels of inflammatory nodules are mature and dilated, the transit time of a contrast agent through these vessels is naturally shorter. Some benign nodules, such as chronic inflammatory nodules, tuberculomas, and hamartomas, have fewer vascular components, therefor the transit time of a contrast agent through these nodules is also extremely short. Therefore, compared with the benign nodules, the malignant nodules had a longer MTT.
The ROC analysis showed that the FEP (with the AUC of 0.821) had the highest accuracy in the differential diagnosis of benign and malignant nodules, followed by the BV, BF, and MTT. Research39 has reported that quantitative CT analysis of lung parenchyma can improve the malignant risk assessment of incidentally pulmonary nodules, with an AUC of approximately 0.9. However, their study focused on the lung parenchyma density and emphysema index, without evaluating the characteristics of the nodules themselves. We can directly observe the morphological features and blood supply characteristics of the nodules using CT perfusion imaging. When the BF, BV, and FEP were used alone in the diagnosis of malignant nodules, the overall sensitivity was > 80%, but the specificity was low at 55.8%, 53.5%, and 62.8%, respectively. This may be because the benign nodules included in this study encompassed active inflammatory nodules, chronic inflammatory nodules, tuberculoma, sclerosing hemangiomas, osteochondromatous hamartomas, and chronic granulomatous nodules. Inflammatory nodules during the active phase can lead to vascular dilation, congestion, and increased vascular permeability because inflammatory mediators are released during this phase, resulting in increased BF, BV, and FEP. Therefore, there is some overlap in the characteristics of the perfusion parameters between malignant and inflammatory nodules, leading to a lack of high specificity in the diagnosis. Subgroup analysis, such as further analysis of the differences in perfusion parameters between active and inactive inflammatory nodules and malignant nodules, may improve the sensitivity and specificity of CT perfusion parameters in the diagnosis of pulmonary nodules.
Our results showed that a tube voltage of 70 kV for CTP successfully reduced the radiation dose with a DLP of 348 mGy.cm. As there are no established DRLs for chest enhanced CT and CTP in China, it is impossible to make a direct comparison. However, we found that the DLP of CTP is < 75% of the Chinese DRL [25] of chest unenhanced CT scans and < 50% of the updated 2017 ACR DRL of enhanced chest CT26. The effective radiation dose can be as low as 4.87 mSV. Through evaluation of nodules via CTP, we can mainly to generate perfusion-related parameters in the ROI within the nodules and to compare perfusion parameters without observing the morphological characteristics of the nodules on perfusion images. The morphological features of the nodules were mainly observed via low-dose unenhanced CT. In our study, the evaluation of perfusion image quality was based on the TDC of the lesion. To ensure the reliability of perfusion images, several methods can be used to reduce image noise, such as selection of a thicker reconstruction slice. In our study, the thickness of the reconstructed slice was 3 mm, and motion correction and 4D noise-reduction techniques were also used. Although the diameter of the nodules in our study was 3 cm, the Z-axis coverage of our CTP scan was 15 cm because the perfusion scan time was long, so the total scanning time was 43.65 s, and the patient was rarely able to hold his or her breath for such a long time. Therefore, to avoid the leakage of nodules during a perfusion scan due to the influence of respiratory movement, the coverage length of the Z-axis was extended under calm breathing condition. To ensure the acquisition of a complete perfusion curve while reducing the radiation dose, we also set the scanning interval time to 3–4.5 s and obtained 13 times nodes. The perfusion curve quality of the included pulmonary nodules was excellent and moderate. The perfusion parameters measured by the two radiologists showed good consistency. Therefore, this scanning protocol can achieve the goal of using low-dose CTP while ensuring the accuracy of data and achieving a given research purpose.
This study had some limitations. First, the sample size was small, and subgroup analysis was not conducted for different pathological types of malignant nodules or benign nodules with active or inactive biological behavior. These aspects may cause significant variations in the perfusion parameters between malignant and benign nodule groups as well as lower specificity of the perfusion parameters for distinguishing the two nodule types. However, this study is ongoing, and we will collect more samples for subgroup analysis to further improve the diagnostic value of CTP for benign and malignant pulmonary GGOs. Second, this study only included patients with part-solid nodules and pGGOs and excluded those with solid nodules; therefore, the differences in perfusion parameters between nodules with different densities were not analyzed. Third, this study only performed a comparative analysis of perfusion parameters and did not analyze the specific conditions of blood supply through bronchial and pulmonary arteries in the nodules. We also plan to explore this task in the future. Fourth, this study did not analyze the pathological characteristics of the nodules, as some pathological features such as vascular quantification analysis require special staining techniques, which are limited in retrospective study. Additionally, this technique cannot assess whether there is shunting between the pulmonary artery and bronchial artery.
Conclusion
The values of BF, BV, MTT, and FEP of malignant GGOs were higher than those of benign GGOs. Low-dose dual-input CTP showed high diagnostic value for distinguishing between benign from malignant pulmonary GGOs, with FEP exhibiting the highest diagnostic capability. The diagnostic capabilities of the combination of FEP and BV and of the combination of BF, BV, FEP, and MTT were equivalent to the diagnostic capability of FEP alone. However, compared with the use of BF, BV, FEP, and MTT alone, the combined use of the four perfusion parameters improved the ability to distinguish benign from malignant nodules relative to the ability of BF, BV, and MTT alone.
Supplementary Information
Author contributions
GJ and W.LS completed the research and measured the data. H.XY analyzed the data and wrote the main manuscript text. LW and L.WB measured the data and prepared figures. YF reviewed the findings.All authors reviewed the manuscript.
Funding
This work was funded by Chengdu Medical Research Project, Chengdu Municipal Health Commission. [grant number:2021018].
Data availability
The datasets generated during and analysed during the current study are available from the corresponding author on reasonable request.
Competing interests
The authors declare no competing interests.
Footnotes
Publisher's note
Springer Nature remains neutral with regard to jurisdictional claims in published maps and institutional affiliations.
These authors contributed equally: Xiaoyan Hu, Jie Gou and Lishan Wang.
Supplementary Information
The online version contains supplementary material available at 10.1038/s41598-024-68143-x.
References
- 1.Sung, H. et al. Global cancer statistics 2020: GLOBOCAN estimates of incidence and mortality worldwide for 36 cancers in 185 countries. CA Cancer J. Clin.71(3), 209–249. 10.3322/caac.21660 (2021). 10.3322/caac.21660 [DOI] [PubMed] [Google Scholar]
- 2.Zeng, H. et al. Changing cancer survival in China during 2003–15: A pooled analysis of 17 population-based cancer registries. Lancet Glob. Health6(5), e555–e567. 10.1016/S2214-109X(18)30127-X (2018). 10.1016/S2214-109X(18)30127-X [DOI] [PubMed] [Google Scholar]
- 3.He, S. et al. Cancer profiles in China and comparisons with the USA: A comprehensive analysis in the incidence, mortality, survival, staging, and attribution to risk factors. Sci. China Life Sci.67(1), 122–131. 10.1007/s11427-023-2423-1 (2024). 10.1007/s11427-023-2423-1 [DOI] [PubMed] [Google Scholar]
- 4.Yotsukura, M. et al. Long-term prognosis of patients with resected adenocarcinoma in situ and minimally invasive adenocarcinoma of the lung. J. Thorac. Oncol.16(8), 1312–1320. 10.1016/j.jtho.2021.04.007 (2021). 10.1016/j.jtho.2021.04.007 [DOI] [PubMed] [Google Scholar]
- 5.Cai, Y. et al. Correlation exploration among CT imaging, pathology and genotype of pulmonary ground-glass opacity. J. Cell. Mol. Med.27(14), 2021–2031. 10.1111/jcmm.17797 (2023). 10.1111/jcmm.17797 [DOI] [PMC free article] [PubMed] [Google Scholar]
- 6.Lee, H. Y. & Lee, K. S. Ground-glass opacity nodules: Histopathology, imaging evaluation, and clinical implications. J. Thorac. Imaging26(2), 106–118. 10.1097/RTI.0b013e3181fbaa64 (2011). 10.1097/RTI.0b013e3181fbaa64 [DOI] [PubMed] [Google Scholar]
- 7.Jiang, W. et al. Diffusion-weighted imaging diagnostic algorithm in patients with suspected pleural malignancy. Eur. Radiol.31(12), 9038–9047. 10.1007/s00330-021-08013-6 (2021). 10.1007/s00330-021-08013-6 [DOI] [PMC free article] [PubMed] [Google Scholar]
- 8.Shao, X. et al. Investigating the association between ground-glass nodules glucose metabolism and the invasive growth pattern of early lung adenocarcinoma. Quant. Imaging Med. Surg.11(8), 3506–3517. 10.21037/qims-20-1189 (2021). 10.21037/qims-20-1189 [DOI] [PMC free article] [PubMed] [Google Scholar]
- 9.He, Y. et al. Growth assessment of pure ground-glass nodules on CT: Comparison of density and size measurement methods. J. Cancer Res. Clin. Oncol.149(12), 9937–9946. 10.1007/s00432-023-04918-5 (2023). 10.1007/s00432-023-04918-5 [DOI] [PMC free article] [PubMed] [Google Scholar]
- 10.An, W. et al. Comparison of CT-guided core needle biopsy in pulmonary ground-glass and solid nodules based on propensity score matching analysis. Technol. Cancer Res. Treat.21, 15330338221085356. 10.1177/15330338221085357 (2022). 10.1177/15330338221085357 [DOI] [PMC free article] [PubMed] [Google Scholar]
- 11.Winer-Muram, H. T. The solitary pulmonary nodule. Radiology239(1), 34–49. 10.1148/radiol.2391050343 (2006). 10.1148/radiol.2391050343 [DOI] [PubMed] [Google Scholar]
- 12.Miles, K. A. Tumour angiogenesis and its relation to contrast enhancement on computed tomography: A review. Eur. J. Radiol.30(3), 198–205. 10.1016/s0720-048x(99)00012-1 (1999). 10.1016/s0720-048x(99)00012-1 [DOI] [PubMed] [Google Scholar]
- 13.Sun, Y. et al. Low-dose volume perfusion computed tomography (VPCT) for diagnosis of solitary pulmonary nodules. Eur. J. Radiol.85(6), 1208–1218. 10.1016/j.ejrad.2016.03.026 (2016). 10.1016/j.ejrad.2016.03.026 [DOI] [PubMed] [Google Scholar]
- 14.Miles, K. A. et al. Current status and guidelines for the assessment of tumour vascular support with dynamic contrast-enhanced computed tomography. Eur. Radiol.22(7), 1430–41. 10.1007/s00330-012-2379-4 (2012). 10.1007/s00330-012-2379-4 [DOI] [PubMed] [Google Scholar]
- 15.Park, M. S. et al. Perfusion CT: Noninvasive surrogate marker for stratification of pancreatic cancer response to concurrent chemo- and radiation therapy. Radiology250(1), 110–117. 10.1148/radiol.2493080226 (2009). 10.1148/radiol.2493080226 [DOI] [PubMed] [Google Scholar]
- 16.Zhu, B., Zheng, S., Jiang, T. & Hu, B. Evaluation of dual-energy and perfusion CT parameters for diagnosing solitary pulmonary nodules. Thorac. Cancer12(20), 2691–2697. 10.1111/1759-7714.14105 (2021). 10.1111/1759-7714.14105 [DOI] [PMC free article] [PubMed] [Google Scholar]
- 17.Yan, G. et al. Multimodality CT imaging contributes to improving the diagnostic accuracy of solitary pulmonary nodules: A multi-institutional and prospective study. Radiol. Oncol.57(1), 20–34. 10.2478/raon-2023-0008 (2023). 10.2478/raon-2023-0008 [DOI] [PMC free article] [PubMed] [Google Scholar]
- 18.Bohlsen, D. et al. First pass dual input volume CT-perfusion of lung lesions: The influence of the CT- value range settings on the perfusion values of benign and malignant entities. Eur. J. Radiol.85(6), 1109–1114. 10.1016/j.ejrad.2016.03.013 (2016). 10.1016/j.ejrad.2016.03.013 [DOI] [PubMed] [Google Scholar]
- 19.Li, Y. et al. First-pass perfusion imaging of solitary pulmonary nodules with 64-detector row CT: Comparison of perfusion parameters of malignant and benign lesions. Br. J. Radiol.83(993), 785–790. 10.1259/bjr/58020866 (2010). 10.1259/bjr/58020866 [DOI] [PMC free article] [PubMed] [Google Scholar]
- 20.Littleton, J. T., Durizch, M. L., Moeller, G. & Herbert, D. E. Pulmonary masses: Contrast enhancement. Radiology177(3), 861–871. 10.1148/radiology.177.3.2244002 (1990). 10.1148/radiology.177.3.2244002 [DOI] [PubMed] [Google Scholar]
- 21.Mingjun, H., Gansheng, F., Yang Jianyong, Su. & Hong-ying, Z.-C. The pulmonary artery doesn’t participate in the blood supply of lung cancer: Experimental and DSA study. Chin. J. Radiol.34, 802–804 (2000). [Google Scholar]
- 22.Milne, E. N. Circulation of primary and metastatic pulmonary neoplasms. A postmortem microarteriographic study. Am. J. Roentgenol. Radium Ther. Nucl. Med.100(3), 603–19. 10.2214/ajr.100.3.603 (1967). 10.2214/ajr.100.3.603 [DOI] [PubMed] [Google Scholar]
- 23.Yuan, X. et al. Lung cancer perfusion: Can we measure pulmonary and bronchial circulation simultaneously?. Eur. Radiol.22(8), 1665–1671. 10.1007/s00330-012-2414-5 (2012). 10.1007/s00330-012-2414-5 [DOI] [PubMed] [Google Scholar]
- 24.Nakano, S. et al. Perfusion evaluation of lung cancer: Assessment using dual-input perfusion computed tomography. J. Thorac. Imaging28(4), 253–262. 10.1097/RTI.0b013e318281dcee (2013). 10.1097/RTI.0b013e318281dcee [DOI] [PubMed] [Google Scholar]
- 25.Diagnostic reference levels for adults in X-ray computed tomography.WS/T 637—2018.
- 26.Kanal, K. M. et al. Diagnostic reference levels and achievable doses for 10 adult CT examinations. Radiology284(1), 120–133. 10.1148/radiol.2017161911 (2017). 10.1148/radiol.2017161911 [DOI] [PubMed] [Google Scholar]
- 27.Mironova, V. & Blasberg, J. D. Evaluation of ground glass nodules. Curr. Opin. Pulm. Med.24(4), 350–354. 10.1097/MCP.0000000000000492 (2018). 10.1097/MCP.0000000000000492 [DOI] [PubMed] [Google Scholar]
- 28.Gao, J. W. et al. Pulmonary ground-glass opacity: Computed tomography features, histopathology and molecular pathology. Transl. Lung Cancer Res.6(1), 68–75. 10.21037/tlcr.2017.01.02 (2017). 10.21037/tlcr.2017.01.02 [DOI] [PMC free article] [PubMed] [Google Scholar]
- 29.Qin, Y. et al. Clinical characteristics of resected solitary ground-glass opacities: Comparison between benign and malignant nodules. Thorac. Cancer11(10), 2767–2774. 10.1111/1759-7714.13575 (2020). 10.1111/1759-7714.13575 [DOI] [PMC free article] [PubMed] [Google Scholar]
- 30.Li, W. J., Lv, F. J., Tan, Y. W., Fu, B. J. & Chu, Z. G. Benign and malignant pulmonary part-solid nodules: Differentiation via thin-section computed tomography. Quant. Imaging Med. Surg.12(1), 699–710. 10.21037/qims-21-145 (2022). 10.21037/qims-21-145 [DOI] [PMC free article] [PubMed] [Google Scholar]
- 31.Wang, M. et al. Correlation study between dual source CT perfusion imaging and the microvascular composition of solitary pulmonary nodules. Lung Cancer130, 115–120. 10.1016/j.lungcan.2019.02.013 (2019). 10.1016/j.lungcan.2019.02.013 [DOI] [PubMed] [Google Scholar]
- 32.Shan, F. et al. Differentiation between malignant and benign solitary pulmonary nodules: Use of volume first-pass perfusion and combined with routine computed tomography. Eur. J. Radiol.81(11), 3598–3605. 10.1016/j.ejrad.2012.04.003 (2012). 10.1016/j.ejrad.2012.04.003 [DOI] [PubMed] [Google Scholar]
- 33.Shu, S. J., Liu, B. L. & Jiang, H. J. Optimization of the scanning technique and diagnosis of pulmonary nodules with first-pass 64-detector-row perfusion VCT. Clin. Imaging37(2), 256–264. 10.1016/j.clinimag.2012.05.004 (2013). 10.1016/j.clinimag.2012.05.004 [DOI] [PubMed] [Google Scholar]
- 34.Marin, A. et al. Can dynamic imaging, using 18F-FDG PET/CT and CT perfusion differentiate between benign and malignant pulmonary nodules?. Radiol. Oncol.55(3), 259–267. 10.2478/raon-2021-0024 (2021). 10.2478/raon-2021-0024 [DOI] [PMC free article] [PubMed] [Google Scholar]
- 35.Spira, D. et al. Assessment of tumor vascularity in lung cancer using volume perfusion CT (VPCT) with histopathologic comparison: A further step toward an individualized tumor characterization. J. Comput. Assist. Tomogr.37(1), 15–21. 10.1097/RCT.0b013e318277c84f (2013). 10.1097/RCT.0b013e318277c84f [DOI] [PubMed] [Google Scholar]
- 36.Li, Y. et al. Peripheral lung carcinoma: Correlation of angiogenesis and first-pass perfusion parameters of 64-detector row CT. Lung Cancer61(1), 44–53. 10.1016/j.lungcan.2007.10.021 (2008). 10.1016/j.lungcan.2007.10.021 [DOI] [PubMed] [Google Scholar]
- 37.Ma, S. H. et al. Peripheral pulmonary nodules: relationship between multi-slice spiral CT perfusion imaging and tumor angiogenesis and VEGF expression. BMC Cancer30(8), 186. 10.1186/1471-2407-8-186 (2008). 10.1186/1471-2407-8-186 [DOI] [PMC free article] [PubMed] [Google Scholar]
- 38.Gullino, P. M. Angiogenesis and neoplasia. N. Engl. J. Med.305, 884–885 (1981). 10.1056/NEJM198110083051508 [DOI] [PubMed] [Google Scholar]
- 39.Peters, A. A. et al. Quantitative CT analysis of lung parenchyma to improve malignancy risk estimation in incidental pulmonary nodules. Eur. Radiol.33(6), 3908–3917. 10.1007/s00330-022-09334-w (2023). 10.1007/s00330-022-09334-w [DOI] [PMC free article] [PubMed] [Google Scholar]
Associated Data
This section collects any data citations, data availability statements, or supplementary materials included in this article.
Supplementary Materials
Data Availability Statement
The datasets generated during and analysed during the current study are available from the corresponding author on reasonable request.