

Abstract

COVID-19 vaccines have been provided to the general public to build immunity since the 2019 coronavirus pandemic. Once vaccinated, SARS-CoV-2 neutralizing antibodies (NAbs-COVID-19) are needed for excellent protection against COVID-19. However, monitoring NAbs-COVID-19 is complicated and requires hospital visits. Moreover, the resulting NAbs-COVID-19 are effective against different strains of COVID-19 depending on the type of vaccine received. Here, an overlaid lateral flow immunoassay (O-LFIA) was developed for the simultaneous detection of two NAbs-COVID-19 against different virus strains, Delta and Omicron. The O-LFIA was visualized with two T-lines with a single device using competition between the free antigen and the antigen-binding antibody. Angiotensin-converting enzyme 2 (ACE2) immobilized on the T-line binds to the antigen remaining after antibody binding. Under the optimum conditions, the proposed device exhibited 50% inhibition concentrations (IC50 values) of 45.1 and 53.6 ng/mL for the Delta and Omicron variants, respectively. Additionally, the proposed platform was applied to real-world samples of animal and human serum, and the developed immunoassay provided results that were in good agreement with those obtained with the standard method. In conclusion, this developed O-LFIA can be used as an alternative method to detect NAbs-COVID-19 and can be enabled for future advancements toward commercialization.
1. Introduction
In 2019, the novel coronavirus disease 2019 spread rapidly across the globe,1,2 causing severe harm to human health and the global economy.3 The World Health Organization (WHO) has noted that the current situation is returning to normal due to advances in developing innovative diagnostics, medicines, and vaccine production to prevent COVID-19.4 However, ongoing reports of COVID-19 infections remain among the world’s people, and there are many different strains of SARS-CoV-2.5,6 Therefore, vaccine-induced immunity to prevent COVID-19 infection is very important so that people can return to normal life.7,8 Even so, scientists and vaccine development organizations remain concerned about the effectiveness of vaccines that can generate SARS-CoV-2 neutralizing antibodies (NAbs-COVID-19) against COVID-19.9−11 Therefore, it is necessary to assess the efficacy of the vaccines among all vaccinated persons to ensure immunity against COVID-19.
The neutralization test (NT) has been used as the gold standard method12,13 for evaluating vaccines based on the principle that neutralizing antibodies are the main molecules capable of inhibiting virus binding to host cells.14 Additionally, improvements to the NT assay have been made to address the shortcomings of the NT in terms of long test times and low throughput. The chemiluminescence reduced neutralization test (CRNT)15 and fluorescence neutralization test (FNT)16 were also developed for antibody detection, and they demonstrated advantages over traditional methods in terms of high throughput and detection sensitivity. However, these NT methods require a level 2–3 biosafety laboratory and live viruses and cells. The enzyme-linked immunosorbent assay (ELISA) could be an alternative method for assessing neutralizing antibodies in people receiving COVID-19 vaccines.17 They use the principle of blocking neutralizing antibodies and the receptor binding domain (RBD), thereby inhibiting the binding between RBD and angiotensin-converting enzyme 2 (ACE2).18,19 Unfortunately, this method takes more than 1 h for antibody assessment and also requires the expertise of operators. Therefore, devices that are easy to use and rapidly produce results have attracted attention for neutralizing antibody assays.
Currently, lateral flow immunoassays (LFIAs) have played a significant role during the COVID-19 epidemic.20 They can be used for COVID-19 infection screening and also be used for antibody detection because they are easy to use and affordable.21,22 Recently, LFIAs have been demonstrated for detecting NAbs-COVID-19 and can precisely quantify NAbs-COVID-19 levels in clinical serum samples.23−25 The detection principle relies on the use of immobilized ACE2 on the T-line, which binds with the free RBD from NAbs–RBD complex.26 However, this sensor cannot indicate the efficacy of the NAb-COVID-19 against multiple strains due to its use of a single RBD. Currently, all over the world, COVID-19 infection occurs from exposure to various strains of COVID-19. Therefore, sensors that can determine the efficacy of NAbs-COVID-19 against multiple COVID-19 variants pose a considerable challenge.
Although LFIAs can be applied for the simultaneous diagnosis of multiple diseases, designed with multiple T-lines on single27,28 or separate strip tests,29,30 the use of different biological materials on the test line remains essential for detecting different target analytes. Therefore, a notable aspect of developing a sensor for NAb-COVID-19 detection across multiple strains involves creating LFIAs that utilize different strains of RBD while still employing the same type of T-line, specifically ACE2.
Here, an overlaid lateral flow immunoassay (O-LFIA) was designed for the first time for the simultaneous detection of NAbs-COVID-19 against two strains of COVID-19 (the Delta and the Omicron variants were used in this research as models). The O-LFIA device demonstrates the ability to separate conjugate species while still using the same T-line on a single device, indicating the ease of single-step analysis and a low sample volume. The device is designed with two layers, each showing a test line (T-line) that captures the RBD of COVID-19 (T-line = ACE2). Both layers consist of a conjugate pad with a different RBD species: an upper layer Delta-RBD (ΔRBD) and a lower layer Omicron-RBD (oRBD). The outstanding performance of this device has been demonstrated. Finally, this device was applied to detect antibodies in monkey serum and primary human serum after administration of the COVID-19 vaccine, and the performance was compared with that of the microneutralization assay (MN50 titer)31 and ELISA test kit.32
2. Materials and methods
2.1. Materials, Equipment, and Chemicals
Details of the materials, equipment, and chemicals are presented in the Supporting Information.
2.2. Conjugation of the RBD with AuNPs (RBD/AuNPs)
This section discusses the process of AuNP conjugation with the RBD. Conjugated ΔRBD/AuNPs and oRBD/AuNPs were used in this work to detect NAbs-COVID-19 against both the Delta and Omicron strains, respectively. Both conjugates were prepared by the same process, which is briefly described as follows. The pH of the 20 nm AuNPs was adjusted to 7.5 with 0.1 M K2CO3 buffer. Ten microliters of 200 μg/mL RBD (the optimum concentration, as shown in Figure S2) was added to 1 mL of 20 nm AuNPs at pH 7.5. Next, following 30 min of continuous stirring, 100 μL of 3% BSA was added to the mixture. The mixture was then centrifuged at 12,000 rpm for 30 min. The supernatant was removed. To obtain the RBD/AuNPs, the pellet was resuspended using 100 μL of BSA solution (3 wt %/v in PBS). For the control line (C-line), antimouse IgG conjugated with AuNPs was used. The C-line is essential in the test strip to evaluate the device’s usability.24 In this work, goat antimouse IgG was immobilized on the C-line, where the binding between the antimouse IgG/AuNPs and goat antimouse IgG caused the appearance of the C-line. The method of conjugation was the same as that for RBD conjugation, using 0.5 mg/mL of antimouse IgG instead of RBD.
2.3. Design and Preparation of the O-LFIA Strip
This design combines two test strips in a single device to use a small sample volume but still detects both NAbs-COVID-19. The concave LFIA design was applied to the O-LFIA device, where the two LFIAs were both cut concave in different directions; the lower layer was concave to the left half of the strip, and the upper layer was concave to the right half of the strip, as shown in Figure 1A. Figure S1 presents the details of the LFIA scale.
Figure 1.

Schematic of the O-LFIA in each layer and photographs of the O-LFIAs with plastic cassettes for detecting the Delta and the Omicron NAbs-COVID-19 (A) and the immobilized biomaterial on the O-LFIA (B). LFIA positive (C) and negative (D) results when detecting Delta and Omicron NAbs-COVID-19.
The composition of the O-LFIAs, as depicted in Figure 1A, comprises several layers, each consisting of a sample pad, conjugate pad, mixing pad, nitrocellulose membrane, and absorbent pad. Notably, the upper layer has a shorter sample pad, facilitating sample flow across both layers (Figure 1A). This upper layer is specifically designed to detect antibodies against the SARS-CoV-2 Delta variant (ΔNAbs). To achieve this, ΔRBD/AuNPs are immobilized on the conjugate pad, enabling specific binding to ΔNAbs. Additionally, the concave region of its nitrocellulose membrane is coated with ACE2, which captures any unbound ΔRBD/AuNPs hindered by NAb inhibition. Moreover, goat antimouse IgG, used as the control line (C-line), is immobilized on the nitrocellulose membrane. Alongside this, antimouse IgG/AuNPs are dispensed with ΔRBD/AuNPs on the upper conjugate pad to visualize the C-line.
For the lower layer, which targets antibodies against the SARS-CoV-2 Omicron variant (oNAbs), a similar approach is employed but with oRBD/AuNPs instead of ΔRBD/AuNPs (as shown in Figure 1B). The application of both RBD-AuNPs (plus antimouse IgG/AuNPs) to the conjugate pad is uniform, executed at a flow rate of 20 μL/cm using a Biodot xyz32100047 dispenser. In terms of the T-line, ACE2 is manually spotted at an optimized concentration of 200 μg/mL on the nitrocellulose membrane’s concave test zone for both layers. The control line on the upper layer involves dispensing goat antimouse IgG at a concentration of 0.5 mg/mL at a flow rate of 2 μL/cm using the same dispenser. After printing or spotting, the test strips are incubated at 37 °C for 1 h in an oven. Finally, upon completion of the individual layers, they are overlaid and encased within a plastic cassette, as illustrated in Figure 1A.
2.4. Detection Procedures
For the O-LFIA NAb-COVID-19 measurements, 20 μL of standard NAb-COVID-19 solution or serum and 80 μL of running buffer comprising 10 mM phosphate-buffered saline (PBS) and 0.1% Tween 20 were placed onto a sample pad. After 15 min, the manual shot application on a smartphone was used to take a picture of the LFIA test zone inside a home-controlled lightbox with a moving strip tray. The ImageJ program was then used to evaluate the color intensity of the test spots.
2.5. Study of NAbs-COVID-19 before and after Vaccination of Monkeys Using O-LFIA
The vaccine effectiveness was examined before and after vaccination using an O-LFIA versus microneutralization (MN) assay. Monkeys were used in a preliminary study of an mRNA vaccine. Monkey serum samples were approved by the Ethics Committee on Animal Husbandry and Production of Animals for Scientific Purposes of Chulalongkorn University (Animal Use Protocol No: 2075009). Monkey serum was collected on the 1st day (D0) before the first vaccine dose. After 30 days (day D30), monkey serum was collected again. Finally, monkeys were given a booster dose, and after an additional 30 days (D60), monkey serum was collected. For NAb-COVID-19 detection using the O-LFIA, monkey serum was diluted 1:10 with running buffer. After that, the sample solution was dropped onto an O-LFIA device. After 15 min, the results were read by taking a picture with a smartphone, and the color intensity was measured with the software program.
2.6. Detection of NAbs-COVID-19 in Serum of Volunteers Using O-LFIA
In addition, this device was applied for determining the inhibition of human serum antibodies, and the results were compared with those from the ELISA test kit. The use of human serum samples was approved by the Human Research Ethics Review Board of the Faculty of Medicine, Chulalongkorn University (IRB No. 242/63). Twenty-one serum samples were from volunteers who had received two doses of different types of vaccines at different lengths of time after vaccination. To monitor vaccine efficacy from the vaccinated volunteers, volunteer blood samples were centrifuged to obtain serum. Then, the serum samples were diluted 1:10 with buffer, and the diluted samples were applied to the test strip. These solutions continuously flowed through both layers. After 15 min, images were recorded with a smartphone, and the color intensity was determined.
3. Results and Discussion
3.1. Design and Detection Principle of the O-LFIA
In general, LFIAs are applied for various applications such as in medical devices, food safety assessments, and environmental evaluations. A typical LFIA has only one level, an assigned T-line, and a C-line on the device with possibly more than one T-line for simultaneously detecting multiple analytes. Creating LFIAs that require different conjugates is challenging. Therefore, in this work, two layers of conjugates were designed to separate the reported molecules to enable the simultaneous detection of two analytes. Each layer of the O-LFIA was made into a concave shape with a paper puncher with the concave layers arranged in opposite directions; the upper concave layer was on the left, and the lower concave layer was on the right. When the two strips overlap, the concavity will also have the benefit of being able to visualize the lower layer’s T-line. Moreover, the concavity of the test strip also allows compression of the immunocomplexes to preconcentrate the analytes, enhancing the detection sensitivity. Initially, the rheological behavior was studied using food coloring to represent the rheology in each layer of the O-LFIA. Red and blue food coloring were dropped onto the upper and lower conjugate pads. The test results taken at 10 s showed that red and blue flowed simultaneously, and both colors were displayed on the device, as shown in Figure 2A and Video S1. When the two colors flowed to the absorbent pad, the flow was uniform, and the two layers did not mix. Thus, it was concluded that the O-LFIA had been successfully designed to separate the flow of both layers and allow for clear coloration of both layers. Additionally, the flow behavior of the O-LFIA for NAbs-COVID-19 detection was analyzed by examining the distribution of RBD/AuNPs, as indicated by the C-lines formed on both layers. Video S2 demonstrates that the flow and distribution of RBD/AuNPs exhibit similar characteristics in both the separated and overlapping layers. Notably, the occurrence of C-lines on both layers of the O-LFIA, in cases of both separated and overlapping layers, showed that the bands on the lower and upper layers were distinct and sharp. This observation indicates that the distribution of RBD/AuNPs across the two layers does not differ significantly, even when the test strips are overlapped, as depicted in Figure S3.
Figure 2.

Flow behavior of the O-LFIA using food coloring at different times (A). UV–Vis spectra of AuNPs and RBD/AuNPs (inset; TEM image of AuNPs) (B). Response after simultaneous detection of two variants of NAbs-COVID-19 using the O-LFIA at concentrations of 0–200 ng/mL (C). Color intensity comparison at concentrations of 0 (left), 50 (middle), and 200 (right) ng/mL for the detection of two variants of NAbs-COVID-19 (D) (n = 3).
3.2. Characterization of the RBD-AuNPs and O-LFIA Device
The characterization results after conjugation of the RBD with AuNPs are shown as UV–vis spectra in Figure 2B. AuNPs were found to have a peak at 538 nm and uniform particles (20 nm), as shown in the inset of the TEM image (inset in Figure 2B). This peak in the RBD/AuNPs spectrum displayed a blue shift (542 nm), which indicates that the particle is covered with protein. It was thus concluded that AuNPs and RBD were conjugated successfully.
The O-LFIA, designed for the simultaneous detection of neutralizing antibodies (NAbs) against two COVID-19 virus strains, operates on the principle that NAbs inhibit the binding between the RBD/AuNPs and ACE2 complex. Initially, NAbs interact with RBD/AuNPs on the conjugate pad, forming a complex that progresses toward the adsorbent pad. Subsequently, any RBD/AuNPs that do not react with NAbs bind to ACE2 at the T-line, producing a red spot. Intriguingly, the intensity of this red color is inversely proportional to the NAb level: a higher NAb concentration results in a lower red color intensity. For instance, in cases with ineffective antibodies or the absence of NAbs, RBD/AuNPs migrate to the T-line due to the action of the running buffer. This migration results in a colored T-line, indicative of a negative result (as depicted in Figure 2C, left). Conversely, with an abundance of effective NAbs (e.g., 200 ng/mL), these NAbs bind strongly with RBD/AuNPs, leaving none to bind with ACE2 at the T-line, leading to color disappearance, indicative of a positive result (as shown in Figure 2C, right). If small amounts of NAbs are present, some RBD/AuNPs will remain to bind with ACE2, producing a pale red color (Figure 2C, middle). Using an overlaid design, this study enables the simultaneous visualization of positive results for NAb-COVID-19 against Delta or Omicron strains on different layers. Image capture and color intensity analysis were conducted, employing eq 1:
| 1 |
where Intensitycontrol is the intensity of the color in the absence of NAb-COVID-19 and Intensitysample is the intensity of the color when the NAb-COVID-19 was detected in the sample. Figure 2D illustrates that the change in color intensity (ΔIntensity) increases with rising NAb-COVID-19 concentration. Furthermore, it was found that NAb-COVID-19 against the Omicron strains was less sensitive than that against the Delta strains. These results are in line with reports that COVID-19 Omicron strains can spread rapidly because they are difficult to inactivate with NAbs-COVID-19.33−35 Therefore, this device can be applied to detect ΔNAbs and oNAbs simultaneously.
3.3. O-LFIA Optimization
This section describes the optimization of the O-LFIA device parameters for the detection of NAbs-COVID-19, including the ACE2 concentration, volume of RBD-AuNPs, and detection time. Figure S4 describes the study of the various parameters. The optimal NAb-COVID-19 detection results were determined based on ΔIntensity, and the optimal parameters were determined to be an ACE2 concentration of 200 μg/mL, an RBD-AuNP content of 4.0 μL, and a detection time of 15 min. Each parameter is described in more detail in the following sections.
3.3.1. ACE2 Concentration on the T-Line
ACE2 concentration is an important factor affecting both Intensitycontrol and Intensitysample. Therefore, the T-line was used to determine the optimal concentration of ACE2 by dropping ACE2 at various concentrations ranging from 50 to 500 μg/mL. The findings revealed that as the ACE2 concentration increased, the color intensity of the spot on the T-line also increased, demonstrating that ACE2 could bind to the T-line very strongly. However, the higher the concentration of ACE2 (from 300–500 μg/mL) (Figure S4A), the higher the Intensitycontrol and the lower the ΔIntensity. Therefore, the optimal ACE2 concentration is 200 μg/mL.
3.3.2. Volume of RBD/AuNPs
The volume of the RBD/AuNPs on the conjugate pad influenced the disappearance of the spots. The residual volume of RBD/AuNPs that bound to ACE2 at the T-line was examined, as a high volume results in a low percent inhibition. Therefore, we investigated the RBD-AuNP volumes on the conjugate pad at various volumes (3, 4, 5, 7, and 9 μL). To achieve the best color contrast, it was discovered that a volume of 4 μL was optimal. As a result, the chosen volumes employed in a single test strip were 4 μL of ΔRBD/AuNPs and 4 μL of oRBD/AuNPs for the upper and lower layers, respectively, as shown in Figure S4B.
3.3.3. Detection Time of the O-LFIA
Normally, the measurement time impacts the chemicals used in immunoassays. In this study, photos were taken with a smartphone and processed to determine the color intensity. Due to the continuous flow of AuNPs, it was observed that between 2 and 15 min, the intensity increased with time, as shown in Figure S4C. The spot color intensity increased when NAbs-COVID-19 were absent. The difference in intensity gradually increases as the NAb-COVID-19 concentration in the sample increases. The difference in intensity continued to drop after 20–30 min, probably due to the full flow of the solution and drying. Therefore, for this study, the detection time was 15 min.
3.4. Analytical Performance
The analytical efficacy of the O-LFIA device was studied in this section, starting with the study of NAb-COVID-19 concentrations capable of 100% inhibition of RBD/AuNPs. NAb-COVID-19 concentrations ranging from 0 to 1000 ng/mL were studied. It was found that 1000 ng/mL NAbs-COVID-19 inhibited 100% of the RBD. Then, simulations were performed to study the titer of NAb-COVID-19 inhibition by diluting the 100% NAb-COVID-19 inhibition solution (1000 ng/mL) by dilution starting from 1:10 to 1:2560. Figure 3A shows a photograph of the device where it was found that the T-lines on both layers became more clearly observable with increasing dilution. That indicated less inhibition as the NAb-COVID-19 solution became further diluted. The % inhibition was reported for this study using eq 2:
| 2 |
where % Inhibition is the percent inhibition of NAb-COVID-19, Icontrol is the color intensity of the control in the absence of NAb-COVID-19, Isample is the color intensity of the sample, and I100% inhibition is the color intensity of the NAb-COVID-19 that is 100% inhibited. Thus, the correlation between the calculated % inhibition and the logarithmic dilutions of ΔNAb and oNAb were established, and it was determined that the 50% inhibition concentration (IC50) dilutions were 1:200 and 1:250, respectively (Figure 3B,C). In addition, a linear correlation between inhibition and NAb-COVID-19 concentration was found when converting the dilution to the concentration, and it was determined that the detection range of ΔNAb and oNAb was 7.8–250 ng/mL (inset, Figure 3B,C), and the IC50 values of ΔNAb and oNAb were 45.1 and 53.6 ng/mL, respectively. Therefore, this device showed excellent analytical performance compared with previous methods. The outstanding advantages of this device are the simultaneous detection of two NAbs-COVID-19 from different virus strains, the ease of processing, the low cost, the short analysis time, and no need for high biosafety laboratories as with previous research, as shown in Table 1. However, Figure 3A reveals inconsistencies in sensor preparation, evident in the appearance of the T-line and the concavity of the O-LFIA. The manual method of preparing the T-line makes it challenging to ensure repeatability and uniformity in cutting from one device to another. To address this issue and facilitate upscale production, we propose the use of an automated system, such as a NanoDrop instrument (AD1520 Aspirate AD1520 Aspirate Dispense System),36 for creating the T-line. This machine can precisely control the volume and position of each drop. Additionally, for achieving consistent concavity in the test strips, laser cutting37 is considered an alternative, offering better control over cutting quality.
Figure 3.
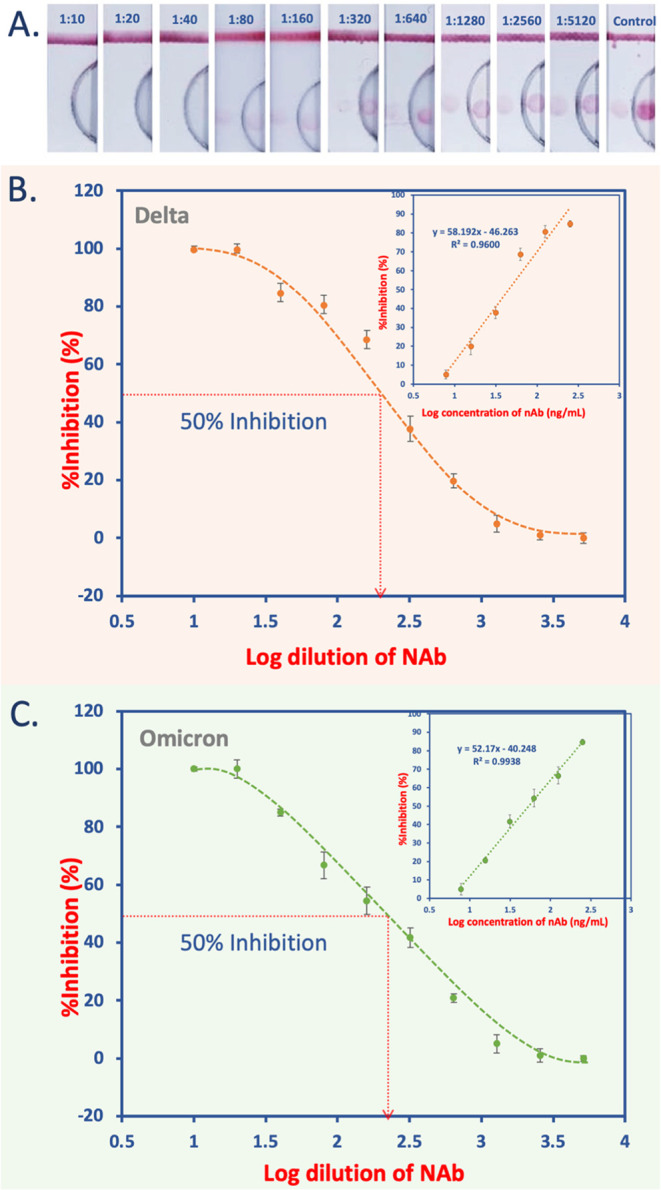
Photographs of the O-LFIA responses with different dilutions of Delta and Omicron NAbs-COVID-19 (A). The relationship between % inhibition and different dilutions of ΔNAbs (B) and oNAbs (C). The linear relationship between % inhibition and ΔNAb (inset B) and oNAb (inset C) is also shown (n = 3).
Table 1. Comparison of Previous Methods with the O-LFIA Device for NAb-COVID-19 Detectiona.
| ability
to detect Nabs-COVID-19 |
|||||||
|---|---|---|---|---|---|---|---|
| NAb test | assay time | single strain | multiple strains | dilution ratio at IC50 | LOD (ng/mL) | biosafety level | ref. |
| pseudovirus-based neutralization test | 50–64 h | √ | 1:150 | 2 | (38) | ||
| plaque reduction neutralization test (PRNT) | 2 days | √ | 1:3200 | 3 | (39) | ||
| microneutralization test (micro-NT) | 72 h | √ | 1:80 | 3 | (40) | ||
| ELISA | 1.5 h | √ | 1:40 | 1 | (41) | ||
| PDA-based LFIA | 20 min | √ | 160 | 0–1 | (42) | ||
| FBs-LFIA | 20 min | √ | 1.13 | 0–1 | (43) | ||
| NIR-LFA | 15 min | √ | 630 | 0–1 | (44) | ||
| trimode LFIA | 15 min | √ | 20 | 0–1 | (45) | ||
| O-LFIA | 15 min | √ | 0–1 | this work | |||
| Delta | 1:200 | 45.1 | |||||
| Omicron | 1:250 | 53.6 | |||||
IC50 = 50% inhibition concentration. PDA-based LFIA = polydopamine nanoparticle (PDA)-based lateral flow immunoassay (LFIA). FBs-LFIA = fluorescent beads-based lateral flow immunoassay. NIR-LFA = Nd3+/Yb3+ codoped near-infrared lateral flow assays. O-LFIA = Overlaid lateral flow immunoassay.
Other efficacy studies of the test strips were further conducted, including cross-reactivity, repeatability, and stability. As part of the cross-reactivity study using O-LFIA, other potential antibodies found in serum samples, such as anti-HBsAg, anti-HCV, anti-EBV, anti-Rubella, and anti-CMV, and five healthy serum samples (collected before 2019), were studied. The test results showed that this test strip is noncross-reactive (Figure S5), allowing it to be used with real serum samples. The developed test strip was used to detect ΔNAbs (100 ng/mL) and oNAbs (100 ng/mL), which showed similar intensity values in the reproducibility study (n = 10). The % relative standard deviation (%RSD) was calculated to be 5.1–7.2%, which is acceptable in analytical chemistry. For the stability study, the O-LFIA was manufactured and packaged in a light cover pack and stored in a 4 °C refrigerator. The O-LFIA was then tested weekly for ΔNAb and oNAb detection. At the 30th week, the color intensity of the T-line decreased to 80%, so the O-LFIA was stable for approximately 29 weeks or approximately 6 months, which is sufficient for use. Therefore, from the study of the efficiency of this test strip, it was determined to be an acceptable device that can be used to detect NAbs-COVID-19 against the Delta and the Omicron strains.
3.5. Applications of the O-LFIA
3.5.1. Animal Serum
The applications of this O-LFIA for pre- and postvaccination efficacy monitoring were tested. This research collected serum samples from experimental animals (monkeys) before vaccination, known as D0 samples. Next, after an mRNA-type vaccine was given to the monkeys, a serum sample was collected 30 days after vaccination, called the D30 samples. Subsequently, a second dose of vaccine was given to the same monkeys, and serum samples were collected again on day 30 after the second dose of vaccine, known as the D60 samples. The total number of monkeys studied was three. The test strip was applied by dropping a serum sample diluted 1:10 onto it. After 15 min, the results were recorded, and the % inhibition of NAb-COVID-19 was calculated. The test strip results were consistent with those from the MN50 assay (this detection method is described in Section S2), and no NAbs-COVID-19 were detected in the D0 samples (Figure 4A). After COVID-19 vaccination, the D30 samples showed the presence of produced antibodies by the O-LFIA, which were found to inhibit NAbs-COVID-19 in the range 43–94% for the Delta variant and 10–19% for the Omicron variant. These results were consistent with those from the MN50 method, which showed a moderate titer after the first vaccine dose (Figure 4B). After the monkeys received the booster dose (D60), it was found that the % inhibition and titer of NAbs-COVID-19 were higher using the O-LFIA method than using the MN50 method (Figure 4C). Therefore, we offer a tool to assess vaccine efficacy.
Figure 4.

Evaluation of vaccine effectiveness in monkey serum at days 0 (D0), 30 (D30), and 60 (D60) using the O-LFIA and microneutralization assay (MN50 titer).
3.5.2. Human Serum
The test strip developed for detecting NAbs-COVID-19 was applied to the serum of volunteers using the device, and the assay procedure is illustrated in Figure 5A. The SARS-CoV-2 surrogate virus neutralization test (sVNT for Delta-NAb-COVID-19 detection is described in Section S3) results and those from the developed device are reported as % inhibition of NAbs-COVID-19, as shown in Figure 5B,C, respectively. Once the test results were obtained, correlation analysis was performed between the two techniques to determine their ability to detect Delta-NAbs-COVID-19. A linear relationship was found, and the slope of the fitting line was close to 146 (Figure 5D), meaning that the two methods yielded consistent results. Therefore, this device can be an alternative medical device to accurately, quickly, and easily evaluate vaccine efficacy. In addition and more importantly, this device can excellently and simultaneously detect NAbs-COVID-19 against two virus strains.
Figure 5.

Schematic diagram of the NAb-COVID-19 O-LFIA procedure (A), vaccine effectiveness determined with human serum using an ELISA test kit (B) and the O-LFIA (C), and correlation analysis for estimating the % inhibition of NAbs-COVID-19 at different NAb-COVID-19 levels using an ELISA test kit and the O-LFIA device (D).
4. Conclusions
In this work, an overlaid lateral flow immunoassay (O-LFIA) was designed for the first time to detect two variant-specific SARS-CoV-2 neutralizing antibodies simultaneously. This design not only separates the T-lines on different layers of the device but also increases the detection sensitivity due to the concave design. NAbs-COVID-19 against the Delta and Omicron variants were used as models to demonstrate the device’s performance. Under the optimal conditions, the 50% inhibition of ΔNAb and oNAb titers was found to be 1:200 and 1:250, and the 50% inhibition concentrations of ΔNAb and oNAb were shown to be 45.1 and 53.6 ng/mL, respectively. In addition, vaccine efficacy assessments in experimental animals were performed using this sensor, which showed very satisfactory results in terms of NAb-COVID-19 detection that were consistent with the MN50 assay. Finally, the O-LFIA device was also used for evaluating vaccine efficacy in human sera, the results of which agreed with those of the ELISA kit. Therefore, the O-LFIA is a prototype device that can be used in applications that require multianalyte evaluation that allows quick analysis, is inexpensive, and is easy to operate.
Acknowledgments
This research project was supported by the National Research Council of Thailand (N35A640018). Furthermore, this project was funded by the Second Century Fund (C2F), Chulalongkorn University. S.C. would like to thank the Thailand Science Research and Innovation Fund Chulalongkorn University for partially funding this research. For the authentic samples, the authors of this project thank Prof. Dr. Kiat Ruxrungtham and Assoc. Prof. Dr. Chutitorn Ketloy, who participated in the research by giving samples of monkey blood, as approved by the Ethics Committee on Animal Husbandry and Production of Animals for Scientific Purposes of Chulalongkorn University (Animal Use Protocol No. 2075009). The authors would like to thank Prof. Dr. Nattiya Hirankarn for the human samples obtained from the Human Research Ethics Review Board of the Faculty of Medicine, Chulalongkorn University (IRB No. 242/63).
Supporting Information Available
The Supporting Information is available free of charge at https://pubs.acs.org/doi/10.1021/acs.analchem.3c05144.
Materials, equipment, and chemicals; microneutralization assay; surrogate virus neutralization test (sVNT); components and dimensions of O-LFIAs, the relationship between absorbance at wavelength 525 nm and concentration of ΔRBD and oRBD; flow behavior of the O-LFIA; optimization of variable parameters; and cross-reactivity studies. (PDF)
Video of the O-LFIA flow behavior using food coloring at different times (Video S1) (MOV)
Flow and distribution of RBD/AuNPs exhibiting similar characteristics in both separated and overlapping layers (Video S2) (MP4)
The authors declare no competing financial interest.
Supplementary Material
References
- Guan W.-j.; Ni Z.-y.; Hu Y.; Liang W.-h.; Ou C.-q.; He J.-x.; Liu L.; Shan H.; Lei C.-l.; Hui D. S. C.; et al. Clinical Characteristics of Coronavirus Disease 2019 in China. N. Engl. J. Med. 2020, 382 (18), 1708–1720. 10.1056/NEJMoa2002032. [DOI] [PMC free article] [PubMed] [Google Scholar]
- Wu Z.; McGoogan J. M. Characteristics of and Important Lessons from the Coronavirus Disease 2019 (COVID-19) Outbreak in China: Summary of a Report of 72314 Cases from the Chinese Center for Disease Control and Prevention. JAMA 2020, 323 (13), 1239–1242. 10.1001/jama.2020.2648. [DOI] [PubMed] [Google Scholar]
- Yilmazkuday H. Coronavirus disease 2019 and the global economy. Transp. Policy 2022, 120, 40–46. 10.1016/j.tranpol.2022.03.003. [DOI] [PMC free article] [PubMed] [Google Scholar]
- Moazeni M.; Rahimi M.; Ebrahimi A. What are the effects of climate variables on COVID-19 pandemic? A systematic review and current update. Adv. Biomed. Res. 2023, 12 (1), 33. 10.4103/abr.abr_145_21. [DOI] [PMC free article] [PubMed] [Google Scholar]
- Sarkar R.; Mitra S.; Chandra P.; Saha P.; Banerjee A.; Dutta S.; Chawla-Sarkar M. Comprehensive analysis of genomic diversity of SARS-CoV-2 in different geographic regions of India: an endeavour to classify Indian SARS-CoV-2 strains on the basis of co-existing mutations. Arch. Virol. 2021, 166 (3), 801–812. 10.1007/s00705-020-04911-0. [DOI] [PMC free article] [PubMed] [Google Scholar]
- Donati S.; Corsi E.; Maraschini A.; Salvatore M. SARS-CoV-2 infection among hospitalised pregnant women and impact of different viral strains on COVID-19 severity in Italy: a national prospective population-based cohort study. Br. J. Obstet. Gynaecol. 2022, 129 (2), 221–231. 10.1111/1471-0528.16980. [DOI] [PMC free article] [PubMed] [Google Scholar]
- Fiolet T.; Kherabi Y.; MacDonald C. J.; Ghosn J.; Peiffer-Smadja N. Comparing COVID-19 vaccines for their characteristics, efficacy and effectiveness against SARS-CoV-2 and variants of concern: a narrative review. Clin. Microbiol. Infect. 2022, 28 (2), 202–221. 10.1016/j.cmi.2021.10.005. [DOI] [PMC free article] [PubMed] [Google Scholar]
- Barrett J. R.; Belij-Rammerstorfer S.; Dold C.; Ewer K. J.; Folegatti P. M.; Gilbride C.; Halkerston R.; Hill J.; Jenkin D.; Stockdale L.; et al. Phase 1/2 trial of SARS-CoV-2 vaccine ChAdOx1 nCoV-19 with a booster dose induces multifunctional antibody responses. Nat. Med. 2021, 27 (2), 279–288. 10.1038/s41591-020-01179-4. [DOI] [PubMed] [Google Scholar]
- Walls A. C.; Fiala B.; Schäfer A.; Wrenn S.; Pham M. N.; Murphy M.; Tse L. V.; Shehata L.; O’Connor M. A.; Chen C.; et al. Elicitation of Potent Neutralizing Antibody Responses by Designed Protein Nanoparticle Vaccines for SARS-CoV-2. Cell 2020, 183 (5), 1367–1382. 10.1016/j.cell.2020.10.043. [DOI] [PMC free article] [PubMed] [Google Scholar]
- McKay P. F.; Hu K.; Blakney A. K.; Samnuan K.; Brown J. C.; Penn R.; Zhou J.; Bouton C. R.; Rogers P.; Polra K.; et al. Self-amplifying RNA SARS-CoV-2 lipid nanoparticle vaccine candidate induces high neutralizing antibody titers in mice. Nat. Commun. 2020, 11 (1), 3523 10.1038/s41467-020-17409-9. [DOI] [PMC free article] [PubMed] [Google Scholar]
- Shen X.; Tang H.; McDanal C.; Wagh K.; Fischer W.; Theiler J.; Yoon H.; Li D.; Haynes B. F.; Sanders K. O.; et al. SARS-CoV-2 variant B.1.1.7 is susceptible to neutralizing antibodies elicited by ancestral spike vaccines. Cell Host Microbe 2021, 29 (4), 529–539. 10.1016/j.chom.2021.03.002. [DOI] [PMC free article] [PubMed] [Google Scholar]
- Vanderheiden A.; Edara V. V.; Floyd K.; Kauffman R. C.; Mantus G.; Anderson E.; Rouphael N.; Edupuganti S.; Shi P. Y.; Menachery V. D.; et al. Development of a Rapid Focus Reduction Neutralization Test Assay for Measuring SARS-CoV-2 Neutralizing Antibodies. Curr. Protoc. Immunol. 2020, 131 (1), e116 10.1002/cpim.116. [DOI] [PMC free article] [PubMed] [Google Scholar]
- Cristiano A.; Pieri M.; Sarubbi S.; Pelagalli M.; Calugi G.; Tomassetti F.; Bernardini S.; Nuccetelli M. Evaluation of serological anti-SARS-CoV-2 chemiluminescent immunoassays correlated to live virus neutralization test, for the detection of anti-RBD antibodies as a relevant alternative in COVID-19 large-scale neutralizing activity monitoring. Clin. Immunol. 2022, 234, 108918. 10.1016/j.clim.2021.108918. [DOI] [PMC free article] [PubMed] [Google Scholar]
- Tan C. W.; Chia W. N.; Qin X.; Liu P.; Chen M. I. C.; Tiu C.; Hu Z.; Chen V. C. W.; Young B. E.; Sia W. R.; et al. A SARS-CoV-2 surrogate virus neutralization test based on antibody-mediated blockage of ACE2–spike protein–protein interaction. Nat. Biotechnol. 2020, 38 (9), 1073–1078. 10.1038/s41587-020-0631-z. [DOI] [PubMed] [Google Scholar]
- Tani H.; Kimura M.; Tan L.; Yoshida Y.; Ozawa T.; Kishi H.; Fukushi S.; Saijo M.; Sano K.; Suzuki T.; et al. Evaluation of SARS-CoV-2 neutralizing antibodies using a vesicular stomatitis virus possessing SARS-CoV-2 spike protein. Virol. J. 2021, 18 (1), 16 10.1186/s12985-021-01490-7. [DOI] [PMC free article] [PubMed] [Google Scholar]
- McLean G. R.; Zhang Y.; Ndoyi R.; Martin A.; Winer J. Rapid Quantification of SARS-CoV-2 Neutralising Antibodies Using Time-Resolved Fluorescence Immunoassay. Vaccines 2022, 10 (12), 2149 10.3390/vaccines10122149. [DOI] [PMC free article] [PubMed] [Google Scholar]
- Kohmer N.; Rühl C.; Ciesek S.; Rabenau H. F. Utility of different surrogate enzyme-linked immunosorbent assays (Selisas) for detection of sars-cov-2 neutralizing antibodies. J. Clin. Med. 2021, 10 (10), 2128 10.3390/jcm10102128. [DOI] [PMC free article] [PubMed] [Google Scholar]
- Filippatos F.; Tatsi E.-B.; Papagiannopoulos C.; Syriopoulou V.; Michos A. Comparison of a rapid fluorescence immunochromatographic test with an enzyme-linked immunosorbent assay for measurement of SARS-CoV-2 spike protein antibody neutralizing activity. J. Virol. Methods 2023, 316, 114728 10.1016/j.jviromet.2023.114728. [DOI] [PMC free article] [PubMed] [Google Scholar]
- Byrnes J. R.; Zhou X. X.; Lui I.; Elledge S. K.; Glasgow J. E.; Lim S. A.; Loudermilk R. P.; Chiu C. Y.; Wang T. T.; Wilson M. R.; et al. Competitive SARS-CoV-2 serology reveals most antibodies targeting the spike receptor-binding domain compete for ACE2 binding. mSphere 2020, 5 (5), e00802-20 10.1128/mSphere.00802-20. [DOI] [PMC free article] [PubMed] [Google Scholar]
- Ruantip S.; Pimpitak U.; Rengpipat S.; Pasomsub E.; Seepiban C.; Gajanandana O.; Torvorapanit P.; Hirankarn N.; Jaru-ampornpan P.; Siwamogsatham S.; et al. Self-enhancement lateral flow immunoassay for COVID-19 diagnosis. Sens. Actuators, B 2023, 389, 133898. 10.1016/j.snb.2023.133898. [DOI] [PMC free article] [PubMed] [Google Scholar]
- Huang R. L.; Fu Y. C.; Wang Y. C.; Hong C.; Yang W. C.; Wang I. J.; Sun J. R.; Chen Y.; Shen C. F.; Cheng C. M. A Lateral Flow Immunoassay Coupled with a Spectrum-Based Reader for SARS-CoV-2 Neutralizing Antibody Detection. Vaccines 2022, 10 (2), 271 10.3390/vaccines10020271. [DOI] [PMC free article] [PubMed] [Google Scholar]
- Deng H.; Cai X.; Ji Y.; Yan D.; Yang F.; Liu S.; Deji Z.; Wang Y.; Bian Z.; Tang G.; et al. Development of a lateral flow immunoassay for rapid quantitation of carbendazim in agricultural products. Microchem. J. 2022, 179, 107495 10.1016/j.microc.2022.107495. [DOI] [Google Scholar]
- Li J.; Liu B.; Tang X.; Wu Z.; Lu J.; Liang C.; Hou S.; Zhang L.; Li T.; Zhao W.; et al. Development of a smartphone-based quantum dot lateral flow immunoassay strip for ultrasensitive detection of anti-SARS-CoV-2 IgG and neutralizing antibodies. Int. J. Infect. Dis. 2022, 121, 58–65. 10.1016/j.ijid.2022.04.042. [DOI] [PMC free article] [PubMed] [Google Scholar]
- Lake D. F.; Roeder A. J.; Gonzalez-Moa M. J.; Koehler M.; Kaleta E.; Jasbi P.; Vanderhoof J.; McKechnie D.; Forman J.; Edwards B. A.; et al. Third COVID-19 vaccine dose boosts neutralizing antibodies in poor responders. Commun. Med. 2022, 2 (1), 85. 10.1038/s43856-022-00151-2. [DOI] [PMC free article] [PubMed] [Google Scholar]
- Lake D. F.; Roeder A. J.; Kaleta E.; Jasbi P.; Pfeffer K.; Koelbela C.; Periasamy S.; Kuzmina N.; Bukreyev A.; Grys T. E. Development of a rapid point-of-care test that measures neutralizing antibodies to SARS-CoV-2. J. Clin. Virol. 2021, 145, 105024 10.1016/j.jcv.2021.105024. [DOI] [PMC free article] [PubMed] [Google Scholar]
- Connelly G. G.; Kirkland O. O.; Bohannon S.; Lim D. C.; Wilson R. M.; Richards E. J.; Tay D. M.; Jee H.; Hellinger R. D.; Hoang N. K.; et al. Direct capture of neutralized RBD enables rapid point-of-care assessment of SARS-CoV-2 neutralizing antibody titer. Cell Rep. Methods 2022, 2 (8), 100273 10.1016/j.crmeth.2022.100273. [DOI] [PMC free article] [PubMed] [Google Scholar]
- Wang C.; Cheng X.; Liu L.; Zhang X.; Yang X.; Zheng S.; Rong Z.; Wang S. Ultrasensitive and Simultaneous Detection of Two Specific SARS-CoV-2 Antigens in Human Specimens Using Direct/Enrichment Dual-Mode Fluorescence Lateral Flow Immunoassay. ACS Appl. Mater. Interfaces 2021, 13 (34), 40342–40353. 10.1021/acsami.1c11461. [DOI] [PubMed] [Google Scholar]
- Klebes A.; Kittel A.-S.; Verboket R. D.; von Stetten F.; Früh S. M. Multianalyte lateral flow immunoassay for simultaneous detection of protein-based inflammation biomarkers and pathogen DNA. Sens. Actuators, B 2022, 355, 131283 10.1016/j.snb.2021.131283. [DOI] [Google Scholar]
- Zhao Y.; Wang H.; Zhang P.; Sun C.; Wang X.; Wang X.; Yang R.; Wang C.; Zhou L. Rapid multiplex detection of 10 foodborne pathogens with an up-converting phosphor technology-based 10-channel lateral flow assay. Sci. Rep. 2016, 6 (1), 21342 10.1038/srep21342. [DOI] [PMC free article] [PubMed] [Google Scholar]
- Anfossi L.; Di Nardo F.; Cavalera S.; Giovannoli C.; Baggiani C. Multiplex Lateral Flow Immunoassay: An Overview of Strategies towards High-throughput Point-of-Need Testing. Biosensors 2019, 9 (1), 2. 10.3390/bios9010002. [DOI] [PMC free article] [PubMed] [Google Scholar]
- Peletta A.; Prompetchara E.; Tharakhet K.; Kaewpang P.; Buranapraditkun S.; Techawiwattanaboon T.; Jbilou T.; Krangvichian P.; Sirivichayakul S.; Manopwisedjaroen S.; et al. DNA Vaccine Administered by Cationic Lipoplexes or by In Vivo Electroporation Induces Comparable Antibody Responses against SARS-CoV-2 in Mice. Vaccines 2021, 9 (8), 874. 10.3390/vaccines9080874. [DOI] [PMC free article] [PubMed] [Google Scholar]
- Phoka T.; Thanuthanakhun N.; Visitchanakun P.; Dueanphen N.; Wanichwecharungruang N.; Leelahavanichkul A.; Palaga T.; Ruxrungtham K.; Wanichwecharungruang S. Detachable-dissolvable-microneedle as a potent subunit vaccine delivery device that requires no cold-chain. Vaccine: X 2023, 15, 100398 10.1016/j.jvacx.2023.100398. [DOI] [PMC free article] [PubMed] [Google Scholar]
- Barthwal S.; Angel B.; Angel A.; Joshi V.; Shareef B.; Peer N.; Khaneja P.; Khan A.; Sharma B.; Singh N.; et al. Neutralizing possibilities of whole virion and mRNA vaccine triggered antibodies of Wuhan strain of SARS-CoV-2 with receptor binding domains of spike proteins of Delta and Omicron strains. Asian Pac. J. Trop. Med. 2023, 16 (2), 92–94. 10.4103/1995-7645.370152. [DOI] [Google Scholar]
- Li J.; Li X.; Wang E.; Yang J.; Li J.; Huang C.; Zhang Y.; Chen K. Neutralizing Antibodies against the SARS-CoV-2 Delta and Omicron BA.1 following Homologous CoronaVac Booster Vaccination. Vaccines 2022, 10 (12), 2111 10.3390/vaccines10122111. [DOI] [PMC free article] [PubMed] [Google Scholar]
- Linderman S. L.; Lai L.; Bocangel Gamarra E. L.; Lau M. S. Y.; Edupuganti S.; Surie D.; Tenforde M. W.; Chappell J. D.; Mohr N. M.; Gibbs K. W.; et al. Neutralizing antibody responses in patients hospitalized with SARS-CoV-2 Delta or Omicron infection. J. Clin. Invest. 2022, 132 (23), e164303 10.1172/JCI164303. [DOI] [PMC free article] [PubMed] [Google Scholar]
- Hofmann E. R.; Davidson C.; Chen H.; Zacharko M.; Dorton J. E.; Kilper G. K.; Graves C.; Miklos A. E.; Rhea K.; Ma J.; et al. Blind Spot: A Braille Patterned Novel Multiplex Lateral Flow Immunoassay Sensor Array for the Detection of Biothreat Agents. ACS Omega 2021, 6 (35), 22700–22708. 10.1021/acsomega.1c02938. [DOI] [PMC free article] [PubMed] [Google Scholar]
- Deng Y.; Jiang H.; Li X.; Lv X. Recent advances in sensitivity enhancement for lateral flow assay. Mikrochim. Acta 2021, 188 (11), 379. 10.1007/s00604-021-05037-z. [DOI] [PMC free article] [PubMed] [Google Scholar]
- Sun H.; Xu J.; Zhang G.; Han J.; Hao M.; Chen Z.; Fang T.; Chi X.; Yu C. Developing Pseudovirus-Based Neutralization Assay against Omicron-Included SARS-CoV-2 Variants. Viruses 2022, 14 (6), 1332 10.3390/v14061332. [DOI] [PMC free article] [PubMed] [Google Scholar]
- Muruato A. E.; Fontes-Garfias C. R.; Ren P.; Garcia-Blanco M. A.; Menachery V. D.; Xie X.; Shi P. Y. A high-throughput neutralizing antibody assay for COVID-19 diagnosis and vaccine evaluation. Nat. Commun. 2020, 11 (1), 4059 10.1038/s41467-020-17892-0. [DOI] [PMC free article] [PubMed] [Google Scholar]
- Müller K.; Girl P.; von Buttlar H.; Dobler G.; Wölfel R. Comparison of two commercial surrogate ELISAs to detect a neutralising antibody response to SARS-CoV-2. J. Virol. Methods 2021, 292, 114122 10.1016/j.jviromet.2021.114122. [DOI] [PMC free article] [PubMed] [Google Scholar]
- Meyer B.; Reimerink J.; Torriani G.; Brouwer F.; Godeke G. J.; Yerly S.; Hoogerwerf M.; Vuilleumier N.; Kaiser L.; Eckerle I.; et al. Validation and clinical evaluation of a SARS-CoV-2 surrogate virus neutralisation test (sVNT). Emerg. Microbes Infect. 2020, 9 (1), 2394–2403. 10.1080/22221751.2020.1835448. [DOI] [PMC free article] [PubMed] [Google Scholar]
- Tong H.; Cao C.; You M.; Han S.; Liu Z.; Xiao Y.; He W.; Liu C.; Peng P.; Xue Z.; et al. Artificial intelligence-assisted colorimetric lateral flow immunoassay for sensitive and quantitative detection of COVID-19 neutralizing antibody. Biosens. Bioelectron. 2022, 213, 114449 10.1016/j.bios.2022.114449. [DOI] [PMC free article] [PubMed] [Google Scholar]
- Zhang Y.; Chen Y.; He Y.; Li Y.; Zhang X.; Liang J.; He J.; Lu S.; Gao Z.; Xu J.; et al. Development of receptor binding domain-based double-antigen sandwich lateral flow immunoassay for the detection and evaluation of SARS-CoV-2 neutralizing antibody in clinical sera samples compared with the conventional virus neutralization test. Talanta 2023, 255, 124200 10.1016/j.talanta.2022.124200. [DOI] [PMC free article] [PubMed] [Google Scholar]
- Song Q.; Zhao L.; Mai W.; Xia D.; Ding W.; Zhou X.; Deng M.; Lei Y.; Chen L.; Li Y.; et al. Handheld NIR-to-NIR Platform for on-site evaluating protective neutralizing antibody against SARS-CoV-2 ancestral strain and Omicron variant after vaccination or infection. Biosens. Bioelectron. 2023, 234, 115353 10.1016/j.bios.2023.115353. [DOI] [PMC free article] [PubMed] [Google Scholar]
- Zhao T.; Liang P.; Ren J.; Zhu J.; Yang X.; Bian H.; Li J.; Cui X.; Fu C.; Xing J.; et al. Gold-silver alloy hollow nanoshells-based lateral flow immunoassay for colorimetric, photothermal, and SERS tri-mode detection of SARS-CoV-2 neutralizing antibody. Anal. Chim. Acta 2023, 1255, 341102 10.1016/j.aca.2023.341102. [DOI] [PMC free article] [PubMed] [Google Scholar]
- Schober P.; Boer C.; Schwarte L. A. Correlation Coefficients: Appropriate Use and Interpretation. Anesth. Analg. 2018, 126 (5), 1763–1768. 10.1213/ANE.0000000000002864. [DOI] [PubMed] [Google Scholar]
Associated Data
This section collects any data citations, data availability statements, or supplementary materials included in this article.