

Abstract

Prechamber jet ignition is a promising technology that enables stable ignition and fast combustion by combining thermal effects, chemical kinetics, and turbulent disturbance. The development and application of the prechamber ignition require a comprehensive and in-depth understanding of the operating characteristics of the prechamber ignition in the real engine working cycle. Therefore, numerical simulations are conducted to explore the operating performance of the prechamber ignition applied to a large-bore natural gas engine in this study. The differences between the passive prechamber (PPRE) and active prechamber (APRE) near the lean burn limit are compared. The results show that the jet ignition performance of the PPRE is hampered by the high residual gas coefficient and lean mixture in the prechamber under lean burn conditions. The ignition mode of the PPRE is similar to torch ignition, and the combustion process in the main chamber is mainly turbulent flame propagation. The ignition mechanism of the APRE is flame jet ignition. The main chamber combustion process presents a two-stage heat release characteristic, which can be subdivided into three phases: the initial flame development phase, the rapid combustion phase, and the late combustion phase. The heat release rate during the initial flame development phase depends on the physical and chemical properties of the prechamber jet and the mixture conditions in the main chamber. During the rapid combustion phase, the flame propagation along the radial direction of the jet largely depends on the time scale of the chemical reaction. The heat release rate depends on the coverage area of the jet, the jet residual momentum, and the turbulent flame speed. During the late combustion phase, the flame propagation is mainly affected by the turbulent flame speed. These results provide theoretical guidance for the subsequent application of prechamber ignition systems in various powertrains.
1. Introduction
Climate change and energy scarcity are the two major challenges facing our time. They promote the establishment of a new economic model and new technologies in all parts of the world.1 Internal combustion engines (ICEs) are widely used in modern transportation (land, maritime, aviation, and inland waterway vessels), construction machinery, agricultural equipment, and power generation. Research into key technologies to save energy and reduce emissions of ICEs is of great significance for future global energy security and environmental protection.2−11 Prechamber ignition is an advanced ignition technology of ICEs, which is shown to increase combustion efficiency and reduce fuel consumption and emissions.
The prechamber ignition has attracted the attention of researchers and manufacturers of large-bore stationary engines and automotive engines due to its advantages, such as high knock mitigation and the ability to ignite a lean mixture.12−15 This ignition concept uses high-temperature and high-momentum jets as the ignition source.13 Its advantages can be summarized as follows. (1) The prechamber jet generates spatially distributed ignition points in the main chamber, which realizes multipoint ignition of the mixture and effectively shortens the flame propagation distance. (2) The ignition energy of the prechamber jet is much higher than that of the conventional spark plug, which can achieve the reliable ignition of the lean mixture. (3) The prechamber jet is injected into the main chamber at a high velocity, which causes a disturbance effect on the flow field in the main chamber and increases the turbulence kinetic energy, thus accelerating the flame propagation speed.
Due to the benefits summarized above, the prechamber ignition system is believed to have considerable potential to improve engine efficiency, which has been confirmed by previous studies.16,17 Zhao et al.18 studied the combustion characteristics of jet ignition in a gasoline engine. Compared with the spark plug ignition method, the prechamber jet accelerates the combustion speed in the cylinder and then improves the operation stability of the gasoline engine. Stadler et al.19 found the combination of high compression ratio and prechamber jet ignition can improve the thermal efficiency of the gasoline engine. The lean burn limit is extended from λ = 1.4 to λ = 2.0, and the engine combustion thermal efficiency is increased by 5.4%, while the NOx emission is significantly reduced. Payri et al.20 developed a new type of spark ignition engine fueled with CNG and integrating the Miller cycle, together with a high compression ratio and the use of passive prechamber ignition. Compared to a conventional spark ignition engine, the fuel consumption is reduced by about 15%, and CO2 emission is reduced by around 25% in the transient driving cycle simulations. Roso et al.21 found that, compared to stoichiometric combustion with spark plug ignition, a stratified prechamber ignition concept can reduce the CO and NOx emissions in the real world and standardized driving cycles by more than 50% and 85%, respectively. Zhan et al.22 developed an ultralean burn gasoline engine by combining a high compression ratio, an active prechamber, and the Miller cycle. The gross indicated thermal efficiency is up to 51.10% when the compression ratio is 16.4 and the excess air ratio is 2.236. Prechamber jet ignition significantly extended the lean burn limit, and the heat transfer losses were significantly reduced.
For prechamber ignition engines, many factors have great influences on the jet ignition process and engine performance, including the physical and chemical properties of the mixture, prechamber geometry, ignition parameters, combustion chamber shape, engine operating parameters, and so on.23−30 Antolini et al.31 investigated the jet characteristics and combustion in the main chamber with different orifice diameters based on an optically accessible single-cylinder spark engine. In all test conditions, the prechamber with a 1.2 mm orifice diameter had the shortest flame development duration, while the prechamber with a 1.0 mm orifice diameter presented the shortest combustion duration of the main chamber. With the increase in the air-to-fuel ratio, the jet penetration velocity and flame propagation speed decrease. Wu et al.32 investigated the combustion characteristics and emissions of the CH4/NH3 dual-fuel marine engine with a prechamber ignition system. The results showed that the hydrogen concentration in the prechamber increased with the ammonia mixtures, which promoted the formation of jet flame. The prechamber combustion had a “chain effect” on the turbulent kinetic energy in the main chamber and could improve flame propagation at lean burn conditions. Zhou et al.33 studied the combustion characteristics and misfire phenomena of a direct-injection gasoline engine equipped with a passive prechamber. The results showed that the flame quenching can be mitigated by using a heat-insulated prechamber combined with advanced fuel injection timing and advanced ignition timing. Trombley34 reviewed the relevant literature on the prechamber initiated combustion in spark ignition and compression ignition engines. The results pointed out that alternative fuels could be used in prechamber ignition and the emissions could be reduced using high efficiency low-temperature combustion (ultralean or highly diluted). Therefore, more work was conducted to promote the reliable application of the prechamber ignition concept in automotive engines and large-bore gas engines.35−39
A thorough understanding of the basic physics and ignition mechanism of the prechamber jet is the basis and key to developing the prechamber jet ignition technology. More and more of the recent studies are focused on the fundamental understanding and the engineering application of the prechamber ignition system on ICEs. The prechamber jet ignition is a coupled consequence of thermal, chemical reactions, and turbulent mixing. Biswas et al.40 considered that its ignition mechanism can be divided into two types, namely flame ignition and jet ignition. The jet ignition initiates the combustion of the main chamber through the jet composed of hot combustion products, and the flame ignition uses the jet of wrinkled turbulent flames. The flame jet is more effective than the jet ignition in igniting lean mixture because the intermediate species OH, CH2O, and HO2 of combustion reactions contribute to the rapid ignition of the combustible mixture and stable flame propagation.41,42 The ignition mechanism is affected by the geometry and mixture conditions of the prechamber, such as the prechamber volume, the orifice diameter, and the mixture equivalence ratio within the prechamber.43 In order to develop prechamber systems for commercial spark engines, the effect of the prechamber geometry and engine operating conditions on the combustion and prechamber jet characteristics should be extensively studied.44,45 Tian et al.46 studied the ignition and combustion processes of the prechamber ignition system based on a constant volume chamber using optical diagnostics. Different orifice diameters will cause different ignition modes, and then the combustion process in the main chamber will change accordingly. Hua et al.47 pointed out that the injection timing of the active prechamber would affect the mixing of fuel and air in the prechamber. It should be controlled well to obtain a well-mixed stoichiometric mixture and optimal engine performance. IAV Automotive Engineering Inc. tries to improve engine efficiency by using both passive and active prechambers with other new technologies. Their work shows that the application of a prechamber spark plug combined with a higher compression ratio can reduce fuel consumption by 2–3%, and a further fuel consumption advantage of 3% can be possible when the Miller cycle or externally cooled EGR is also applied. In the early design and development stage of the prechamber ignition system, the necessary design standards must be considered to solve the challenges of low loads and cold start.48
Although many pieces of research have been conducted on the prechamber ignition system and its effectiveness of application on ICEs, there are still many challenges to achieving efficient combustion with low pollutant emissions. Prechamber jet ignition is a complicated phenomenon and is associated with thermal effects, chemical kinetics, and turbulent mixing, not a purely local phenomenon. Previous detailed works on the fundamental mechanisms of jet ignition were carried out in idealized configurations, rather than in a real engine. Little investigation has been placed on the in-depth analysis of the operating characteristics of the prechamber ignition system from the perspective of the whole engine working cycle. A global understanding of the working process of prechamber ignition is far from complete. Depending on whether the prechamber has an auxiliary fuel supply system, the prechamber ignition system can be divided into an active prechamber and a passive prechamber. To comprehend and identify the operating characteristics of the passive prechamber and active prechamber is considered a still unaccomplished task. Therefore, in order to apply the prechamber jet ignition to ICEs, more studies are encouraged to focus on a detailed analysis of the difference between the passive prechamber and the active prechamber. Motivated by these considerations, the present work studies the operating characteristics of the prechamber jet ignition in a lean-burn natural gas engine based on a coupled computational fluid dynamic (CFD) and a detailed chemical kinetic analysis. The differences between the passive prechamber and active prechamber are compared from four aspects: the gas filling and scavenging performance, the mixing characteristics in the prechamber, the jet ignition ability, and the flame propagation process. The current work describes the features of prechamber jet ignition in more detail and discusses the valuable optimization schemes. The research results will provide a theoretical reference for the subsequent application of prechamber ignition systems in various powertrains.
2. Methodology
2.1. Experimental Apparatus
A test bench is established based on a single-cylinder natural gas engine. The experimental data including performance parameters and in-cylinder pressure data are used to calibrate the numerical model. Table 1 lists the specifications of the engine.
Table 1. Parameters of the Natural Gas Engine.
| item | value |
|---|---|
| number of cylinders | 1 |
| stroke (mm) | 210 |
| cylinder bore (mm) | 190 |
| compression ratio | 10.1 |
| cylinder displacement (L) | 5.95 |
| rated speed (r/min) | 1000 |
| intake phase | 24 °CA BTDC (open) |
| 28 °CA ABDC (close) | |
| exhaust phase | 28 °CA BBDC (open) |
| 24 °CA ATDC (close) | |
| prechamber volume (L) | 0.0084 |
| number of orifices | 8 |
| diameter of the orifice (mm) | 2.5 |
| surface/volume ratio of the orifice | 1.6 mm–1 |
The schematic diagram of the test platform is shown in Figure 1.49 The main chamber uses a premixed intake charge of air and natural gas. Natural gas mixes with air in the air–fuel mixer 14 to obtain a uniform mixture.50 The prechamber has an auxiliary gas injection valve 1 to supply the additional fuel, air, or mixture. The injection valve 1 consists of a solenoid valve and a check valve, as shown in Figure 2. Its injection process is independently controlled by the control module 4. The combustion pressure in the prechamber and main chamber is measured by two piezoelectric pressure sensors 3 and 8 (Kistler 7061B). The pressure in the intake path is measured by an intake pressure sensor 7 (Kistler 4005B). The excess air ratio of the in-cylinder mixture is measured utilizing a wide-band oxygen sensor 22 (BOSCH LSU4.9) and is monitored by a lambda meter (MOL 1000). More details about the test platform and experimental program are reported in our previous study.16
Figure 1.

Schematic diagram of the test bed. Reprinted with permission from ref (49). Copyright 2023 SAGE.
Figure 2.

Assembly of the gas injection valve.
2.2. Numerical Modeling and Data Validation
In this study, the CFD program CONVERGE is used to simulate the flow and combustion process in the single-cylinder natural gas engine. Figure 3 shows the calculation domain at the top dead center (TDC).49 It primarily contains three parts: intake-exhaust system, main chamber, and prechamber. The prechamber is located centrally above the main chamber. The geometry shape and numerical model are shown in Figure 4.51 Eight connecting orifices are evenly sited at the bottom of the prechamber along the radial. The orifice diameter is 2.5 mm. The angle between the orifice axis and the prechamber axis is 60°.
Figure 3.

Computational domain of the simulation model. Reprinted with permission from ref (49). Copyright 2023 SAGE.
Figure 4.

Statement of the prechamber. Reprinted with permission from ref (51). Copyright 2023 SAGE.
It is important to select appropriate submodels according to the characteristics and working processes of ICEs to build the numerical simulation model. To simplify the simulation, the geometric structures of the spark plug are removed, and the spark ignition inside the prechamber is modeled as an energy source.52 As shown in Figure 4b, a spherical ignition energy source with a radius of 0.5 mm is set at the electrode gap, and its spark timing will be set according to the experimental data.53 Turbulent kinetic energy (TKE) and turbulent viscosity are calculated by the Renormalization Group (RNG) k–ε turbulence model.54 The SAGE detailed chemical kinetics solver is used in combination with the Multizone model to solve the combustion chemistry reaction through the Methane multistep reaction mechanism (GRI-MECH 3.0).55,56 The SAGE chemistry solver combined with the RNG k–ε turbulence model is considered suitable for predicting the flow and combustion process of the prechamber ignition system.57,58
Adaptive mesh refinement (AMR) and fixed embedding tools are used to control the mesh size of the computing domain. A mesh-independent study has been carried out, and the following grid control strategies have been determined. The base grid size is 8 mm, and it is refined according to eq 1. A sphere-shaped fixed embedding with a refinement level of six is used around the spark ignition source, achieving a finer resolution of 0.125 mm. In the prechamber and main chamber domain, the AMR with a scale of three is employed for the increase of grid resolution based on the temperature and velocity parameters. A boundary fixed embedding is used around the intake-exhaust valves to more accurately model the intake and exhaust flow. The total number of cells in the domain ranges from 150 259 to 2 042 215.
| 1 |
where dembed is the new grid size and dbase is the base grid size. The embed_scale is the scaling factor and must be a positive integer.
To verify the reliability of the numerical model, the flow and combustion process in the cylinder are simulated under two engine load conditions. The simulation starts at 335 °CA and ends at 750 °CA (360 °CA is the intake stroke top-end center). The indicated mean effective pressure (IMEP) is 0.95 and 1.2 MPa at two verification operating points. The engine speed is 1000 r/min, and the fuel of the main chamber and prechamber is methane. Our previous research summarized the initial conditions and boundary conditions of the simulation.49,51 The inlet of the intake port is set as an inflow boundary condition. The experimental pressure of the intake port is used as the pressure boundary condition. According to the experimental data, the excess air ratio of the intake mixture is set as 2.0. For the prechamber, the additional fuel injection is simulated by setting the top surface of the injection valve duct as an inflow boundary. Assuming complete combustion of the mixture, the mass fraction of the exhaust gas is estimated according to the concentration of the mixture in the main chamber.
Figure 5 shows the comparison between the experiment and simulation for the main chamber pressure and heat release rate curves. As shown in the figure, the predictions of the combustion phase and pressure curves are in good agreement with the experiment. The prediction of the heat release rate shows that there is a two-stage heat release process in the main chamber, which is consistent with our previous results.16Table 2 shows a statistical comparison between the experimental and simulation results. The relative errors between the predicted values and the test results of the key parameters are all within a reasonable error range of 5%. The predicted results of NOx emissions are in agreement with the measured values. Therefore, the established model and the adopted mechanism can predict the flow and combustion process in the natural gas engine with prechamber ignition. This numerical model can be used to simulate the performance of the prechamber ignition system with an active prechamber, and its effectiveness has also been verified in our previous research work.49,51
Figure 5.

Comparison between the experimental and simulation results.
Table 2. Comparisons of the Experimental Results and Simulated Results.
| validation working condition | IMEP = 0.95 MPa |
IMEP = 1.2 MPa |
||||
|---|---|---|---|---|---|---|
| parameter | experiment | simulation | relative error | experiment | simulation | relative error |
| pmax-ma (MPa) | 7.3 | 7.2 | 1.4% | 8.9 | 9.0 | 1.1% |
| θ-pmax-mb (°CA ATDC) | 6.0 | 7.0 | 1 °CA | 7.2 | 9.0 | 1.8 °CA |
| HRRmax-mc (%/°CA) | 7.4 | 7.9 | 6% | 5.6 | 5.3 | 5.3% |
| θ-HRRmax-md (°CA ATDC) | 0.0 | 1.0 | 1 °CA | 3.0 | 1.0 | 2 °CA |
| CA50 (°CA ATDC) | 0.0 | 1.0 | 1 °CA | 4.0 | 3.0 | 1 °CA |
| NOx (ppm) | 70 | 62 | 11% | 74.2 | 81.2 | 9.4% |
Maximum pressure of the main chamber.
pmax-m appearance time.
Maximum heat release rate of the main chamber.
HRRmax-m appearance time.
2.3. Numerical Setup and Analysis
The in-cylinder flow, combustion, and chemical reaction of the passive prechamber (PPRE) and active prechamber (APRE) in the natural gas engine are compared and analyzed by CFD simulation. Two simulation points are selected, and the simulation conditions are shown in Table 3. The excess air ratio λ in the table is the lean burn limit of the test engine under the corresponding operating conditions.
Table 3. Summary of Simulation Conditions.
| sim. no. | form | λ | prechamber fuel injection | injection timing | injection pressure | ignition timing |
|---|---|---|---|---|---|---|
| SP1 | active | 2.0 | CH4 | 97–110 °CA | 0.175 MPa | 342 °CA |
| SP2 | passive | 1.5 | null | null | null | 342 °CA |
According to the three-dimensional simulation results, the operating characteristics of these two ignition systems are analyzed from the following aspects. First, the gas filling and scavenging process of the two prechamber ignition systems during the intake stroke are compared and analyzed. The spatial distribution of the mixture concentration and the flow field in the prechamber at ignition timing then is analyzed based on the 3D simulation results. Finally, the ignition ability of the two types of prechamber ignition systems is evaluated by analyzing the prechamber jet injection and flame propagation in the main chamber.
3. Results and Discussion
3.1. Analysis of the Gas Filling and Scavenging Process in the Prechamber
To thoroughly understand the gas flow process and mixture change in the prechamber during the intake stroke, this section compares the gas filling and scavenging process of the PPRE and the APRE based on two simulation cases of SP1 and SP2. The inflow of fresh charge and the outflow of residual exhaust gas in two types of prechamber ignition systems are analyzed in detail.
3.1.1. Passive Prechamber
During the intake stroke, the premixed methane–air mixture flows into the cylinder through the intake valves. Figure 6 shows the evolution of the mass of CO2 and CH4 in the PPRE during the intake stroke. As can be seen from Figure 6, the CO2 mass decreases slightly, and the CH4 mass increases significantly as the piston moves to the intake bottom dead center.
Figure 6.

Variations of CH4 mass and CO2 mass in the passive prechamber versus the crank angle.
In order to quantitatively describe the gas exchange quality of the PPRE during the intake stage, a scavenging coefficient of gas exchange (ϕs,in) is defined according to eq 2. It is the change ratio of the mass of CO2 during the intake stroke (dCO2,in).
| 2 |
where mCO2,T is the mass of CO2 in the prechamber at the intake TDC and mCO2,B is the mass of CO2 in the prechamber at the intake BDC.
According to eq 2 and the simulation results in Figure 6, ϕs,in of this studied PPRE is 7.7%. It shows that at the end of the intake stroke, a large amount of residual gas from the previous cycle remains in the prechamber. The scavenging performance of the PPRE during the intake stroke is poor.
3.1.2. Active Prechamber
The low-pressure auxiliary fuel injection process in the APRE during the intake stroke is analyzed in detail based on the simulation case of SP1. Figure 7 illustrates the evolution law of the flow field and CH4 mass fraction iso-surface in the prechamber during the auxiliary fuel injection process. It can be observed from Figure 7 that the fuel gas flows along the injection direction, hits the prechamber wall, and bounces. Some of the residual exhaust gas is forced out of the prechamber by the auxiliary fuel injection, thus achieving the scavenging of the prechamber. Furthermore, it can be observed from the CH4 mass fraction iso-surface in Figure 7 that a small quantity of the injected fuel escapes from the prechamber into the main chamber during the injection process, which is referred to as enrichment escape. In order to evaluate the auxiliary fuel injection process accurately and effectively, this Article defines three parameters: scavenging coefficient Sc, enrichment mass En, and escape coefficient Ec.
Figure 7.
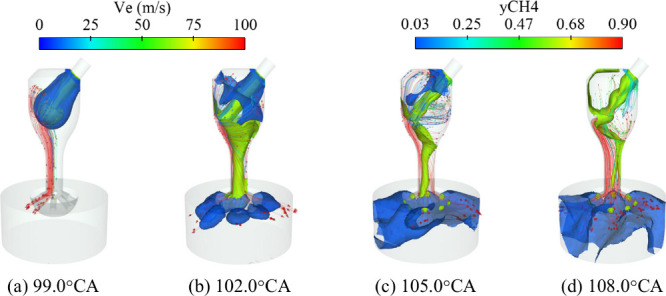
Evolution of the velocity vector and iso-surface of fuel mass.
Scavenging coefficient Sc is defined as the ratio of the reduction of CO2 mass in the prechamber at the end of the auxiliary fuel injection process to the CO2 mass in the prechamber before the injection.
| 3 |
where MsCO2 and MeCO2 are the masses of CO2 within the prechamber at the start and end of auxiliary fuel injection, respectively.
Enrichment mass En is defined as the increase in fuel mass in the prechamber at the end of auxiliary fuel injection.
| 4 |
where Mef and Msf are the CH4 masses in the prechamber at the end and start of auxiliary fuel injection, respectively.
Escape coefficient Ec is defined as the ratio of the fuel mass flowing into the main chamber at the end of the auxiliary fuel injection to the total auxiliary fuel injection mass.
| 5 |
where Mf is the total injection mass of the auxiliary fuel.
The optimum auxiliary fuel injection process should exhibit proper En, a large Sc, and a small Ec. For the simulation case of SP1, the Sc is 53% and Ec is 44%. At the end of the auxiliary fuel injection, the concentrated mixture is formed in the prechamber, with a mass percentage of CH4 of approximately 60%. By organizing auxiliary fuel injection, the effective scavenging and enrichment of the prechamber are realized.
The PPRE exhibits poor scavenging performance due to the throttling effect of the connecting orifices, with a scavenging coefficient of only 7.7%. In contrast, the APRE achieves a scavenging coefficient of 53% through the use of low-pressure auxiliary fuel injection, which effectively improves the fuel quality in the prechamber. The scavenging performance of the APRE is superior to that of the PPRE. However, it is important to note that the APRE has a significant fuel mixture loss. Without affecting the scavenging efficiency, the Ec of the APRE should be reduced. According to the simulation results, the scavenging process in the APRE can be controlled by adjusting the auxiliary fuel injection strategy without changing the prechamber structure. The aim of the optimization and adjustment is to minimize the amount of fuel spilled into the main chamber while maximizing the removal of residual exhaust gas. The auxiliary fuel injection adjustment parameters include injection pressure, injection timing, injection valve configuration, etc. Among these, the position of the fuel injection valve can control the flow of the injected fuel in the prechamber. For instance, the axis of the injection valve is tangent to the circumference of the prechamber, enabling the injected fuel to rotate and flow along the prechamber wall, thus increasing the travel distance of the injected fuel in the prechamber. This may improve the scavenging efficiency and reduce the escape. Therefore, to further enhance the performance of active prechamber ignition, more efforts in optimizing the injection strategy should be conducted in the future.
3.2. Analysis of the Flow Field and Fuel/Air Mixture Formation in the Prechamber during the Compression Stroke
During the compression stroke, the mixture in the main chamber is compressed into the prechamber and mixed with the gas in the prechamber. Whether it is a passive or an active prechamber, the flow and mixing process during this stroke will directly affect the mixture concentration distribution and the flow field in the prechamber at ignition timing, and then affect the combustion process in the prechamber. Therefore, this section will undertake a comprehensive examination of the flow movement law and the mixture formation process in the prechamber during the compression stroke.
3.2.1. Flow Field and Fuel/Air Mixture Formation Inside the Prechamber
In the compression stroke, the gas flow process in the PPRE and the APRE is the same, so the simulation results of SP1 are used to analyze the flow field. Figure 8 shows the evolution of the flow field and the iso-surface of the CH4 mass fraction in the APRE during the compression stroke. It can be seen from Figure 8 that, as the compression process progresses, the mixture in the main chamber is squeezed into the prechamber and forms a special rotational flow field in the upper combustion region. In previous work, we have analyzed the reasons for this rotational flow field in detail.51
Figure 8.

Evolution of the streamline pattern and iso-surface of fuel mass in the compression stroke.
Figure 9 shows the evolution of the volume mean value and standard deviation of the fuel–air equivalence ratio ϕ in the prechamber (ϕ-std) and the CO2 mass fraction in the prechamber during the compression stroke. Meanwhile, the spatial distribution of CH4 in the prechamber at ignition timing is shown in Figure 9. Under the action of the compressed flow field, a special distribution of mixture concentration is formed in the prechamber. For the PPRE, the compression stroke is the main time during which the combustible mixture flows into the prechamber, and the amount of mixture entering the passive prechamber during this stroke is greater than that entering the prechamber during the intake stroke. It can be seen from Figure 9a that the mass fraction of CO2 gradually decreases during the compression stroke, and a combustible mixture is formed in the prechamber at ignition timing with a concentration similar to the mixture in the main chamber. However, the spatial distribution of mixture concentration is inhomogeneous under the influence of the compressed flow, and a high residual exhaust gas coefficient occurs in the central region of the PPRE at ignition timing.
Figure 9.

Evolution of fuel–air equivalence ratio and fuel mass fraction distribution in the prechamber.
For the APRE, the lean mixture in the main chamber flows into the prechamber during the compression stroke and dilutes the rich mixture in the prechamber. As illustrated in Figure 9b, during the compression stroke, the fuel–air equivalence in the APRE and its standard deviation gradually decrease. The homogeneity of the mixture in the prechamber gradually increases. At ignition timing, the mixture in the APRE is close to the quasi-stoichiometric equivalence ratio. As shown in Figure 9b, the mixture concentration distribution in the prechamber is affected by the compressed flow field during the compression stroke, resulting in the formation of a stratified mixture in the upper region of the prechamber. To quantitatively analyze the spatial distribution of the mixture concentration in the APRE, Figure 10 shows the volume fraction of the mixture at a given fuel–air equivalence ratio in the APRE at ignition timing. Due to the influence of mixing time and flow field, the mixture concentration range is large and the mixture uniformity is poor. The mixture concentration and flow field in the APRE exhibit obvious temporal and spatial fluctuations. The ignition and combustion process in the prechamber is similar to that in the conventional spark ignition engine. Consequently, the temporal and spatial fluctuations in the mixture concentration and flow field have an influence on the ignition and flame kernel development process, which in turn affects the combustion speed and combustion stability in the prechamber.
Figure 10.

Distribution of the equivalence ratio at spark ignition timing in the APRE.
To sum up, during the compression stroke, the formation and intensity of the compressed rotational flow in the prechamber are related to the flow field in the main chamber, the geometric structure of the prechamber and the connecting orifices, and the upward movement law of the piston. The mixture formation process in the prechamber is driven by the compressed rotational flow, and the spatial distribution of the mixture follows the characteristics of the flow field. The flow field and mixture concentration distribution in the prechamber can be regulated by optimizing the geometric structure of the prechamber and the flow field in the main chamber to facilitate the ignition and combustion.
3.2.2. Analysis of the Turbulence Intensity Inside the Prechamber and Main Chamber
Figure 11 shows the evolution of the TKE in the main chamber and the prechamber for the PPRE and APRE. The lean mixture compressed into the prechamber from the main chamber creates a flow disturbance to the prechamber flow field. The TKE in the prechamber gradually increases and exceeds the TKE in the main chamber after 330 °CA. The changing trend of the TKE in the PPRE is similar to that in the APRE, indicating that the low-pressure auxiliary fuel injection process organized in the intake stroke will not significantly affect the turbulence kinetic energy in the prechamber.
Figure 11.

Turbulent kinetic energy inside the main chamber and prechamber.
3.3. Analysis of the Jet Ignition and Flame Propagation Process
Based on the simulation results, the combustion characteristics and jet injection process of the passive and active prechambers are studied. The jet ignition dynamics and flame propagation process of the two types of prechambers then are compared and analyzed.
3.3.1. Prechamber Combustion and Jet Injection
As illustrated in Figure 12, the outlet cross-section (plane A) of the connecting orifices on the main chamber side and the vertical section (plane B) of the prechamber are obtained.51 The average values of the mass fraction of CH4, OH, and the temperature on plane A are calculated according to eq 6.59 The aerodynamic and chemical characteristics of the jets at the exit of the connecting orifices then are analyzed, and the material exchange process between the prechamber and the main chamber is discussed.
| 6 |
where ξ is the studied variable, and S is the integral surface.
Figure 12.

Schematic diagram of the cutting plane. Reprinted with permission from ref (51). Copyright 2023 SAGE.
3.3.1.1. Passive Prechamber
Figure 13 shows the evolution of the average value of the variables on plane A, as well as the flow velocity between the prechamber and the main chamber with crank angle for the PPRE. The negative value of the velocity indicates that the working fluid flows from the prechamber into the main chamber. At the same time, Figure 13 also shows the evolution of the temperature and the flow field on plane B.
Figure 13.

Variables at plane A as well as the flow velocity and temperature contours on plane B for PPRE.
As shown in Figure 13, the jet injection process for the PPRE can be divided into three stages, cold jet, hot jet, and reverse flow. The cold jet (indicated in blue) is caused by the unburned mixture in front of the flame front in the prechamber flowing into the main chamber. When the high-temperature combustion flame is sprayed through the connecting orifices to the main chamber, resulting in a rapid increase in temperature on section plane A, the hot jets begin to inject (indicated in red). The reverse flow is caused by the combustion gas in the main chamber flowing into the prechamber (indicated in green). From the change of the CH4 mass fraction in Figure 13, it can be seen that the reverse flow carries a small amount of unburned fuel. This is due to the presence of a small amount of unburned gas in the vicinity of the connecting orifices. OH is an important intermediate product generated and consumed in combustion chemical reactions. It is usually used to indicate the high-temperature reaction region of combustion.41 As illustrated in Figure 13, during the hot jet injection, the OH mass fraction on plane A is lower relative to the reverse flow. This may be due to the flame quenching when the combustion flame passes through the connecting orifice, which leads to a reduction in the concentration of active components in the hot jet.
3.3.1.2. Active Prechamber
Figure 14 shows the jet injection process of the APRE. Compared with PPRE, the APRE has better mixture conditions at ignition timing, resulting in a hotter, faster jet with a higher concentration of active species. The injection time of the cold jet, hot jet, and reverse flow is advanced. From the CH4 mass fraction in Figure 14, it can be seen that the CH4 concentration at the exit of the connecting orifices increases slightly during the cold jet injection, which is due to the outflow of the rich mixture at the upper part of the active prechamber.
Figure 14.

Variables at plane A as well as the flow velocity and temperature contours on plane B for APRE.
From the above analysis, it can be seen that the jet injection process of PPRE and APRE is basically the same, but the dynamics and chemical characteristics of the jet are different. The jet generated by the APRE has a higher jet velocity, a higher temperature, and more intermediate chemical components. A high residual exhaust gas content reduces the ignition efficiency of the PPRE jet. Compared with PPRE, the jet ignition ability of the APRE is improved effectively, which is undoubtedly helpful to the ignition and combustion process of the main chamber, especially for ultradilute mixtures.
3.3.2. Jet Ignition and Flame Propagation Process
3.3.2.1. Passive Prechamber
Based on the simulation case of SP2, Figure 15 shows the evolution of the combustion heat release of the prechamber and the main chamber for the PPRE ignition system, as well as the flow velocity between the two combustion chambers. The heat release rate (HRR) of the prechamber increases to the peak value in the hot jet stage. During the reverse flow stage, a small amount of unburned mixture flows into the prechamber and releases heat. The HRR of the main chamber exhibits a single peak trend. When the high-temperature combustion gas flows into the main chamber, the HRR begins to rise rapidly and then decreases slowly after reaching the maximum value.
Figure 15.

Flow velocity between the two chambers and the heat release rate in the two chambers for PPRE.
Figure 16 shows the evolution of the turbulent flame fronts in the cylinder by following the iso-surface temperature of 1800 K, which corresponds to the heat release rate curve of the main chamber depicted in Figure 15. As can be seen from Figure 16, the penetration distance of the hot jet is very small due to the leaner mixture in the prechamber with a high residual exhaust gas coefficient. When the hot jet stops spraying, the combustion flame develops into several spherical flame surfaces with the jet axis as the center, and the flame surfaces from the adjacent connecting orifices intersect (point C). The flame front then spreads quickly in all directions. When the flame front sweeps through most of the cylinder volume, the HRR rises to the peak value (point D) and then begins to decline. During the process from D to E, the HRR decreases slowly as the flame front spreads to the outer ring at the top of the piston and sweeps over the unburned mixture. As the flame front continues to spread to the cylinder wall, the combustion heat release in the cylinder is essentially complete and the HRR is reduced to zero.
Figure 16.

Evolution of the isothermal surface in the combustion chambers for the PPRE.
3.3.2.2. Active Prechamber
Figure 17 shows the evolution of the combustion heat release of the prechamber and main chamber of the APRE ignition system, as well as the flow velocity between the two combustion chambers. During the reverse flow stage, the lean mixture in the main chamber flows into the prechamber, promoting further oxidation of the uncompleted combustion mixture. In this process, the prechamber HRR curve fluctuates slightly and the MFB curve rises slowly. The main chamber HRR curve has a unique two-stage heat release characteristic. The first stage is caused by the prechamber jet injected into the main chamber, and the second stage is due to the multipoint ignition and combustion of the lean mixture in the main chamber.
Figure 17.

Flow velocity between the two chambers and the heat release rate in the two chambers for APRE.
Figure 18 shows the evolution of the turbulent flame front in the cylinder corresponding to the HRR curve of the main chamber in Figure 17. According to the flame propagation characteristics, the two-stage heat release process can be divided into three phases, namely, the initial flame development phase, the rapid combustion phase, and the late combustion phase. The initial flame development phase is the period corresponding to point A to point B. During this period, the rate and duration of heat release mainly depend on the jet injection velocity, temperature, and active composition, as well as the mixture conditions in the main chamber. The rapid combustion phase is from point B to point C. The heat release process enters the second stage. In this phase, the momentum of the jet gradually decreases and decays to a minimum value. The heat release rate and the flame propagation process depend on the area covered by the jet, the jet residual momentum, and the turbulent flame speed. The late combustion phase is the period from point C to point D. The flame propagation speed in this period is related to the turbulent flame speed in the cylinder. The flame front gradually sweeps the entire main chamber. The combustion and heat release process of the lean mixture in the main chamber essentially ends at point D.
Figure 18.

Evolution of the isothermal surface in the combustion chambers for the APRE.
In the lean burn condition, the injection velocity, temperature, and active components of the jet in the PPRE are all low, so there is no obvious high-velocity and high-temperature jet injection process. This ignition mode is similar to torch ignition, and the combustion process in the main chamber is mainly turbulent flame propagation. However, for the APRE ignition, the main chamber combustion process exhibits a two-stage heat release characteristic under the ultralean condition. The high-temperature gas produced by the premixed combustion in the prechamber quickly enters the main chamber, forming obvious flame jets. The two-stage heat release characteristic is more pronounced with a greater difference in mixture concentration between the prechamber and the main chamber. Optimizing the prechamber jet injection process and matching it to the main chamber geometry can alter the heat release law in the cylinder, resulting in a higher indicated efficiency.
To further study the ignition characteristics of the prechamber jet, Figure 19 illustrates the evolution of the OH mass fraction and velocity in the main chamber for two prechamber ignition systems. The contour lines of the CH4 mass fraction yCH4 = 0.016–0.02 are also drawn in the velocity vector diagram. The time base is the start time of the hot jet (SoHJ), and the time interval is 1.8 °CA. It can be seen from Figure 19 that, for the PPRE, the jet activity at the exit of the connecting orifice is low, while a high concentration of OH can be observed at the flame front as the jet flame spreads around. However, for the APRE, the jet activity at the orifice exit is high, and chemically reactive flame jets are formed (indicated by a high OH concentration). The evolution mode and law of the prechamber jets are similar to the visualization results in ref (46). The jet ignition mechanism of the APRE ignition system is designated as “flame jet ignition”.40 The flame in the prechamber exhibits a high concentration of free radicals and a thinner flame front. The flame is not easily extinguished as it passes through the connecting orifices, so the chemical reactivity of the jet is higher than in the PPRE. In addition, the OH mass fraction for APRE indicates that the reactivity at the orifice exits and in the upper region of the jets is higher than that at the jet boundary. The active components around the orifice exits originate from the prechamber, and the higher reactivity observed in the upper region of the jets is caused by the combustion and heat release of the mixture in the main chamber. As for the transverse boundary of the jet, the laminar shear layer of the high-speed jet impedes the ignition of the mixture in the main chamber, resulting in a lower level of reactivity here.
Figure 19.

Evolution of OH mass fraction distribution and flow field in the main chamber.
The evolution of the flow field in Figure 19 indicates that the flame propagation along the axis of the connecting orifices is mainly driven by the jet momentum, while the propagation perpendicular to the axis is due to the coupling effect of jet entrainment and turbulent flame propagation. Figure 20 shows the temperature at the axial and radial axis of the jet in the main chamber at 7 °CA following the jet injection. Figure 20a shows the schematic view of the axial and radial axes of the jet. As can be seen from Figure 20b, the axial propagation distance of the jet flame in the APRE is greater than that in the PPRE. This indicates that the axial velocity of the jet flame is faster in the APRE. However, the radial flame propagation distance of the jet exhibits a different rule. The radial propagation distance of the jet flame in the APRE is shorter than that in the PPRE due to the difference in mixture concentration of the main chamber. Therefore, an increase in the jet intensity primarily affects the flame front propagation in the axial direction of the jet. With the increase of jet penetration distance, the flame front is forced to sweep the jet penetration area, thereby consuming more unburned mixture in front of the jet tip. However, the flame propagation in the radial direction of the jet is more dependent on the chemical activity of the unburned mixture. It determines the time scale of the chemical reaction, which in turn affects the ignition and combustion process in the radial direction.
Figure 20.

Temperature on the center axis of the hot jet.
4. Conclusion
This Article conducts a numerical study to explore the operating characteristics of the prechamber ignition to gain an in-depth understanding of the prechamber ignition performance under engine conditions. Based on a single-cylinder large bore natural gas engine, a simulation model is established and validated by experimental results. The in-cylinder flow and combustion process in the passive prechamber and active prechamber are studied numerically and compared, with special attention to computational fluid dynamics and detailed chemical kinetic analysis. The main conclusions are as follows.
(1) Three parameters, scavenging coefficient, enrichment mass, and escape coefficient, are established to evaluate the gas filling and scavenging process of the prechamber ignition system. The passive prechamber has poor scavenging performance due to the throttling effect of the connecting orifices, while the active prechamber achieves effective scavenging and enrichment through auxiliary fuel injection.
(2) During the compression stroke, the formation and intensity of the compressed rotational flow in the prechamber are related to the flow field in the main chamber, the geometric structure of the prechamber and the connecting orifices, and the upward movement law of the piston. The mixture formation process in the prechamber is driven by the compressed rotational flow, and the spatial distribution of the mixture follows the characteristics of the flow field.
(3) The jet injection process of the passive and active prechamber can be divided into three stages: cold jet, hot jet, and reverse flow. The physical and chemical properties of the hot jet are mainly affected by the mixture combustion in the prechamber. Compared to the passive prechamber, the richer mixture of the active prechamber results in a hot jet with higher activity, higher temperature, and faster injection velocity.
(4) For the active prechamber ignition system, the main chamber combustion process presents a two-stage heat release characteristic, which can be subdivided into three phases according to the flame propagation: the initial flame development phase, the rapid combustion phase, and the late combustion phase. The heat release rate during the initial flame development phase depends on the jet injection velocity, temperature, and active composition, as well as the mixture conditions in the main chamber. During the rapid combustion phase, the flame propagation along the radial direction of the jet depends largely on the chemical reaction time scale. The heat release rate of the main chamber depends on the coverage area of the jet, the jet residual momentum, and the turbulent flame speed. During the late combustion phase, the flame propagation is influenced by the turbulent flame speed.
Acknowledgments
This work was financially funded by the Shandong Postdoctoral Science Foundation (Grant no. SDBX2023052), the Doctoral Research Start-up Fund of Shandong University of Technology (Grant no. 524002), the Shandong Province Natural Science Foundation (Grant no. ZR2023QF158), and the National Natural Science Foundation of China (Grant nos. 51976107 and 52376118). We acknowledge Convergent Science Inc. for providing the licenses for the use of the CONVERGE CFD Software. We appreciate the reviewers and editors for their careful reading and many constructive comments on improving the manuscript. X.Y. would like to thank Guanguan Li (School of Electrical and Electronic Engineering, Shandong University of Technology, Zibo, Shandong 255000, China) for moral support and encouragement.
Glossary
Nomenclature
- ABDC
after bottom dead center
- ATDC
after top dead center
- AMR
adaptive mesh refinement
- APRE
active prechamber
- BBDC
before bottom dead center
- BTDC
before top dead center
- CFD
computational fluid dynamic
- HRR
heat release rate
- MFB
mass fraction burned
- ICE
internal combustion engine
- IMEP
indicated mean effective pressure
- IT
ignition timing
- PPRE
passive prechamber
- TDC
top dead center
- TKE
turbulent kinetic energy
- λ
excess air ratio
- ϕ
fuel-air equivalence ratio
- ϕs,in
scavenging coefficient
- dCO2,in
change ratio of the mass of CO2 during the intake stroke
- mCO2,T
mass of CO2 in the prechamber at the intake top dead center
- mCO2,B
mass of CO2 in the prechamber at the intake bottom dead center
- Sc
ratio of the reduction of CO2 mass in the prechamber
- MsCO2
mass of CO2 in the prechamber at the start of auxiliary fuel injection
- MeCO2
mass of CO2 in the prechamber at the end of auxiliary fuel injection
- En
enrichment mass
- Mef
CH4 mass in the prechamber at the end of auxiliary fuel injection
- Msf
CH4 mass in the prechamber at the start of auxiliary fuel injection
- Ec
escape coefficient
- Mf
total injection mass of the auxiliary fuel
The authors declare no competing financial interest.
References
- Nyambuu U.; Semmler W. Climate change and the transition to a low carbon economy - Carbon targets and the carbon budget. Econ. Model. 2020, 84, 367–376. 10.1016/j.econmod.2019.04.026. [DOI] [Google Scholar]
- Yuan Z.; Ou X.; Peng T.; Yan X. Life cycle greenhouse gas emissions of multi-pathways natural gas vehicles in china considering methane leakage. Appl. Energy 2019, 253, 113472. 10.1016/j.apenergy.2019.113472. [DOI] [Google Scholar]
- Melaika M.; Herbillon G.; Dahlander P. Spark ignition engine performance, standard emissions and particulates using GDI, PFI-CNG and DI-CNG systems. Fuel 2021, 293, 120454. 10.1016/j.fuel.2021.120454. [DOI] [Google Scholar]
- Pan K.; Wallace J. Computational studies of fuel injection strategies on natural gas combustion characteristics in direct-injection engines. Fuel 2021, 288, 119823. 10.1016/j.fuel.2020.119823. [DOI] [Google Scholar]
- Hall C.; Kassa M. Advances in combustion control for natural gas-diesel dual fuel compression ignition engines in automotive applications: A review. Renewable Sustainable Energy Rev. 2021, 148, 111291. 10.1016/j.rser.2021.111291. [DOI] [Google Scholar]
- Fan C. Study on modified natural gas engine considering NOx emission. Appl. Mech. Mater. 2013, 318, 371–374. 10.4028/www.scientific.net/AMM.318.371. [DOI] [Google Scholar]
- Han Z.; Wu Z.; Huang Y.; Shi Y.; Liu W. Impact of natural gas fuel characteristics on the design and combustion performance of a new light-duty CNG engine. Int. J. Automot. Technol. 2021, 22, 1619–1631. 10.1007/s12239-021-0140-1. [DOI] [Google Scholar]
- Almansour B.; Vasu S.; Gupta S. B.; Wang Q.; Van Leeuwen R.; Ghosh C. Performance of a laser ignited multicylinder lean burn natural gas engine. J. Eng. Gas Turb. Power. 2017, 139 (11), 111501. 10.1115/1.4036621. [DOI] [Google Scholar]
- Shudo T.; Omori K.; Hiyama O. NOx reduction and NO2 emission characteristics in rich-lean combustion of hydrogen. Int. J. Hydrogen Energy 2008, 33 (17), 4689–4693. 10.1016/j.ijhydene.2008.05.034. [DOI] [Google Scholar]
- Zhang R.; Chen L.; Wei H.; Pan J.; Li J.; Yang P.; Chen R. Optical study on the effects of the hydrogen injection timing on lean combustion characteristics using a natural gas/hydrogen dual-fuel injected spark-ignition engine. Int. J. Hydrogen Energy 2021, 46 (39), 20777–20789. 10.1016/j.ijhydene.2021.03.171. [DOI] [Google Scholar]
- Lott P.; Deutschmann O. Lean-Burn Natural Gas Engines: Challenges and concepts for an efficient exhaust gas aftertreatment system. Emiss. Control Sci. Technol. 2021, 7, 1–6. 10.1007/s40825-020-00176-w. [DOI] [Google Scholar]
- Esfahanian V.; Salahi M. M.; Gharehghani A.; Mirsalim M. Extending the lean operating range of a premixed charged compression ignition natural gas engine using a pre-chamber. Energy 2017, 119, 1181–1194. 10.1016/j.energy.2016.11.071. [DOI] [Google Scholar]
- Toulson E.; Schock H. J.; Attard W. P.. A review of pre-chamber initiated jet ignition combustion systems. SAE Technol. Pap. 2010; p 2010-01-2263.
- Alvarez C. E. C.; Couto G. E.; Roso V. R.; Thiriet A. B.; Valle R. M. A review of pre-chamber ignition systems as lean combustion technology for SI engines. Appl. Therm. Eng. 2018, 128, 107–120. 10.1016/j.applthermaleng.2017.08.118. [DOI] [Google Scholar]
- Liu Z.; Wei H.; Shu G.; Zhou L. Ammonia-hydrogen engine with reactivity-controlled turbulent jet ignition (RCTJI). Fuel 2023, 348, 128580. 10.1016/j.fuel.2023.128580. [DOI] [Google Scholar]
- Yang X.; Cheng Y.; Wang P. The scavenging timing of pre-chamber on the performance of a natural gas engine. Int. J. Engine Res. 2021, 22 (9), 2919–2930. 10.1177/1468087420960876. [DOI] [Google Scholar]
- Hua J.; Song Y.; Zhou L.; Liu F.; Wei H. Operation strategy optimization of lean combustion using turbulent jet ignition at different engine loads. Appl. Energy 2021, 302, 117586. 10.1016/j.apenergy.2021.117586. [DOI] [Google Scholar]
- Zhao Z.; Cai K.; Wang W.; Li Y.. Effects of octane number and sensitivity on combustion of jet ignition engine. SAE Technol. Pap. 2022; p 2022-01-0435.
- Stadler A.; Sauerland H.; Härtl M.; Wachtmeister G.. The potential of gasoline fueled pre chamber ignition combined with elevated compression ratio. SAE Technol. Pap. 2020; p 2020-01-0279.
- Payri R.; Novella R.; Barbery I.; Bori-Fabra O. Numerical and experimental evaluation of the passive pre-chamber concept for future CNG SI engines. Appl. Therm. Eng. 2023, 230, 120754. 10.1016/j.applthermaleng.2023.120754. [DOI] [Google Scholar]
- Roso V. R.; Santos N. D. S. A.; Valle R. M.; Alvarez C. E. C.; Monsalve-Serrano J.; García A. Evaluation of a stratified prechamber ignition concept for vehicular applications in real world and standardized driving cycles. Appl. Energy 2019, 254, 113691. 10.1016/j.apenergy.2019.113691. [DOI] [Google Scholar]
- Zhan W.; Chen H.; Du J.; Wang B.; Xie F.; Li Y. High compression ratio active pre-chamber single-cylinder gasoline engine with 50% gross indicated thermal efficiency. ACS Omega 2023, 8 (5), 4756–4766. 10.1021/acsomega.2c06810. [DOI] [PMC free article] [PubMed] [Google Scholar]
- Syrovatka Z.; Vitek O.; Vavra J.; Takats M.. Scavenged pre-chamber volume effect on gas engine performance and emissions. SAE Technol. Pap. 2019; p 2019-01-0258.
- Xu G.; Wright Y. M.; Kyrtatos P.; Bardis K.; Schiliro M.; Boulouchos K. Experimental and numerical investigation of the engine operational conditions’ influences on a small un-scavenged pre-chamber’s behavior. SAE Int. J. Engines 2017, 10 (5), 2414–2428. 10.4271/2017-24-0094. [DOI] [Google Scholar]
- Silva M.; Sanal S.; Hlaing P.; Cenker E.; Johansson B.; Im H. G.. Effects of geometry on passive pre-chamber combustion characteristics. SAE Technol. Pap. 2020; p 2020-01-0821.
- Zhao Z.; Wang Z.; Qi Y.; Cai K.; Li F. Experimental study of combustion strategy for jet ignition on a natural gas engine. Int. J. Engine Res. 2022, 23 (1), 104–119. 10.1177/1468087420977751. [DOI] [Google Scholar]
- Seitz F.; Markus D.; Grosshans H.; Schießl R. Effects of nozzle geometry on the reignition by hot gas jets. Combust. Sci. Technol. 2019, 191 (2), 296–310. 10.1080/00102202.2018.1459586. [DOI] [Google Scholar]
- Bozza F.; De Bellis V.; Tufano D.; Malfi E.; Müller C.; Habermann K. 1D Numerical and experimental investigations of an ultralean pre-chamber engine. SAE Int. J. Engines 2020, 13 (2), 159–174. 10.4271/03-13-02-0012. [DOI] [Google Scholar]
- Fuchao S. H. E. N.; Totsuka M.; Kuboyama T.; Moriyoshi Y.; Yamada T.; Shimizu K.; Yoshida T.. Effects of pre-chamber specifications on lean burn operation in a pre-chamber engine with fuel reformed gas. SAE Technol. Pap. 2023; p 2023-32-0007.
- Wang B.; Xie F.; Hong W.; Du J.; Chen H.; Su Y. The effect of structural parameters of pre-chamber with turbulent jet ignition system on combustion characteristics of methanol-air pre-mixture. Energy Convers. Manag. 2022, 274, 116473. 10.1016/j.enconman.2022.116473. [DOI] [Google Scholar]
- Antolini J.; Sementa P.; Tornatore C.; Catapano F.; Vaglieco B. M.; Desantes J. M.; López J. J. Effect of passive pre-chamber orifice diameter on the methane combustion process in an optically accessible SI engine. Fuel 2023, 341, 126990. 10.1016/j.fuel.2022.126990. [DOI] [Google Scholar]
- Wu X.; Feng Y.; Gao Y.; Xia C.; Zhu Y.; Shreka M.; Ming P. Numerical simulation of lean premixed combustion characteristics and emissions of natural gas-ammonia dual-fuel marine engine with the pre-chamber ignition system. Fuel 2023, 343, 127990. 10.1016/j.fuel.2023.127990. [DOI] [Google Scholar]
- Zhou H.; Meng S.; Han Z. Combustion characteristics and misfire mechanism of a passive pre-chamber direct-injection gasoline engine. Fuel 2023, 352, 129067. 10.1016/j.fuel.2023.129067. [DOI] [Google Scholar]
- Trombley G.; Toulson E. A fuel-focused review of pre-chamber initiated combustion. Energy Convers. Manag. 2023, 298, 117765. 10.1016/j.enconman.2023.117765. [DOI] [Google Scholar]
- Hlaing P.; Silva M.; Marquez M. E.; Cenker E.; Ben Houidi M.; Im H. G.; Turner J. W.; Johansson B. Estimates of the air-fuel ratio at the time of ignition in a pre-chamber using a narrow throat geometry. Int. J. Engine Res. 2023, 24 (2), 622–638. 10.1177/14680874211059148. [DOI] [Google Scholar]
- Benajes J.; Novella R.; Gomez-Soriano J.; Martínez-Hernándiz P. J.; Libert C.; Dabiri M. Evaluation of the passive pre-chamber ignition concept for future high compression ratio turbocharged spark-ignition engines. Appl. Energy 2019, 248, 576–588. 10.1016/j.apenergy.2019.04.131. [DOI] [Google Scholar]
- Yontar A. A. A comparative study to evaluate the effects of pre-chamber jet ignition for engine characteristics and emission formations at high speed. Energy 2020, 210, 118640. 10.1016/j.energy.2020.118640. [DOI] [Google Scholar]
- Vítek O.; Macek J.; Polášek M.. Simulation of pre-chambers in an engine combustion chamber using available software. SAE Technol. Pap. 2003; p 2003-01-0373.
- Serrano D.; Zaccardi J.-M.; Müller C.; Libert C.; Habermann K. Ultra-lean pre-Chamber gasoline engine for future hybrid powertrains. SAE Int. J. Advances & Curr. Prac. in Mobility 2020, 2 (2), 607–622. 10.4271/2019-24-0104. [DOI] [Google Scholar]
- Biswas S.; Tanvir S.; Wang H.; Qiao L. On ignition mechanisms of premixed CH4 /air and H2 /air using a hot turbulent jet generated by pre-chamber combustion. Appl. Therm. Eng. 2016, 106, 925–937. 10.1016/j.applthermaleng.2016.06.070. [DOI] [Google Scholar]
- Qin F.; Shah A.; Huang Z. W.; Peng L. N.; Tunestal P.; Bai X. S. Detailed numerical simulation of transient mixing and combustion of premixed methane/air mixtures in a pre-chamber/main-chamber system relevant to internal combustion engines. Combust. Flame 2018, 188, 357–366. 10.1016/j.combustflame.2017.10.006. [DOI] [Google Scholar]
- Wang N.; Liu J.; Chang W. L.; Le C. F. Ignition kinetics of a homogeneous hydrogen/air mixture using a transient hot jet. Int. J. Hydrogen Energy 2018, 43, 16373–16385. 10.1016/j.ijhydene.2018.07.029. [DOI] [Google Scholar]
- Allison P. M.; De Oliveira M.; Giusti A.; Mastorakos E. Pre-chamber ignition mechanism: Experiments and simulations on turbulent jet flame structure. Fuel 2018, 230, 274–281. 10.1016/j.fuel.2018.05.005. [DOI] [Google Scholar]
- Jeelan basha K. B.; Balasubramani S.; Sivasankaralingam V. Effect of pre-chamber geometrical parameters and operating conditions on the combustion characteristics of the hydrogen-air mixtures in a pre-chamber spark ignition system. Int. J. Hydrogen Energy 2023, 48 (65), 25593–25608. 10.1016/j.ijhydene.2023.03.308. [DOI] [Google Scholar]
- Liu X.; Echeverri Marquez M. E.; Sanal S.; Silva M.; AlRamadan A. S.; Cenker E.; Sharma P.; Magnotti G.; Turner J. W. G.; Im H. G. Computational assessment of the effects of pre-chamber and piston geometries on the combustion characteristics of an optical pre-chamber engine. Fuel 2023, 341, 127659. 10.1016/j.fuel.2023.127659. [DOI] [Google Scholar]
- Tian J.; Cui Z.; Ren Z.; Tian H.; Long W. Experimental study on jet ignition and combustion processes of natural gas. Fuel 2020, 262, 116467. 10.1016/j.fuel.2019.116467. [DOI] [Google Scholar]
- Hua J.; Zhou L.; Gao Q.; Feng Z.; Wei H. Influence of pre-chamber structure and injection parameters on engine performance and combustion characteristics in a turbulent jet ignition (TJI) engine. Fuel 2021, 283, 119236. 10.1016/j.fuel.2020.119236. [DOI] [Google Scholar]
- Sens M.; Binder E. Pre-chamber ignition as a key technology for future powertrain fleets. MTZ. Worldwide 2019, 80 (2), 44–51. 10.1007/s38313-018-0150-1. [DOI] [Google Scholar]
- Yang X.; Wang P.; Zhao Q.; Ji S.; Cheng Y.; Yin W. Effect of spark timing on the pre-chamber jet ignition in a lean-burn natural gas engine. Int. J. Engine Res. 2023, 24 (8), 3556–3573. 10.1177/14680874231162919. [DOI] [Google Scholar]
- Korb B.; Kuppa K.; Nguyen H. D.; Dinkelacker F.; Wachtmeister G. Experimental and numerical investigations of charge motion and combustion in lean-burn natural gas engines. Combust. Flame 2020, 212, 309–322. 10.1016/j.combustflame.2019.11.005. [DOI] [Google Scholar]
- Yang X.; Cheng Y.; Zhao Q.; Wang P.; Chen J. Effect of spark ignition location on the turbulent jet ignition characteristics in a lean burning natural gas engine. Int. J. Engine Res. 2023, 24 (2), 702–719. 10.1177/14680874211064677. [DOI] [Google Scholar]
- Distaso E.; Amirante R.; Cassone E.; Catapano F.; De Palma P.; Sementa P.; Tamburrano P.. Experimental and numerical analysis of a pre-chamber turbulent jet ignition combustion system. SAE Technol. Pap. 2019; p 2019-24-0018.
- Yang X.; Solomon A.; Kuo T. W.. Ignition and combustion simulations of spray-guided SIDI engine using Arrhenius combustion with spark-energy deposition model. SAE Technol. Pap. 2012; p 2012-01-0147.
- Thelen B. C.; Toulson E.. A computational study of the effects of spark location on the performance of a turbulent jet ignition system. SAE Technol. Pap. 2016; p 2016-01-0608.
- Senecal P. K.; Pomraning E.; Richards K.; Briggs T. E.; Choi C. Y.; McDavid R. M.; Patterson M. A.. Multi-dimensional modeling of direct-injection diesel spray liquid length and flam lift-off length using CFD and parallel detailed chemistry. SAE Technol. Pap. 2003; p 2003-01-1043.
- Babajimopoulos A.; Assanis D. N.; Flowers D. L.; Aceves S. M.; Hessel R. P. A fully coupled computational fluid dynamics and multi-zone model with detailed chemical kinetics for the simulation of premixed charge compression ignition engines. Int. J. Engine Res. 2005, 6 (5), 497–512. 10.1243/146808705X30503. [DOI] [Google Scholar]
- Wang M.; Leng X.; He Z.; Wei S.; Chen L.; Jin Y.. A numerical study on the effects of the orifice geometry between pre- and main chamber for a natural gas engine. SAE Technol. Pap. 2017; p 2017-01-2195.
- Gholamisheeri M.; Wichman I. S.; Toulson E. A study of the turbulent jet flow field in a methane fueled turbulent jet ignition (TJI) system. Combust. Flame 2017, 183, 194–206. 10.1016/j.combustflame.2017.05.008. [DOI] [Google Scholar]
- Malé Q.; Staffelbach G.; Vermorel O.; Misdariis A.; Ravet F.; Poinsot T. Large eddy simulation of pre-chamber ignition in an internal combustion engine. Flow Turbul. Combust. 2019, 103 (2), 465–483. 10.1007/s10494-019-00026-y. [DOI] [Google Scholar]