

Abstract
Objective:
To present a new set of lithium-ion cross-sections for (i) ionization and excitation processes down to 700 eV, and (ii) charge-exchange processes down to 1 keV/u. To evaluate the impact of the use of these cross-sections on micro a nano dosimetric quantities in the context of boron neutron capture (BNC) applications/techniques.
Approach:
The Classical Trajectory Monte Carlo (CTMC) method was used to calculate Li ion charge-exchange cross sections in the energy range of 1 keV/u to 10 MeV/u. Partial Li ion charge states ionization and excitation cross-sections were calculated using a detailed charge screening factor. The cross-sections were implemented in Geant4-DNA v10.07 and simulations and verified using TOPAS-nBio by calculating stopping power and CSDA range against data from ICRU and SRIM. Further microdosimetric and nanodosimetric calculations were performed to quantify differences against other simulation approaches for low energy Li ions. These calculations were: lineal energy spectra (yf(y) and yd(y)), frequency mean lineal energy , dose mean lineal energy and ionization cluster size distribution analysis. Microdosimetric calculations were compared against a previous MC study that neglected charge-exchange and excitation processes. Nanodosimetric results were compared against pure ionization scaled cross-sections calculations.
Main Results:
Calculated stopping power differences between ICRU and Geant4-DNA decreased from 33.78% to 6.9%. The CSDA range difference decreased from 621% to 34% when compared against SRIM calculations. Geant4-DNA/TOPAS calculated dose mean lineal energy differed by 128% from the previous Monte Carlo. Ionization cluster size frequency distributions for Li ions differed by 76% to 344.11% for 21 keV and 2 MeV respectively. With a decrease in the N1 within 9% at 10 keV and agreeing after the 100 keV. With the new set of cross-sections being able to better simulate low energy behaviors of Li ions.
Significance:
This work shows an increase in detail gained from the use of a more complete set of low energy cross-sections which include charge exchange processes. Significant differences to previous simulation results were found at the microdosimetric and nanodosimetric scales that suggest that Li ions cause less ionizations per path length traveled but with more energy deposits. Microdosimetry results suggest that the BNC’s contribution to cellular death may be mainly due to alpha particle production when boron-based drugs are distributed in the cellular membrane and beyond and by Li when it is at the cell cytoplasm regions.
1. Introduction
Modeling particle tracks in an interaction-by-interaction approach provides a comprehensive understanding of radiation-induced damage from first principles. It gives us enough details to discern between direct physical-induced and indirect chemical-induced DNA strand breaks that have been demonstrated in previous works (Charlton et al., 1989; D-Kondo et al., 2021; Friedland et al., 2002; Meylan et al., 2017; Ramos-Mendez et al., 2021; Tomita et al., 1998). One of the best tools for DNA strand break modeling are Monte Carlo Track-Structure (MCTS) codes (Nikjoo et al., 2006). Examples of MCTS codes capable of simulating the chemistry necessary for the indirect DNA strand breaks are PARTRAC (Friedland et al., 2011), TRACELE (Cobut et al., 1998), ETRAN (S.M. Berger, 1973), and Geant4-DNA (Bernal et al., 2015; Incerti, Baldacchino, et al., 2010; Incerti et al., 2018; Incerti, Ivanchenko, et al., 2010), among many others. MCTS codes require cross-section data that characterizes the radiation transport in terms of its probability of interaction, energy loss, and scattering angles to properly simulate radiation transport through matter. These cross-sections are obtained by using either experimental data (Dingfelder et al., 2000) or theoretical models like the relativistic plane-wave Born approximation (Fano, 1963) for bare ions.
Geant4-DNA, an extension of the general-purpose Monte Carlo code Geant4 (Agostinelli et al., 2003), is an MCTS code with a modular design that permits the incorporation of new cross-sections without the need to change a significant portion of the already existing code. Today, Geant4-DNA has models that allow the simulation of interaction processes for photons, electrons, protons, and all charged states of alpha particles among other particles for transport in mediums consisting of liquid water, gold (Sakata et al., 2018), nucleotides (Zein et al., 2023) and nitrogen(Pietrzak et al., 2022). The low energy limit for the different models of Geant4-DNA is about 10 eV for electrons (depending on the models), 100 eV for protons and for bare alpha particles (Bernal et al., 2015; Incerti, Ivanchenko, et al., 2010). For ions heavier than alpha, only the ionization process is considered and valid for energies above about 1 MeV/amu (Francis et al., 2012). Because charge states or charge exchange, excitation, and elastic processes are not considered for ions heavier than alpha particles, the transport of such ions at low energy (below about 1 MeV/amu) is prone to give unreliable results. Charge-exchange cross-sections cannot be obtained using scaling factors and are mostly obtained via experimental procedures as in the case of alpha particles (Dingfelder et al., 2005). However, due to the limited number of current applications for heavy ion low energy cross-sections (below 100 keV/u) there hasn’t been an interest in measuring these cross-sections. To circumvent this lack of experimental data, some works have used a method known as Classical Trajectory Monte Carlo (CTMC) for the calculation of charge exchange cross-sections for carbon ions (Liamsuwan et al., 2011; Liamsuwan & Nikjoo, 2013b) for energies down to 1 keV/u.
The resurgence of Boron Neutron Capture Therapy (BNCT) (Malouff et al., 2021; Nedunchezhian et al., 2016) has renewed interest in obtaining low-energy lithium ion (Li) cross-sections. BNCT works by exploiting the high capture cross-section of thermal neutrons (0.025 – 1 eV) by 10B (3990 barns), which is significantly higher than that of hydrogen (0.33 barns) and nitrogen (1.7 barns) found in biological tissue (Jin et al., 2022; Malouff et al., 2021). When a 10B atom captures a neutron, one of two fission reactions (Table 1) can occur (Barth et al., 2005; Hopewell et al., 2011). In both reactions, an alpha particle and a lithium ion are ejected in opposite directions from one another. The linear energy transfer (LET) of the fission products is 150 keV μm−1 and 175 keV μm−1 for the alpha and lithium particles, respectively. BNCT is a radiotherapy modality whose first clinical use dates back to 1951 (Farr et al., 1954). However, its clinical use was abandoned due to the appearance of adverse effects on patients, mostly attributed to the cytotoxicity of the boron-based drugs of the time. With the development of less cytotoxic second-generation boron-based drugs in the form of boron phenylalanine (BPA) and sodium borocaptate (BSH) (Barth et al., 2005) the interest in BNCT was reignited.
Table 1:
Boron neutron capture channels with occurrence probabilities.
| Channel | 7Li3+ Energy | 4He2+ Energy | γ Energy | Probability | |
|---|---|---|---|---|---|
| 10B + n → | 1 | 0.84 MeV | 1.47 MeV | 478 keV | 93.7 % |
| 2 | 1.02 MeV | 1.77 MeV | - | 6.3 % |
One of the main advantages of these new-generation drugs is their selective uptake by tumor cells as compared to normal tissue cells. This, along with the short ranges of the particles produced in the BNC process (5 um and 9 um for Li and alpha ions, see Table 1) allows to deliver doses to highly localized and targeted tumoral volumes while avoiding surrounding healthy tissues, overall increasing the therapeutic window. With different boron-based drugs accumulating differently at the cellular level (BPA accumulating in the cell cytoplasm and outside the cell and BSH accumulating on the cellular membrane and outside the cell), the flexibility of BNCT to target different tumor types has increased. Because of these reasons, BNCT has been recognized as an effective radiotherapy modality for treating locally invasive tumors, for example, head and neck and brain tumors. For instance, BNCT achieved a 5-year overall survival rate of 58% in patients with grade 3 and 4 glioblastoma multiforme (Barth et al., 2005).
An approach that has been used to study the microdosimetry of the ions ejected by the boron neutron capture (BNC) process involves the use of condensed history Monte Carlo codes (Horiguchi et al., 2015; Hu et al., 2020; Islam et al., 2017; Kumada et al., 2004; Mukawa et al., 2011). However, condensed history Monte Carlo must be used with caution at the sub-micrometer level, with reported differences against track structure of around 10–20% for electrons (Kyriakou et al., 2019). Although these differences have not been studied with heavier particles, they might be affected by the complexity of ionization distributions characteristic of heavier particles. This means that we could expect larger discrepancies as the atomic number of the ion increases. Although the results obtained in these previously mentioned works were in good agreement with experimental data, the use of such methods that omit charge-exchange processes is not recommended for quantities that rely on the spatial distribution of interactions such as explicit DNA damage simulations (D-Kondo et al., 2021; Meylan et al., 2017; Ramos-Mendez et al., 2021) or radiation chemistry simulations (Plante, 2011; Ramos-Mendez et al., 2021). In both cases, the lack of detail in the simulations at the nanometric scale may lead to inaccuracies in these calculations. In a previous work, we conducted an analysis of the microdosimetry of both alpha particles and Li ions of BNCT energies (Han et al., 2023). Such study achieved a good agreement with experimental results for BPA and BSH microdosimetry experiments. However, the use of an effective charge factor to create a unique charge state for Li that encompassed all types of interactions that lead to primary particle energy loss (ionization, excitation, charge exchange and elastic scattering) went against the core principles of the track-structure approach. As such, those scaled cross-sections were not suitable for their incorporation into the main Geant4-DNA code.
In this work, we present a new set of cross-sections needed to simulate low-energy Li ions in MCTS codes for pure liquid water, which include ionization, excitation, and charge exchange processes. The cross-sections were obtained via charge scaling procedures for ionization and excitation and with the CTMC approach for charge exchange processes. We validated our cross-sections by calculating macroscopic quantities in the form of stopping power, CSDA range, and mean ion charge. We then compared the predicted biological efficiency of the ions involved in BNC using microdosimetry via lineal energy spectra analysis and nanodosimetry via ionization cluster size distribution analysis. For the microdosimetry calculations we took into account the different cellular concentrations of BPA and BSH following the same approach from a previous study (Han et al., 2023). Both drug cellular concentrations come from experimental work (Sato et al., 2018), which was used as a reference. Nanodosimetry calculations were conducted by obtaining the ionization cluster frequency distributions (ICSDs) in biologically relevant geometries. These ICDS were compared against similar ones using the total ionization cross-sections from the previous study (Han et al., 2023) to account the differences between the two methods. Simulations were conducted using Geant4-DNA/TOPAS-nBio (Incerti, Baldacchino, et al., 2010; Schuemann et al., 2019) and the results were compared against available theoretical, experimental, and simulation data.
2. Methodology
2.1. Lithium-Ion Ionization And Excitation Cross-Sections
For ions heavier than alpha particles, ionization and excitation models used for MC simulations often rely on the use of charge-exchange factors applied to proton cross-sections (Friedland et al., 2017; Schmitt et al., 2015). The scaling method is often based on Barka’s effective charge factor (Barkas, 1963). The approach consists in obtaining an average effective charge as a function of the particle velocity, that accounts for the different charge states of the ions. In this work, however, we followed the procedure reported in (Dingfelder et al., 2005), in which they calculated the ionization and excitation cross-sections for “dressed” or “bare” ions using:
| (1) |
Where is either the ionization or excitation cross-sections for protons, is the particle velocity and, is the effective charge of the ion:
| (2) |
Where Z is the atomic number of the ion and S(R) is the screening factor due to the electrons orbiting the ion observed at a distance R from the ion nucleus. In the work of Dingfelder (Dingfelder et al., 2005), a linear combination of hydrogenic wave functions of the orbiting electrons was used to describe the screening factor for alpha particles (Z = 2). However, for higher values of Z the number of terms increases in a non-linear manner due to the possible excited electrons orbiting outer shells. In consequence, instead of using the same approach for Li ions, we used the effective charge factors from Garvey (Garvey, 1975). Thus the screening factor was calculated using:
| (3) |
where N is the number of electrons orbiting the ion, and the parameters η and ζ are obtained using the Hartee-Fock theory for Z up to 54. They can be obtained using the following relationships:
| (4) |
| (5) |
where the factors , , , and were taken from Table1 of (Garvey, 1975). To evaluate the effective charge, the adiabatic interaction radius was used given by the expression:
| (6) |
where is the electron energy traveling with the same speed as the ion, and is the Slater’s effective charge of the electron in the outermost shell of the ion (Slater, 1930). We applied these equations to calculate the ionization and excitation cross-sections for lithium ions. The term was used to fit the stopping power values to those of the ICRU, for lithium it has the value of 0.05 for all charge states.
This model is valid for all ions and their different charged states for energies ranging from 100 eV/amu to 1000 MeV/amu and for Z up to 54, which is the maximum value in the Table 1 of Garvey et al., 1975.
2.2. Classical Trajectory MC Charge Exchange Cross-Sections
In this work, charge exchange cross-sections for Li were calculated using the Classical Trajectory Monte Carlo (CTMC) (Hirschfelder et al., 1936). Due to the lack of experimental data for ions heavier than helium at low energies (< 10 MeV), and the complexity of the quantum mechanics equations, CTMC is the preferred method to calculate charge-exchange cross-sections for low energy heavy ions. This method has been successfully used for carbon ions for down to 12 keV/u (Liamsuwan & Nikjoo, 2013a) as well as other heavier ions within limited energy ranges(Olson & Salop, 1977). It works by solving a three-body problem using Runge-Kutta (RK) methods (Fehlberg, 1970) applied to the following Newtonian relationships:
| (7) |
where and are either the active electron, the target (water atom) or the projectile (Li), is the mass, is the position, is the speed and is the effective charge (equation 2), and is the distance between particle and . We developed a CTMC tool in C++ using the boost mathematical libraries (Karlsson, 2005). The RK variant used was the Runge-Kutta Fehlberg 78 method (Fehlberg, 1994) with a global error of 1 × 10⁻¹⁰, and local error of 1 × 10⁻⁷. The approach followed to determine the appropriated initial conditions for such differential equation is detailed elsewhere (Liamsuwan et al., 2011; Tran et al., 2016)
To reduce computation times, we calculated only charge exchange (charge increase and charge decrease) cross-sections for the energy ranges of 7 keV to 70 MeV (1 keV/u to 10 MeV/u) using ten logarithmically evenly spaced energy points. Charge exchange cross-sections were separated per charged state.
Table 3 summarizes the set of cross-sections used in this work alongside their energy ranges. Both ionization and excitation cross-sections were obtained by the procedure described in Section 2.1 while charge exchange cross-sections were obtained by the procedure described in Section 2.2. Charge-exchange cross-sections are kept constant below 7 keV until the lowest ionization energy.
Table 3:
Li Cross-Section models used in this work. Ionization and excitation models were extended from original Geant4-DNA methods. Charge exchange models were implemented based on the results from the CTCM approach.
| New Model | Based on | Applicable Energy Ranges |
|---|---|---|
| G4DNALiRuddIonizationModel | G4DNARuddIonizationExtendedModel | 700 eV – 7 GeV |
| G4DNALiMillerGreenModel | G4DNAMillerGreenExcitationModel | 70 eV – 3.5 MeV |
| G4DNALiBornExcitation | G4DNABornExcitationModel | 3.5 MeV – 700 MeV |
| G4DNALiChargeIncrease | - | 7 keV – 70 MeV |
| G4DNALiChargeDecrease | - | 7 keV – 70 MeV |
2.3. Validation
Due to the lack of experimental cross-sections for low-energy Li in water, we conducted an indirect validation by comparing the stopping power, range, effective charges, micro and nanodosimetry quantities against ICRU data and other Monte Carlo software results (Han et al., 2023; Islam et al., 2017). We used TOPAS-nBio built on top of Geant4 versions 3.9 and 10.07.p03 to perform all our simulations. To that end, we extended the “G4DNARuddIonizationModel”, “G4DNAMillerGreenExcitationModel” and “G4DNABornExcitationModel” Geant4-DNA physics models to include the scaling procedure for the different charge states of Li and included two new classes for both the lithium charge increase and charge decrease. We conducted the same tests using alpha particles as both a validation of our implementation and a way to obtain all BNCT-relevant particles.
2.3.1. Stopping Power
We compared the total stopping power for alpha particles in order to test our implementation against the ICRU 49 report estimates (International Commission on Radiation Units and Measurements, 1993). Li was compared against both the ICRU 73 report data (Bimbot et al., 2005) and the SRIM software (Ziegler & Biersack, 2010). Simulations were conducted using the “static” particle velocity approach, which allows for the transport of primary particles (electrons and gammas not included) without energy loss but allowing for changes to the charge state of the primary particle. This allows for the calculation of stopping power without taking into consideration energy loss effects, which may affect the stopping power value. Using the static approach avoided the use of small track segments, decreasing the computation time. The geometrical setup was a 1 m3 water cube, big enough to contain 10,000 steps of the primary particle. In total, we simulated the energy ranges of 0.4 keV to 40 MeV for alphas and 0.7 keV - 70 MeV for Li (0.1 keV/u to 10 MeV/u). Stopping power values that do not include the contribution of charge exchange processes for the different charge states of alpha particles and Li were also calculated as a comparison to showcase the differences due to simulation detail.
2.3.2. CSDA Range
Range was calculated using the continuous slowing down approximation (CSDA) with the stopping powers calculated in section 3.2. The geometrical setup of the simulation was a 1 m3 water cube. Alpha particle ranges were compared against the ASTAR database whereas Li ranges were compared against SRIM software.
2.3.3. Mean Charge
We calculated the mean charge using the static particle velocity approach. For each energy, we let the primary particle, and its different charged states perform 10,000 steps and store the sum of the particle charge. Then we divided that quantity by the number of steps to get the average charge for a specific energy. The geometry setup was the same as the stopping power calculations, i.e., a 1 m3 water cube big enough to contain all the different steps for all the energy ranges. We compared the simulation results against the theoretical Barkas’s scale factor.
2.4. Microdosimetry
Following the approach from our previous work (Han et al., 2023), the lineal energy frequency and dose distribution spectra, and , respectively, were calculated using micrometer-sized volumes. The geometry used for the simulation was a 3 × 3 × 3 array of cells (Figure 1).
Figure 1:
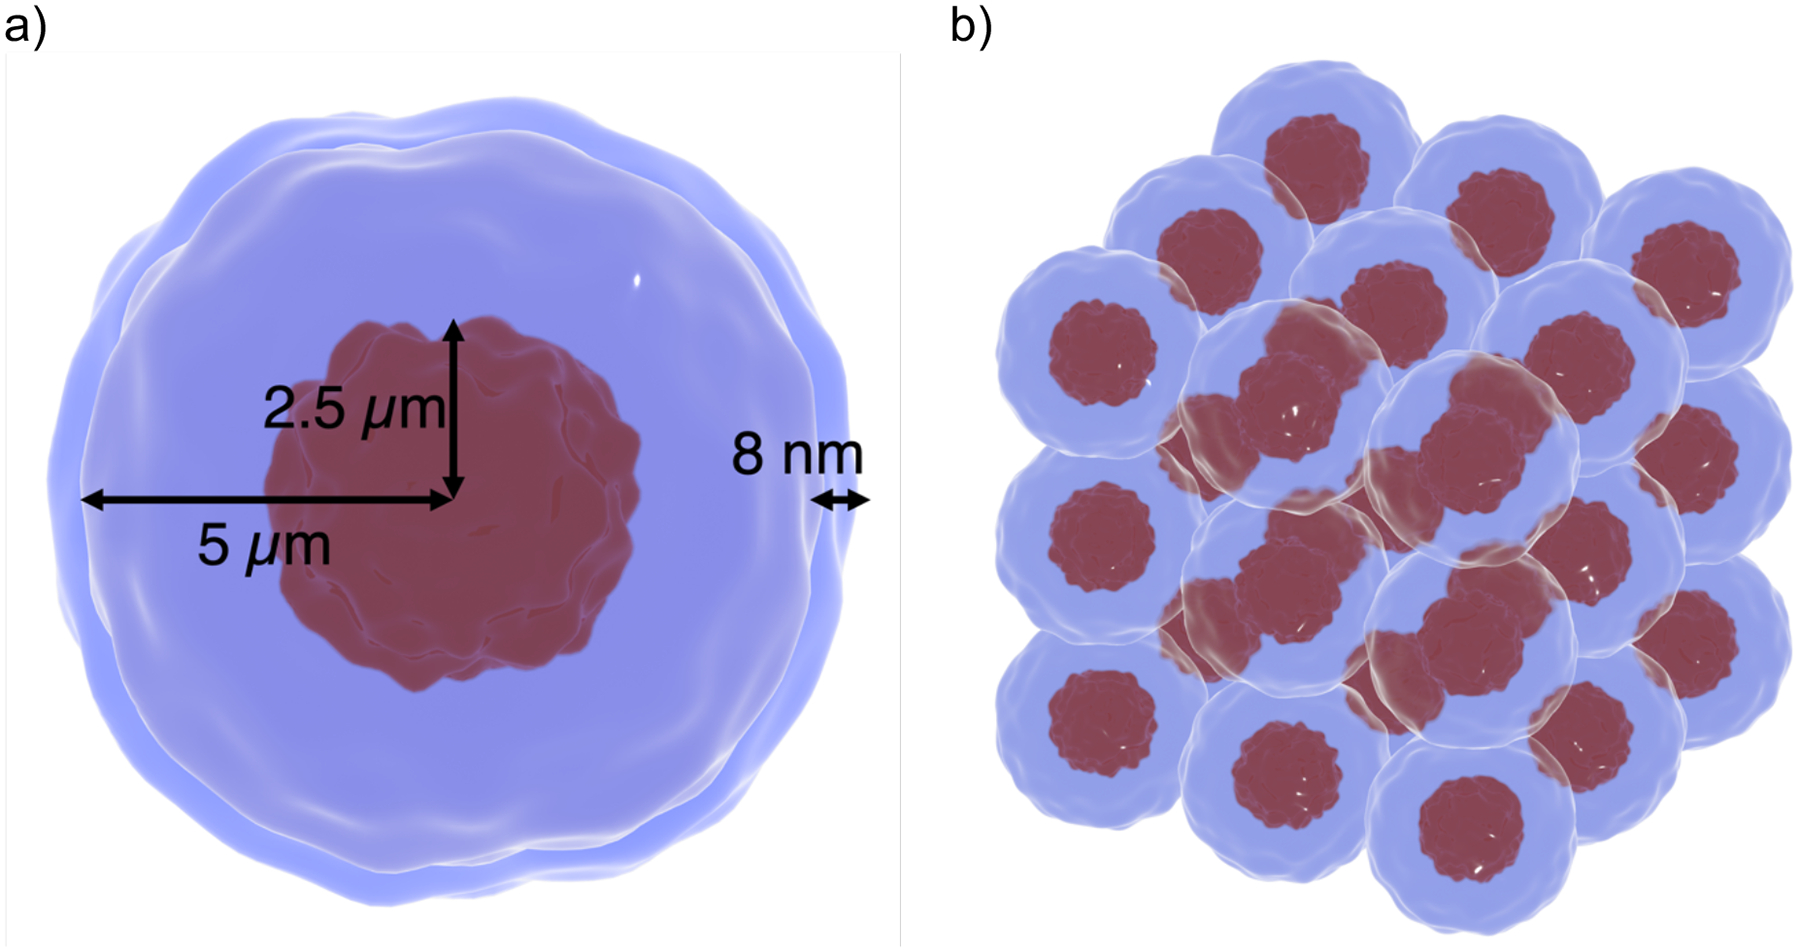
Microdosimetry geometric setup schematic. a) Single cell dimensions: 2.5 μm radius nucleus with a 5 μm radius cytoplasm and 8 nm thick membrane. b) Cell array for the simulation. Cells were spaced by a distance of 10.016 μm between their centers. Simulation volumes were modeled as perfect spherical volumes.
Each cell was modeled as three concentric spherical regions denoting the cell nucleus, cytoplasm, and membrane. The nucleus had a 2.5 μm radius, the cytoplasm 5 μm radius and the membrane was 8 nm thick. Spectra scored were limited to particles incident on the nucleus. Three particle sources were considered for the microdosimetry simulations. These were a pure alpha particles, pure Li, and pairs consisting of both particles directed in opposite directions. The energies of the particles were determined by sampling the BNC channel with the probabilities shown in Table 1. Gamma particles produced by neutron capture reactions were ignored for the case of channel 1 due to its relatively high energy (with a negligible interaction cross-section) for the dimensions of the simulation. The initial positions of the ejected alpha particles and Li ions were randomly sampled at the intercellular, cytoplasm, or cell membrane regions for a total of three distinct lineal energy spectra. The direction of the primary particles was isotropic. The sampling volumes for the spectra calculation were 2.5 μm spheres. We compared our results with previously published results (Han et al., 2023) and the frequency mean lineal energy and mean dose mean lineal energy values from Sato (Sato et al., 2018). To convert averaged mean lineal energy from our separate spectra simulations we used the following formulas:
| (8) |
| (9) |
where is the weight factor representing the concentration of the boron-based drug in the specific region. The regions used on this work were intercellular (outside of the cell membrane) cell membrane and cytoplasm. it’s the frequency mean lineal energy of the particles when they are generated in the region , and it’s the dose mean lineal energy when they are generated in the region . The different weight factors and regions for the two boron-based drugs are summarized in table 2:
Table 2:
BPA and BSH cellular concentration distributions and weights.
| BPA | BSH | |||
|---|---|---|---|---|
| Q 1 | Cytoplasm | 22.14% | Intercellular | 51.41% |
| Q 2 | Intercellular | 77.86% | Membrane | 48.59% |
Lineal energy frequency distributions were obtained using 10 batches of 100,000 primary events to achieve a statistical uncertainty of less than 1.5% for both alpha particles and Li.
2.5. Nanodosimetry
Normalized ionization cluster size distributions (ICSDs) per primary particle were calculated for Li ions with energies ranging from 1 keV – 2 MeV. To improve the correlation of these distributions with biological effects, the regions used to score the ionization cluster sizes resembled biologically relevant geometries. Following methods reported elsewhere (Faddegon et al., 2023; Ramos-Méndez et al., 2018), we irradiated a cubic volume of 50×50×50 nm3. The cube was filled with 1800 smaller cylinders 3.4 nm long by 2.3 nm in diameter (Figure 2a), where the ionization clusters were scored. These dimensions approximate DNA segments of 10 base pairs in length, where complex damage may occur. The radiation source was placed 10 nm away from the cube to allow for the Li ions to equilibrate to their preferred charge state before impact. The cylinders were placed and oriented randomly within the enclosing cube, avoiding any overlaps. We used this geometry to calculate of Li ions with a set of logarithmic-spaced energies ranging from 1 keV – 2 MeV.
Figure 2:
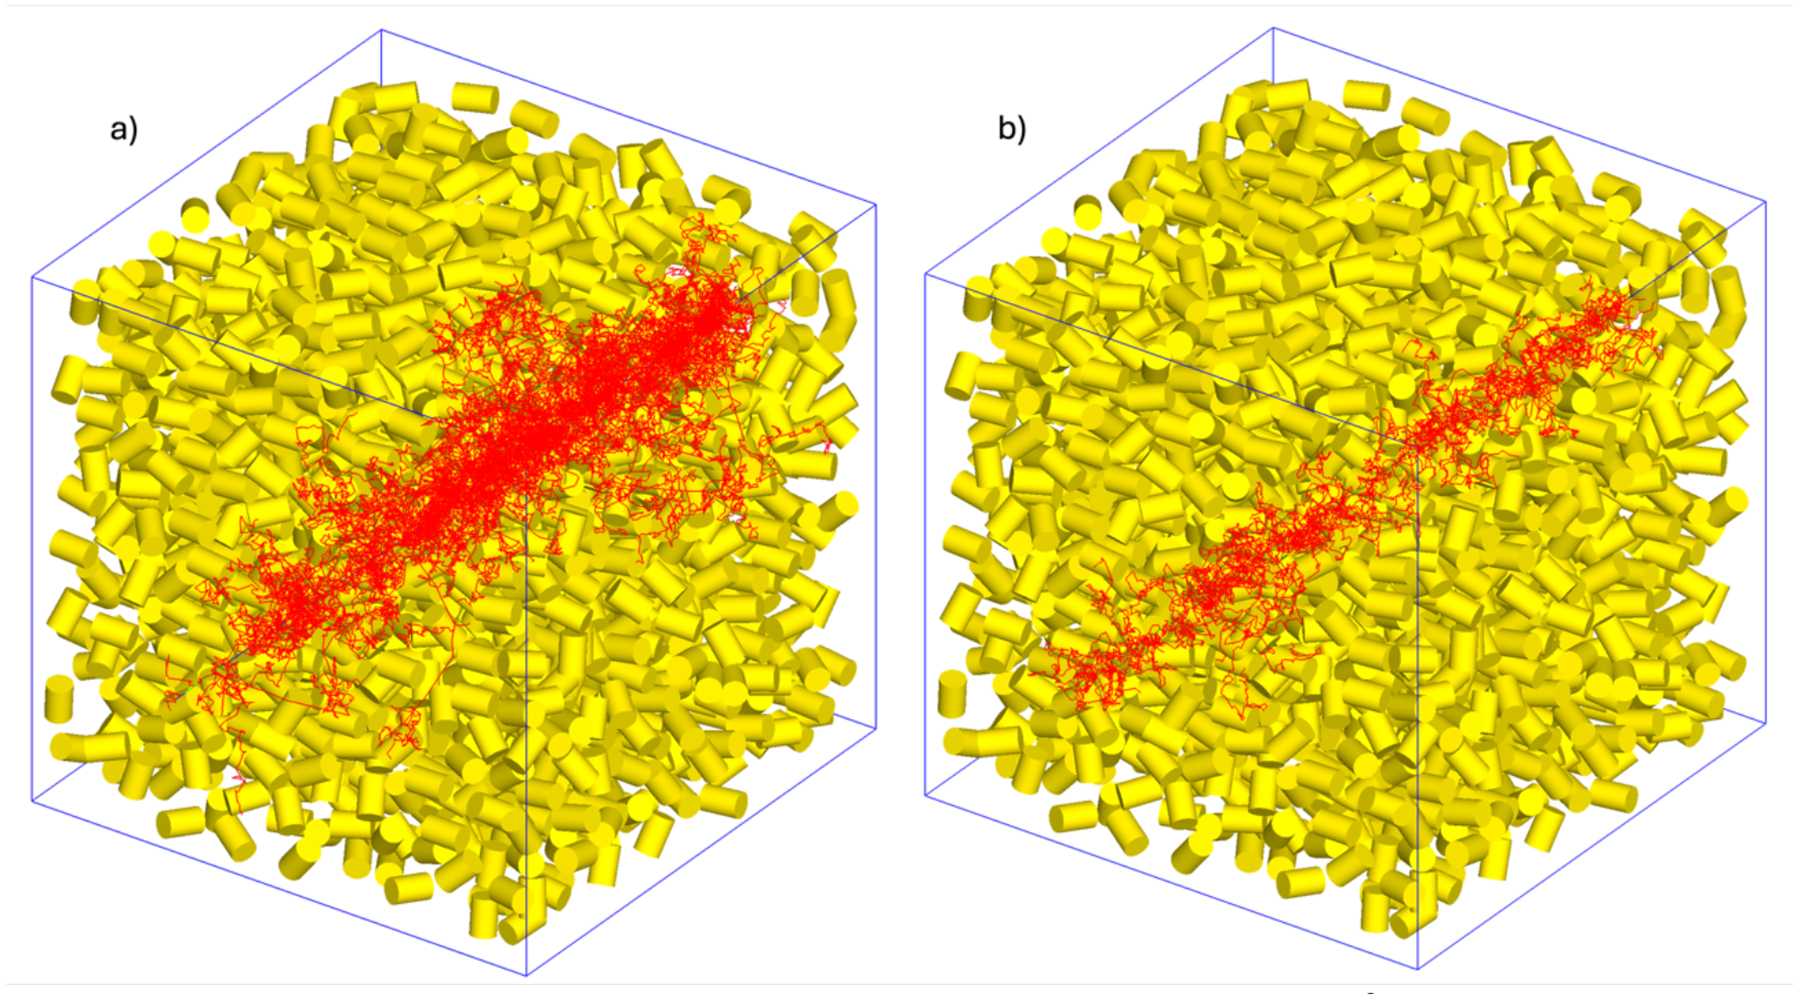
Nanodosimetry geometric setup. A 50×50×50 nm3 cube of water with embedded cylindrical scoring regions, irradiated by a a) 2 MeV (256 keV/u) and b) 80 keV (11.4 keV/u) Li ion respectively.
We compared our results against the cross-sections from our previous work which used a modified effective charge scaling factor from Schmitt (Schmitt et al., 2015). From these ICSDs, we also calculated three different ionization detail parameters with k=2, k=5 and k=7 and NK with k=1. These parameters are collapsed representations of the ICSD along particle tracks, defined as:
| (10) |
| (11) |
where v is the ionization cluster size. In other words, Fk is the probability to create a cluster of k or more ionizations in the nanoscopic cylinders described above per source particle. The Ip parameters were calculated using ICSDs normalized so that the sum of the frequency distributions was equal to unity. In such a representation, F1 is equal to unity and N1 is equal to the expected value of the frequency distribution.
The Ip considered in this study have been shown to closely associate with different biological endpoints independently of the particle; N1 with cell inactivation cross-sections (Conte et al., 2017), F2 with DSB cross-sections (Nettelbeck & Rabus, 2011), F5 and F7 with cell survival in aerobic and hypoxic conditions, respectively (Faddegon et al., 2023).
3. Results
3.1. Charge Exchange Cross-Sections
Charge exchange cross-sections due to electron capture and loss as a function of the energy (from 7 keV to 7 MeV) calculated using the CTCM method are shown in figure 3. The total capture cross-sections decrease with the projectile (lithium ion) energy. As the particle velocity increases, the interaction time between the electron bound to the water molecule and the projectile decreases, thus lowering the probability of interaction. There is an energy threshold of approximately 10 MeV for Li, after which the projectile velocity is too high for the electron to attach to it. Total charge increases cross-sections (Figure 3b) decrease in the 7 keV to 100 keV range followed by an increase up to 1–10 MeV, decreasing after that. Charge decreases cross-sections behave consistently for the number of repetitions used on this work, whereas charge increase exhibits some noise at the 104 to 105 eV.
Figure 3:
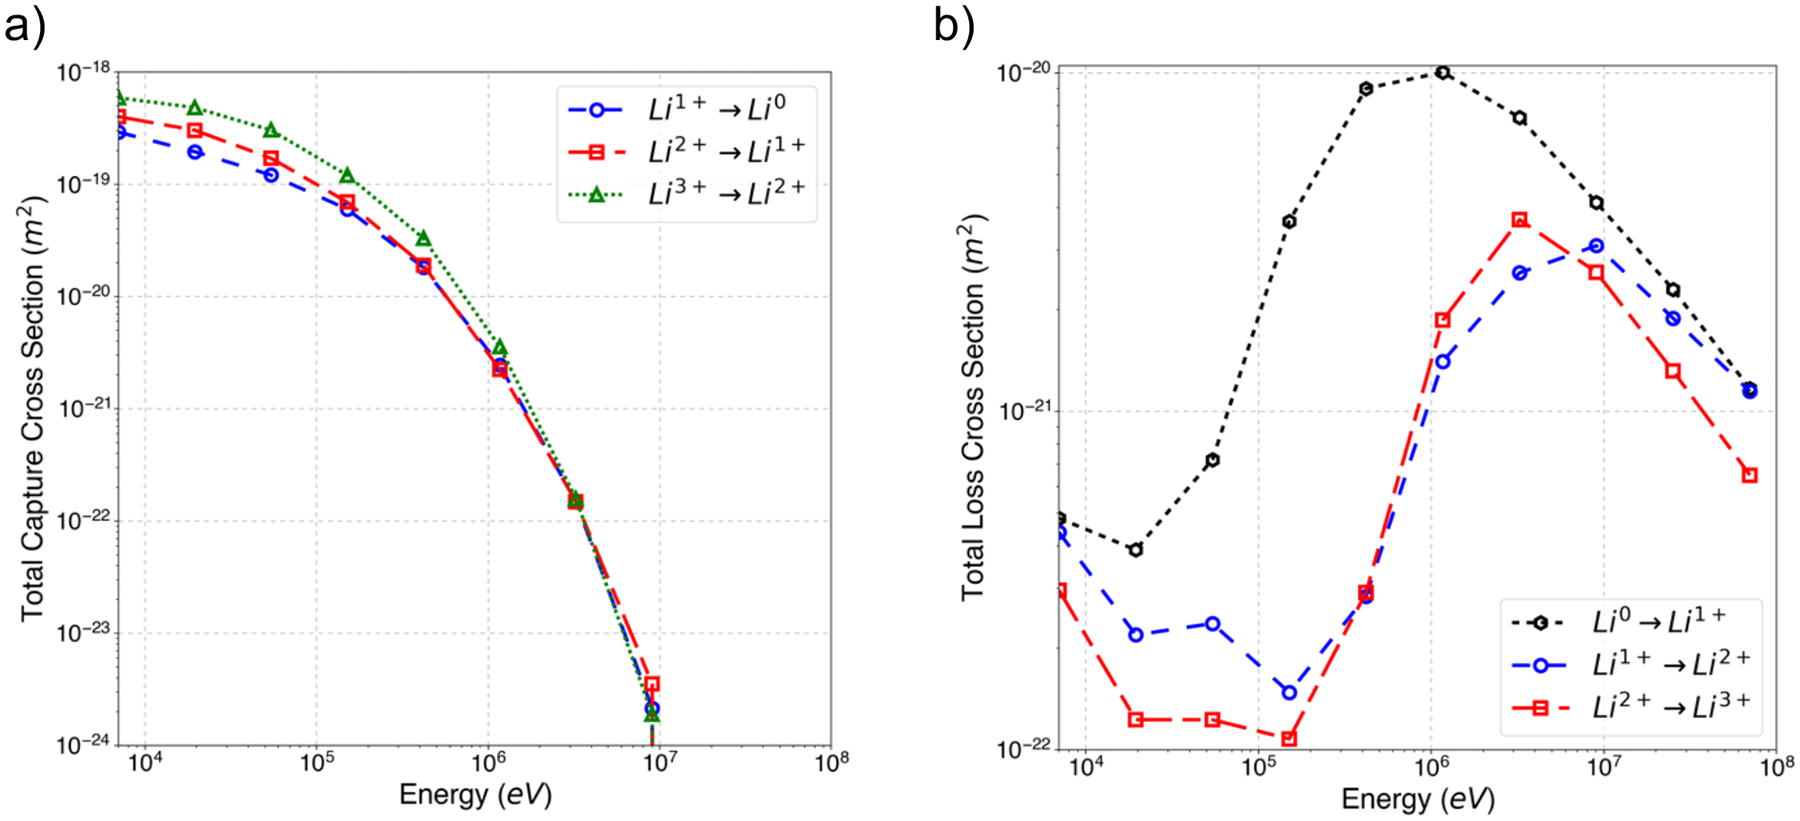
Lithium charge exchange cross-sections calculated with the CTCM method. a) Charge capture/loss cross-sections for Li1+→Li0 (blue circles), Li2+→Li1+ (red squares) and Li3+→Li2+ (green triangles) and b) charge loss/increase for Li0→Li1+ (black hexagons), Li1+→Li2+ (blue circles) and Li2+→Li3+ (red squares).
3.2. Macroscopic
Alpha and Li particle stopping powers calculated with Geant4-DNA are shown in figures 4a and 4b, respectively. Alpha particles stopping powers were compared against those from the NIST ASTAR database for liquid water. Figure 4b includes simulation data that use the original Geant4-DNA cross-sections (G4RuddIonisationExtendedModel) to showcase the impact of the new cross-sections. Statistical errors were kept below 0.05% for both alpha particles and Li. The mean percentage difference (MPD) between Geant4-DNA and ASTAR for alpha particles was of 4.6%. For Li, the MPD between the original Geant4-DNA cross-sections and the reference data from ICRU and SRIM was 33.78% and 54.08% respectively. When using the charge exchange cross-sections computed in this work these differences decreased to 6.9% and 24.9%.
Figure 4:


Macroscopic results of the BNC recoil ions. a) Alpha particles stopping power, showing results for the ICRU ASTAR database (red squares) and Geant4-DNA (blue circles with dashed lines). b) Stopping power of Li with the results from this work (green triangles with dashed lines), original Geant4-DNA cross-sections (blue circles with dashed lines), ICRU reports 49 and 73 (red squares) and SRIM (black pentagons). c) CSDA range of alpha particles with results from Geant4-DNA (blue circles with dashed lines) and ICRU ASTAR (red squares). d) CSDA range of Li showing the results of this work (blue circles with dashed lines), Geant4-DNA original cross-sections (green triangles with dashed lines) and SRIM (red squares). e) Mean particle charge of alpha particles with results from Geant4-DNA (blue circles with dashed lines) and Barka’s effective charge (black dashed line). And f) mean particle charge of Li with results from this work (blue circles with dashed line) and Barka’s effective charge (black dashed line).
CSDA ranges for alpha particles and Li calculated with stopping powers presented in this section are shown in Figure 4c and 4d. Alpha particle results are compared against the CSDA ranges from the NIST ASTAR database for liquid water. CSDA ranges for Li are shown alongside the original Geant4-DNA cross-sections. Statistical errors for alpha particles and Li were kept below 0.12%. The MPD between ASTAR and Geant4-DNA estimates was 7.4%. For Li, MDP were 621% for the original Geant4-DNA cross-sections, which decreased to 34% when using the cross-section obtained in this work.
The particle mean charge as a function of the Ion energy are shown in Figure 4e and 4f for alpha particles and Li respectively. Statistical errors were kept below 0.15%. Barka’s effective charge is shown alongside simulation results as a comparison point. Both plots show that instead of a smooth transition between the different charge states with increasing energy, particles tend to be at the extremes with rapid changes at a specific energy threshold.
3.3. Microdosimetry
Lineal energy frequency and dose distributions () spectra for alpha particles, and a combination of alpha particles and lithium ions with energies sampled from Table 1 are shown in Figure 5a, 5b, 5c and, 5d respectively. Results are compared against previous results from (Han et al., 2023). Li reference data corresponds to total ionization effective charge-scaled cross-sections. Simulation results were within 1.5% of standard deviation for all the lineal energy frequency distributions.
Figure 5:
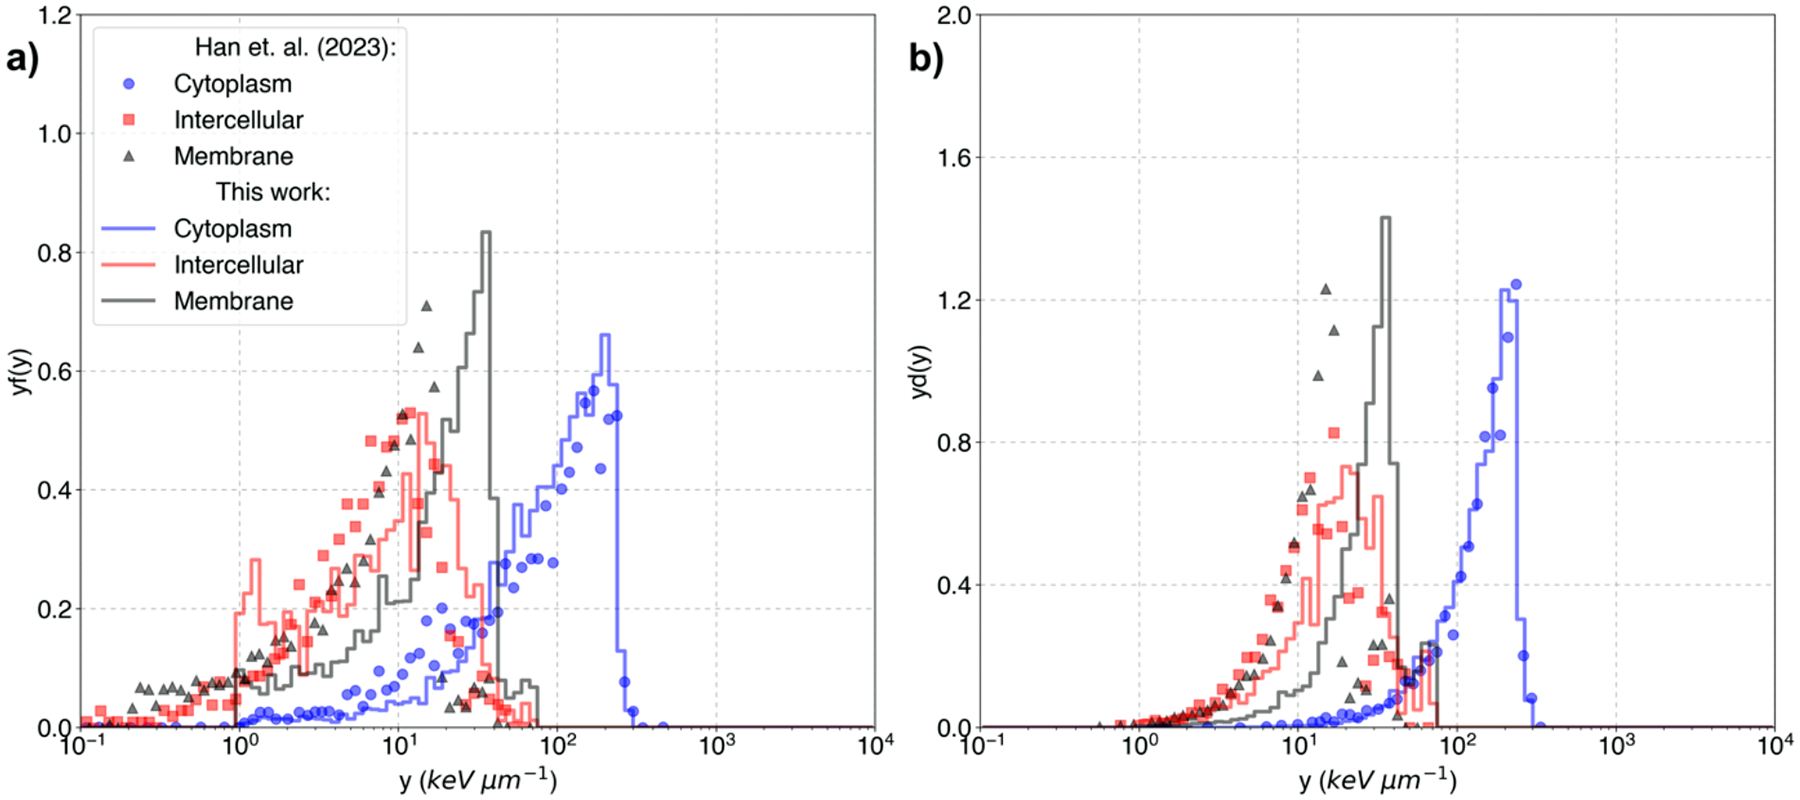

Lineal energy spectra of Li for (a) frequency weighted lineal energy (yf(y)) (b) dose weighted lineal frequency (yd(y)). c) Frequency-weighted lineal energy (y(f(y))) and d) dose-weighted lineal frequency (y(d(y)) for both alpha particles and Li. Results are shown for the boron-based drug accumulated on the cytoplasm (blue line), intracellular (red line), and membrane (black lines). Reference data for the cytoplasm (blue circles), intercellular (red squares) and cell membrane (black triangles) are from (Han et al., 2023).
Figure 5a and 5b results showcase differences for the different Li cross-section approaches. Differences in the lower end in the intercellular and cell membrane configurations are due to the reduced ranges of the new cross-sections. While the cytoplasm particle emission configuration shows similar results within statistical uncertainties.
Figure 5c and 5d presents the results for the BNC configuration, in which we took simulations in which one event was taken as both one alpha particle and one Li ion isotropically ejected in opposite directions. In the frequency-averaged lineal energy spectra, a second peak appears for the Li configuration in the membrane configuration using the new cross-sections but is not present in the other two configurations (cytoplasm and intracellular). Li ranges are 3.7 and 4.36 μm for 0.84 and 1.02 MeV respectively (channels 1 and 2) when using the new cross-sections. Thus, the probability of Li reaching the nucleus is greatly reduced at the cellular membrane, having to traverse at least 2.5 μm. This gives alpha particles the advantage with their ranges of around 8 and 9.6 μm at the cellular membrane and beyond. The results obtained in Figure 5 support this result by showing that alpha particles predominate the lineal energy frequency distributions.
Table 4 summarizes the and mean lineal energies including the unweighted pure particles and mixed configurations and weighted according to the different boron-based compounds. Results for the pure Li differ from the previously published values of Han et. al. within 57% for and 56% for . Results for alpha particles agree with the work of Han within one standard deviation, with differences attributed to the batch method we used on this work instead of the full 3 million histories used in Han’s work. The results for the BPA and BSH boron-based drugs are within statistical differences. This suggests that although there are intrinsic differences in the lithium component of the lineal energy spectra, at the micrometric level, alpha particles are the most significant.
Table 4:
Frequency mean lineal energy and dose mean lineal energy values. BPA and BSH averaged lineal energy include data for the charge exchange (this work), charge scaled (Han et al., 2023) and experimental results of Sato (Sato et al., 2018). Uncertainties are one standard deviation.
| Cytoplasm | Membrane | Intercellular | ||||
|---|---|---|---|---|---|---|
| (keV/μm) | (keV/μm) | (keV/μm) | (keV/μm) | (keV/μm) | (keV/μm) | |
| Alpha (This work) | 159.19 ± 4.24 | 211.16 ± 6.83 | 140.14 ± 4.32 | 195.02 ±7.22 | 105.42 ± 4.07 | 158.67 ± 7.49 |
| Alpha (Han et.al.) | 169.67 ± 7.76 | 223.28 ± 11.85 | 149.15 ± 8.29 | 205.62 ± 14.28 | 108.55 ± 5.31 | 159.96 ± 9.51 |
| Lithium (This work) | 114.12 ± 3.51 | 158.92 ± 5.88 | 21.91 ± 0.94 | 31.47 ± 1.6 | 12.61 ± 0.97 | 21.99 ± 2.47 |
| Lithium (Han et. al.) | 100.24 ± 5.84 | 155.20 ± 11.44 | 9.31 ± 0.27 | 13.92 ± 0.62 | 5.79 ± 1.61 | 10.97 ± 3.69 |
| Mixed | 141.12 ± 2.77 | 195.09 ± 4.77 | 101.35 ± 2.66 | 182.58 ± 6.16 | 92.24 ± 3.35 | 156.59 ± 6.97 |
| BPA | BSH | |||||
| Charge Exchange | Charge Scaled (Han et. al.) | Sato | Charge Exchange | Charge Scaled (Han et. al.) | Sato | |
| (keV/μm) | 130.30 ± 2.25 | 137.24 | 118.43 | 96.67 ± 2.18 | 106.87 | 120.32 |
| (keV/μm) | 189.05 ± 3.26 | 199.64 | 213.55 | 215.20 ± 4.51 | 182.73 | 198.21 |
3.4. Nanodosimetry
Figure 6 compares the cross-sections of this work with the total ionization scaled cross-sections previously available in Geant4-DNA on the a) ICSDs, b) the first moment of the ICSDs and c) the frequency of clusters of two or more ionizations per primary ion. The mean percentage differences of the distributions of Figure 6a are 76%, 61%, 30% and 344% for the 3, 7, 66, 286 keV/u Li-ions, respectively. The N1 values differed by up to 35%, with the maximum difference at 1.42 keV/u (the first data point). values for the two approaches (Figure 6c) are significantly different at lower energies and converge within statistical uncertainties near the maximum value, at around 11.42 keV/u. The difference at 1.42 keV/u was of 9.0%, well outside of the statistical uncertainty. Figure 6c showcases a well-known behavior in the region above 90 keV (12.82 keV/u) (Ramos-Méndez et al., 2018), caused by the combined effect of direct and indirect ionizations in the small cylinders. In the previously cited work, a continuous increase in the 1–10 MeV/u of oxygen ions for was observed. However, the effect that comes below 1 MeV/u remained unnoticed due to the energy limits of such heavier ions. In this work, thanks to the extension of the cross-section to lower energies, a global maximum localized at around 11.42 keV/u was observed for all Ip investigated, independent of the cross-section sets used for the simulation.
Figure 6:

Normalized ICSDs and Ips calculated with charge exchange cross-sections (solid lines) and total ionization scaled cross-sections (dashed lines): a) ICSDs for different Li-ion energies. b) First moment of the ICSDs (N1) as a function of energy c) Frequency of clusters with two or more ionizations (F2) for different Li-ion energies. Vertical bars are 1 standard deviation statistical uncertainties.
Figure 7 shows the and parameters as a function of the Li-ion energy. In both cases, results from both approaches converge above 7.14 keV/u. Below 7.14 keV/u, differences are within 45% and 65% for and , respectively. Results show a maximum peak between 5.71 – 7.14 keV/u, which is in the decreasing region of the stopping power plots (Figure 4b).
Figure 7:

and values for different Li-ion energies. Results are shown for the charge-exchange cross-sections (red line) and the total ionization scaled cross-sections (dashed blue lines). Vertical bars are 1 standard deviation statistical uncertainties.
4. Discussion
We calculated the charge exchange cross-sections for Li in pure liquid water using the CTMC method. Results of simulations using this new set of cross-sections were compared against the stopping power and CSDA range from ICRU as a form of validation. We also calculated the lineal energy spectra with frequency mean lineal energy and dose mean lineal energy, and ionization cluster size distributions to study the impact of the new cross-sections at microscopic to nanoscopic scales as compared to the pure ionization charge scaled cross-sections.
Results for stopping power showed significative differences between the original Geant4-DNA cross-sections and the references. Such differences were expected since those cross-sections were forced for low energies, with their lower energy range being about 1 MeV/u (Francis et al., 2011, 2012; Incerti, Baldacchino, et al., 2010). Figure 4 however, show that even at 10 MeV, results diverge significantly due to the lower interaction probabilities which impacts energy loss, giving less stopping power and larger ranges. Differences between Geant4-DNA and ICRU stopping power data decreased from 81.93% for the pure effective charge ionization cross-sections to a 6.9% difference for the set of cross-sections presented in this work. As a consequence of the increase in stopping power from the new cross-sections, CSDA ranges decreased, obtaining a better agreement with ICRU.
Mean particle charge results (Figure 4e and 4f) show the difference between using effective charge factors against the real charge state of the ion. In this case, both alphas and Li share the same behaviors, with the exception that alpha particles have a very smooth continuous curve whereas Li exhibit a discontinuity at around 80 keV/u. This discontinuity is likely associated with the first valence electron in lithium, and it is only present in lithium because of its metallic properties. Which means that its first electron is free allowing it to conduct electricity.
Microdosimetric results for alpha particles agree within statistical uncertainties with our previous work. For Li statistically significant differences were found. Specifically, Li ions with the cross-sections of this work has a probability of depositing low energies (> 1 keV) in the cell nucleus but only when the primary generation happens at either the intercellular or the cell membrane regions. This is due to the difference in particle ranges between the two methods, whereas Li could have a maximum range of around 6 μm in the work of Han et al (scaled cross-sections), with the new set of cross-sections it’s closer to 3.6 μm. This significantly lowers the probability of an ion hitting the cell nucleus when it must travel at least trough the entire cytoplasm region, with radius equal to 5 μm or a travel distance of at most 2.5 μm. Due to this change in range, only particles that are generated relatively close to the cell membrane will transfer energy to the nucleus and their energy will be lower and thus depositing more energy per unit path length. This does not happen when the particles are created in the cell cytoplasm, in which case the results are identical to the effective charge method within statistical uncertainties. This suggests that both methods are statistically equivalent for energies with ranges lower than 2.5 μm. An overall increase in all the frequency mean lineal energy and dose mean lineal energy values for lithium was found when using the charge exchange cross-sections compared to our previous charge scaled method (Han et al., 2023). Ranging from 37%–58% and 2.34%–56% for and respectively, between the cytoplasm and the cell membrane regions. Differences in mean lineal energy distributions between the two spatial distributions of two boron-based drugs (BPA and BSH) agreed within one standard deviation with respect to our previous work and were within reasonable agreement with the results of Sato with a 10% difference which was also within 1 standard deviation. This suggests that, for the microdosimetric calculations of BNC in the cell nucleus, the contribution of the charge exchange process of Li is relatively low as compared to the contribution of alpha particles.
Nanodosimetry results show differences outside of the statistical uncertainties, exceeding a factor of 3 at 2 MeV (286 keV/u) Li-ion energy. This 2 MeV mark is where the Lithium charge starts to decrease (Figure 4f) due to the predominance of the charge decrease process (Figure 3a). Even though differences in the ICSDs were significant, the different Ips (Figures 6 and 7) all converged above 80–100 keV (11.42–14.28 keV/u). The reason they converge is due to the behavior of the ICSDs, where charge-exchange cross-sections predict that the smaller cluster sizes are more frequent with the larger cluster sizes less frequent (since the ICSD is normalized to unity) than those calculated using total ionization scaled cross-sections. The Ips converge at higher energy due to our choice of Ips, shown to have a close association with biological effects, with values dominated by the prevalence of smaller clusters and the convergence of the ICSDs at the smaller cluster size. The maximum found in the 60–80 keV (8.57–11.42 keV/u) energy range can be explained by two factors given by our models; 1) At the lower ion energies (~20 keV), the secondary electron energies are below the water ionization energy (~10 eV) (Perry et al., 2020), leading to thermalization (solvation) processes (Incerti et al., 2018). 2) As lithium energies decrease below this energy, the number of ionizations will also decrease according to their stopping power. The maximum then arises at the interface at which the low energy secondary electrons can generate one or two densely packed ionizations before undergoing solvation processes, but not enough energy to travel far from their generation point. These statements are supported by Figure 8a, which shows a bar plot with the frequencies of the different processes that the secondary electrons experience in a 503 nm3 cube. The average secondary electron energy of the ions was 1.9 ± 1.4, 9.3 ± 5.3, and 13 ± 10 eV for both approaches at the 20, 80, and 250 keV (2.85, 11.42, 35.71 keV/u) ion energy respectively. The maximum kinetic energy of the secondary electrons was of 5.94, 24.422 and 509 eV for the total ionization scaled cross section approach at the 20, 80 and 250 keV respectively and 6, 24 and 77 eV for the set of cross-sections from this work at the same energies respectively. Figure 8b doesn’t show charge-exchange processes because the ions equilibrate in the 10 nm distance between the source and the sensitive volume. Figure 8b lacks excitation processes for the total ionization scaled cross-sections because the approach assumes that all interactions are contained in one process.
Figure 8:

Frequency of physical processes for a) secondary electrons from the lithium ions and b) primary lithium ions. Electron processes shown include solvation (red), ionization (blue), excitation (green), and vibration excitations (yellow). Total ionization scaled cross-sections are shown with solid-colored bars while charge-exchange cross-sections are shown filled with diagonal lines. Lithium processes shown are ionization (red scaled cross-sections and blue for charge exchange) and excitation (green, only for charge-exchange). Processes that did not contribute significantly to the plots were left out. This includes electron attachment and charge exchange.
The results shown in Figure 7 suggest that for Li-ion energies above 60 keV, both approaches might be indistinguishable from one another when used for biological effect estimations. The remaining 60 keV of energy would be equivalent to 0.6 – 0.92 μm of range for the total ionization scaled and charge-exchange cross-sections respectively. However, this 45% to 65% difference between the two models is significant for its biological effect relationship. The ranges for the Li ions in the BNC energies will be of 4.36 and 3.77 μm for the 1.02 and 0.84 MeV respectively. When taking into account the cellular geometry of Figure 1, this would mean that a Li ion generated at the cellular membrane will have at most an energy of 240 or 114 keV for the 1.02 and 0.84 MeV initial energies respectively when it arrives to the cellular nucleus. These energies are low enough that they can be absorbed completely at the cell nucleus. This results in a different Ip at the cellular nucleus for the BSH drug distribution for the two different cross-sections approaches studied in this work. These differences are high enough to give a different predicted outcome for the cross-sections used in this work when compared against the total ionization scaled cross-sections.
Overall, in this work we present a set of low energy cross-sections for Li ions that explicitly simulate charge exchange cross-sections using results from the CTCM approach. Results derived from these cross-sections significantly differ from results using the current available cross-sections, calculated using effective charge scalation methods, at the macroscopic, microscopic and nanoscopic scales. The new cross-section led to a better agreement with available experimental and theoretical data as compared to current ones.
5. Conclusion
In this work, we provided a new set of lithium cross-sections for energies down to 700 eV. These new cross-sections correspond to the ionization, excitation, and charge exchange processes of every single lithium charge state. They were explicitly computed by the classical trajectory Monte Carlo method and partial charge scaling methods. Our results using these cross-sections show a closer agreement with ICRU stopping power and CSDA ranges (6.9% difference) than previous Geant4-DNA cross-sections (82% difference). This increase in “accuracy” is relevant for BNC applications, due to the low energy of the recoil ions produced which are very sensitive to energy losses. Differences in dosimetric evaluation at the micro and nanoscale were found using these two sets of cross-sections within 58% at the micro scale and 344% at the nanoscale. These differences were outside of the statistical errors, highlighting the importance of including the charge-exchange processes in BNC calculations.
Acknowledgments
D-Kondo N., Ramos-Mendez J., Faddegon B. and Schuemann J. were in part supported by the NIH/NCI RO1CA187003.
Ortiz R. and Faddegon B. were in part supported by the NIH/NCI R01CA266467.
Bibliography
- Agostinelli S, Allison J, Amako K, Apostolakis J, Araujo H, Arce P, Asai M, Axen D,Banerjee S, Barrand G, Behner F, Bellagamba L, Boudreau J, Broglia L, Brunengo A, Burkhardt H, Chauvie S, Chuma J, Chytracek R, … Zschiesche D (2003).GEANT4—A simulation toolkit. Nuclear Instruments and Methods in Physics Research, Section A: Accelerators, Spectrometers, Detectors and Associated Equipment, 506(3), 250–303. 10.1016/S0168-9002(03)01368-8 [DOI] [Google Scholar]
- Barkas WH (1963). Nuclear research emulsions. Academic Press. [Google Scholar]
- Barth RF, Coderre JA, Vicente GH, & Blue TE (2005). Boron Neutron Capture Therapy of Cancer: Current Status and Future Prospects. Clin Cancer Res, 11, 17. [DOI] [PubMed] [Google Scholar]
- Bernal MA, Bordage MC, Brown JMC, Davídková M, Delage E, Bitar ZE, Enger SA, Francis Z, Guatelli S, Ivanchenko VN, Karamitros M, Kyriakou I, Maigne L, Meylan S, Murakami K, Okada S, Payno H, Perrot Y, Petrovic I, … Incerti S (2015). Track structure modeling in liquid water: A review of the Geant4-DNA very low energy extension of the Geant4 Monte Carlo simulation toolkit. Physica Medica, 31(8), 861–874. 10.1016/j.ejmp.2015.10.087 [DOI] [PubMed] [Google Scholar]
- Bimbot R, Geissel H, Paul H, Schinner A, Sigmund P, Wambersie A, DeLuca PM, & Seltzer SM (2005). ICRU Report 73: Stopping of ions heavier than helium. In Journal of the ICRU (Vol. 5, Issue 1). 10.1093/jicru/ndi001 [DOI] [Google Scholar]
- Charlton DE, Nikjoo H, & Humm JL (1989). Calculation of Initial Yields of Single-Strand and Double-Strand Breaks in Cell-Nuclei From Electrons, Protons and Alpha-Particles. International Journal of Radiation Biology, 56(1), 1–19. 10.1080/09553008914551141 [DOI] [PubMed] [Google Scholar]
- Cobut V, Frongillo Y, Patau JP, Goulet T, Fraser MJ, & Jay-Gerin JP (1998). Monte Carlo simulation of fast electron and proton tracks in liquid water-l. Physical and physicochemical aspects. Radiation Physics and Chemistry, 51(3), 229–243. 10.1016/S0969-806X(97)00096-0 [DOI] [Google Scholar]
- Conte V, Selva A, Colautti P, Hilgers G, & Rabus H (2017). Track structure characterization and its link to radiobiology. Radiation Measurements, 106, 506–511. 10.1016/j.radmeas.2017.06.010 [DOI] [Google Scholar]
- Dingfelder M, Inokuti M, & Paretzke HG (2000). Inelastic-collision cross sections of liquid water for interactions of energetic protons p. Radiation Physics and Chemistry. [Google Scholar]
- Dingfelder M, Toburen LH, & Paretzke HG (2005). An effective charge scaling model for ionization of partially dressed helium ions with liquid water. Monte Carlo 2005 Topical Meeting, 905–916. [Google Scholar]
- D-Kondo N, Moreno-Barbosa E, Štěphán V, Stefanová K, Perrot Y, Villagrasa C, Incerti S, Alonso BDC, Schuemann J, Faddegon B, & Ramos-Méndez J (2021). DNA damage modeled with Geant4-DNA: effects of plasmid DNA conformation and experimental conditions. Physics in Medicine and Biology, 66(24). 10.1088/1361-6560/ac3a22 [DOI] [PMC free article] [PubMed] [Google Scholar]
- Faddegon B, Blakely EA, Burigo L, Censor Y, Dokic I, Domínguez Kondo N, Ortiz R, Ramos Méndez J, Rucinski A, Schubert K, Wahl N, & Schulte R (2023). Ionization detail parameters and cluster dose: A mathematical model for selection of nanodosimetric quantities for use in treatment planning in charged particle radiotherapy. Physics in Medicine & Biology, 68(17), 175013. 10.1088/1361-6560/acea16 [DOI] [PMC free article] [PubMed] [Google Scholar]
- Fano U (1963). Penetration of Protons, Alpha Particles, and Mesons. Annual Review of Nuclear Science, 13(1), 1–66. 10.1146/annurev.ns.13.120163.000245 [DOI] [Google Scholar]
- Farr LE, Sweet WH, Locksley HB, & Robertson JS (1954). Neutron capture therapy of gliomas using boron. Transactions of the American Neurological Association, 13(79th Meeting), 110–113. [PubMed] [Google Scholar]
- Fehlberg E (1970). Classical fourth- and lower order Runge-Kutta formulas with stepsize control and their application to heat transfer problems. Computing, 6(1–2), 61–71. 10.1007/BF02241732 [DOI] [Google Scholar]
- Fehlberg E (1994). Classical Seventh-, Sixth-, and Fifth-Order Runge-Kutta-Nyström Formulas with Stepsize Control for General Second-Order Differential Equations (TR R-432; p. 84). National Aeronautics and Space Administration. https://ntrs.nasa.gov/api/citations/19740026877/downloads/19740026877.pdf [Google Scholar]
- Francis Z, Incerti S, Ivanchenko V, Champion C, Karamitros M, Bernal MA, & Bitar ZE (2012). Monte Carlo simulation of energy-deposit clustering for ions of the same LET in liquid water. Physics in Medicine and Biology, 57(1), 209–224. 10.1088/0031-9155/57/1/209 [DOI] [PubMed] [Google Scholar]
- Francis Z, Incerti S, Karamitros M, Tran HN, & Villagrasa C (2011). Stopping power and ranges of electrons, protons and alpha particles in liquid water using the Geant4-DNA package. Nuclear Instruments and Methods in Physics Research, Section B: Beam Interactions with Materials and Atoms, 269(20), 2307–2311. 10.1016/j.nimb.2011.02.031 [DOI] [Google Scholar]
- Friedland W, Bernhardt P, Jacob P, Paretzke HG, Dingfelder M, Cherubini R, Goodhead DT, Menzel HG, & Ottolenghi A (2002). Simulation of DNA damage after proton and Iow let irradiation. Radiation Protection Dosimetry, 99(1–4), 99–102. 10.1093/oxfordjournals.rpd.a006848 [DOI] [PubMed] [Google Scholar]
- Friedland W, Dingfelder M, Kundrát P, & Jacob P (2011). Track structures, DNA targets and radiation effects in the biophysical Monte Carlo simulation code PARTRAC. Mutation Research - Fundamental and Molecular Mechanisms of Mutagenesis, 711(1–2), 28–40. 10.1016/j.mrfmmm.2011.01.003 [DOI] [PubMed] [Google Scholar]
- Friedland W, Schmitt E, Kundrát P, Dingfelder M, Baiocco G, Barbieri S, & Ottolenghi A (2017). Comprehensive track-structure based evaluation of DNA damage by light ions from radiotherapy-relevant energies down to stopping. Scientific Reports, 7(September 2016), 1–15. 10.1038/srep45161 [DOI] [PMC free article] [PubMed] [Google Scholar]
- Han Y, Geng C, D-Kondo JN, Li M, Ramos-Méndez J, Altieri S, Liu Y, & Tang X (2023). Microdosimetric analysis for boron neutron capture therapy via Monte Carlo track structure simulation with modified lithium cross-sections. Radiation Physics and Chemistry, 209, 110956. 10.1016/j.radphyschem.2023.110956 [DOI] [PMC free article] [PubMed] [Google Scholar]
- Hirschfelder J, Eyring H, & Topley B (1936). Reactions Involving Hydrogen Molecules and Atoms. The Journal of Chemical Physics, 4(3), 170–177. 10.1063/1.1749815 [DOI] [Google Scholar]
- Hopewell JW, Morris GM, Schwint A, & Coderre JA (2011). The radiobiological principles of boron neutron capture therapy: A critical review. Applied Radiation and Isotopes, 69(12), 1756–1759. 10.1016/j.apradiso.2011.04.019 [DOI] [PubMed] [Google Scholar]
- Horiguchi H, Sato T, Kumada H, Yamamoto T, & Sakae T (2015). Estimation of relative biological effectiveness for boron neutron capture therapy using the PHITS code coupled with a microdosimetric kinetic model. Journal of Radiation Research, 56(2), 382–390. 10.1093/jrr/rru109 [DOI] [PMC free article] [PubMed] [Google Scholar]
- Hu N, Tanaka H, Takata T, Endo S, Masunaga S, Suzuki M, & Sakurai Y (2020). Evaluation of PHITS for microdosimetry in BNCT to support radiobiological research. Applied Radiation and Isotopes. [DOI] [PubMed] [Google Scholar]
- Incerti S, Baldacchino G, Bernal M, Capra R, Champion C, Francis Z, GuÈye P, Mantero A, Mascialino B, Moretto P, Nieminen P, Villagrasa C, & Zacharatou C (2010). THE Geant4-DNA project. International Journal of Modeling, Simulation, and Scientific Computing, 1(2), 157–178. 10.1142/S1793962310000122 [DOI] [Google Scholar]
- Incerti S, Ivanchenko A, Karamitros M, Mantero A, Moretto P, Tran HN, Mascialino B, Champion C, Ivanchenko VN, Bernal MA, Francis Z, Villagrasa C, Baldacchino G, Gùye P, Capra R, Nieminen P, & Zacharatou C (2010). Comparison of GEANT4 very low energy cross section models with experimental data in water. Medical Physics, 37(9), 4692–4708. 10.1118/1.3476457 [DOI] [PubMed] [Google Scholar]
- Incerti S, Kyriakou I, Bernal MA, Bordage MC, Francis Z, Guatelli S, Ivanchenko V, Karamitros M, Lampe N, Lee SB, Meylan S, Min CH, Shin WG, Nieminen P, Sakata D, Tang N, Villagrasa C, Tran HN, & Brown JMC (2018). Geant4-DNA example applications for track structure simulations in liquid water: A report from the Geant4-DNA Project. Medical Physics, O(0), 1–18. 10.1002/mp.13048 [DOI] [PubMed] [Google Scholar]
- International Commission on Radiation Units and Measurements. (1993). Stopping powers and ranges for protons and alpha particles. International Commission on Radiation Units and Measurements. [Google Scholar]
- Islam MM, Lertnaisat P, Meesungnoen J, Sanguanmith S, Jay-Gerin JP, Katsumura Y, Mukai S, Umehara R, Shimizu Y, & Suzuki M (2017). Monte Carlo track chemistry simulations of the radiolysis of water induced by the recoil ions of the 10B(n,α)7Li nuclear reaction. 1. Calculation of the yields of primary species up to 350°C. RSC Advances, 7(18), 10782–10790. 10.1039/c6ra28586d [DOI] [Google Scholar]
- Jackman CH, & Garvey AESGRH (1975). Independent-particle-model potentials for atoms and ions with 36 < Z < = 54 and a modified Thomas-Fermi atomic energy formula*. Physical Review A, 12(4), 1144–1152. 10.1080/00431672.1975.9931783 [DOI] [Google Scholar]
- Jin WH, Seldon C, Butkus M, Sauerwein W, & Giap HB (2022). A Review of Boron Neutron Capture Therapy: Its History and Current Challenges. International Journal of Particle Therapy, 9(1), 71–82. 10.14338/IJPT-22-00002.1 [DOI] [PMC free article] [PubMed] [Google Scholar]
- Karlsson B (2005). Beyond the C++ Standard Library: An Introduction to Boost (1st ed.). Pearson Education, Limited. [Google Scholar]
- Kumada H, Yamamoto K, Matsumura A, Yamamoto T, Nakagawa Y, Nakai K, & Kageji T (2004). Verification of the computational dosimetry system in JAERI (JCDS) for boron neutron capture therapy. Physics in Medicine and Biology, 49(15), 3353–3365. 10.1088/0031-9155/49/15/003 [DOI] [PubMed] [Google Scholar]
- Kyriakou I, Ivanchenko V, Sakata D, Bordage MC, Guatelli S, Incerti S, & Emfietzoglou D (2019). Influence of track structure and condensed history physics models of Geant4 to nanoscale electron transport in liquid water. Physica Medica, 58, 149–154. 10.1016/j.ejmp.2019.01.001 [DOI] [PubMed] [Google Scholar]
- Liamsuwan T, & Nikjoo H (2013a). A Monte Carlo track structure simulation code for the full-slowing-down carbon projectiles of energies 1 keV u-1–10 MeV u-1 in water. Physics in Medicine and Biology, 58(3), 673–701. 10.1088/0031-9155/58/3/673 [DOI] [PubMed] [Google Scholar]
- Liamsuwan T, & Nikjoo H (2013b). Cross sections for bare and dressed carbon ions in water and neon. Physics in Medicine and Biology, 58(3), 641–672. 10.1088/0031-9155/58/3/641 [DOI] [PubMed] [Google Scholar]
- Liamsuwan T, Uehara S, Emfietzoglou D, & Nikjoo H (2011). A Model of Carbon Ion Interactions in Water Using the Classical Trajectory Monte Carlo Method. 143(2), 152–155. [DOI] [PubMed] [Google Scholar]
- Malouff TD, Seneviratne DS, Ebner DK, Stross WC, Waddle MR, Trifiletti DM, & Krishnan S (2021). Boron Neutron Capture Therapy: A Review of Clinical Applications. Frontiers in Oncology, 11, 601820. 10.3389/fonc.2021.601820 [DOI] [PMC free article] [PubMed] [Google Scholar]
- Meylan S, Incerti S, Karamitros M, Tang N, Bueno M, Clairand I, & Villagrasa C (2017). Simulation of early DNA damage after the irradiation of a fibroblast cell nucleus using Geant4-DNA. Scientific Reports, 7(1), 1–15. 10.1038/s41598-017-11851-4 [DOI] [PMC free article] [PubMed] [Google Scholar]
- Mukawa T, Matsumoto T, & Niita K (2011). Study on Microdosimetry for Boron Neutron Capture Therapy. Progress in Nuclear Science and Technology, 2(0), 242–246. 10.15669/pnst.2.242 [DOI] [Google Scholar]
- Nedunchezhian K, Aswath N, Thiruppathy M, & Thirugnanamurthy S (2016). Boron neutron capture therapy-A literature review. Journal of Clinical and Diagnostic Research, 10(12), ZE01–ZE04. 10.7860/JCDR/2016/19890.9024 [DOI] [PMC free article] [PubMed] [Google Scholar]
- Nettelbeck H, & Rabus H (2011). Nanodosimetry: The missing link between radiobiology and radiation physics? Radiation Measurements, 46(9), 893–897. 10.1016/j.radmeas.2011.03.029 [DOI] [Google Scholar]
- Nikjoo H, Uehara S, Emfietzoglou D, & Cucinotta FA (2006). Track-structure codes in radiation research. Radiation Measurements, 41(9–10), 1052–1074. 10.1016/j.radmeas.2006.02.001 [DOI] [Google Scholar]
- Olson RE, & Salop A (1977). Charge-transfer and impact-ionization cross sections for fully and partially stripped positive ions colliding with atomic hydrogen. Physical Review A, 16(2), 531–541. 10.1103/PhysRevA.16.531 [DOI] [Google Scholar]
- Perry CF, Zhang P, Nunes FB, Jordan I, Von Conta A, & Wörner HJ (2020). Ionization Energy of Liquid Water Revisited. The Journal of Physical Chemistry Letters, 11(5), 1789–1794. 10.1021/acs.jpclett.9b03391 [DOI] [PubMed] [Google Scholar]
- Pietrzak M, Nettelbeck H, Perrot Y, Villagrasa C, Bancer A, Bug M, & Incerti S (2022). Intercomparison of nanodosimetric distributions in nitrogen simulated with Geant4 and PTra track structure codes. Physica Medica, 102, 103–109. 10.1016/j.ejmp.2022.09.003 [DOI] [PubMed] [Google Scholar]
- Plante I (2011). A Monte-Carlo step-by-step simulation code of the non-homogeneous chemistry of the radiolysis of water and aqueous solutions-Part II: Calculation of radiolytic yields under different conditions of LET, pH , and temperature. Radiation and Environmental Biophysics, 50(3), 405–415. 10.1007/s00411-011-0368-7 [DOI] [PubMed] [Google Scholar]
- Ramos-Mendez JA, LaVerne JA, Domínguez-Kondo JN, Milligan J, Stepan V, Stefanová K, Perrot Y, Villagrasa C, Shin W-G, Incerti S, McNamara AL, Paganetti H, Perl J, Schuemann J, & Faddegon BA (2021). TOPAS-nBio validation for simulating water radiolysis and DNA damage under low-LET irradiation. Physics in Medicine & Biology, 66(June), 1–12. 10.1088/1361-6560/ac1f39 [DOI] [PMC free article] [PubMed] [Google Scholar]
- Ramos-Méndez J, Burigo LN, Schulte R, Chuang C, & Faddegon B (2018). Fast calculation of nanodosimetric quantities in treatment planning of proton and ion therapy. Physics in Medicine and Biology, 63(23). 10.1088/1361-6560/aaeeee [DOI] [PMC free article] [PubMed] [Google Scholar]
- Sakata D, Kyriakou I, Okada S, Tran HN, Lampe N, Guatelli S, Bordage MC, Ivanchenko V, Murakami K, Sasaki T, Emfietzoglou D, & Incerti S (2018). Geant4-DNA track-structure simulations for gold nanoparticles: The importance of electron discrete models in nanometer volumes. Medical Physics, 45(5), 2230–2242. 10.1002/mp.12827 [DOI] [PubMed] [Google Scholar]
- Sato T, Masunaga SI, Kumada H, & Hamada N (2018). Microdosimetric Modeling of Biological Effectiveness for Boron Neutron Capture Therapy Considering Intra- and Intercellular Heterogeneity in 10B Distribution. Scientific Reports, 8(1), 2–11. 10.1038/s41598-017-18871-0 [DOI] [PMC free article] [PubMed] [Google Scholar]
- Schmitt E, Friedland W, Kundrát P, Dingfelder M, & Ottolenghi A (2015). Cross-section scaling for track structure simulations of low-energy ions in liquid water. Radiation Protection Dosimetry, 166(1–4), 15–18. 10.1093/rpd/ncv302 [DOI] [PubMed] [Google Scholar]
- Schuemann J, McNamara AL, Ramos-Méndez J, Perl J, Held KD, Paganetti H, Incerti S, & Faddegon B (2019). TOPAS-nBio: An Extension to the TOPAS Simulation Toolkit for Cellular and Sub-cellular Radiobiology. Radiation Research, 191(2), 125. 10.1667/rr15226.1 [DOI] [PMC free article] [PubMed] [Google Scholar]
- Slater JC (1930). Atomic Shielding Constants. Physical Review, 36(1), 57–64. 10.1103/PhysRev.36.57 [DOI] [Google Scholar]
- Berger SM, S. MJ (1973). ETRAN, Monte Carlo code system for electron and photon transport through extended media. https://rsicc.ornl.gov/PackageDetail.aspx?p=ETRAN&id=C00107&cpu=10360&v=00&t=Monte Carlo Code System for Electron and Photon Through Extended Media.
- Tomita H, Kai M, Kusama T, & Ito A (1998). Monte Carlo simulation of DNA strand-break induction in supercoiled plasmid pBR322 DNA from indirect effects. Radiation and Environmental Biophysics, 36(4), 235–241. 10.1007/s004110050077 [DOI] [PubMed] [Google Scholar]
- Tran HN, Dao DD, Incerti S, Bernal MA, Karamitros M, Nhan Hao TV, Dang TM, & Francis Z (2016). Single electron ionization and electron capture cross sections for (C6+, H 2 O ) interaction within the Classical Trajectory Monte Carlo (CTMC) approach. Nuclear Instruments and Methods in Physics Research Section B: Beam Interactions with Materials and Atoms, 366, 140–144. 10.1016/j.nimb.2015.10.017 [DOI] [Google Scholar]
- Zein SA, Bordage M-C, Tran HN, Macetti G, Genoni A, Dal Cappello C, & Incerti S (2023). Monte Carlo simulations of electron interactions with the DNA molecule: A complete set of physics models for Geant4-DNA simulation toolkit. Nuclear Instruments and Methods in Physics Research Section B: Beam Interactions with Materials and Atoms, 542, 51–60. 10.1016/j.nimb.2023.06.004 [DOI] [Google Scholar]
- Ziegler JF, & Biersack JP (2010). Stopping and range of ions in matter: SRIM. http://www.srim.org/.