

ABSTRACT
Formulating a research question and selecting an appropriate study design for answering that question are crucial initial steps in the research process. The population, intervention, control group, and outcomes measures (PICO time and setting [TS]) framework provides a practical guide in this regard, which stands for population, intervention, control, outcome, type of research question, and study design. The various study designs have their own merits and demerits, and implementing the methodology meticulously requires knowledge of all of these. Similarly, different methods of sample size calculation are warranted based on the most appropriate study design and outcome variables of interest. Sometimes, a post hoc power analysis can be performed after the sample size calculation, to check whether the study was adequately powered or not. There are multiple validated free software tools for sample size calculation, including Open-Epi, R, StatCalc, etc. The practice by most researchers of reporting significant P values is to be replaced by reporting effect sizes, as the latter is a much better estimate of the strength of association. This review provides a comprehensive, ready reckoner for busy family physicians to quickly identify the appropriate study design for answering any applied research questions in their minds and estimating the sample size required for the same.
Keywords: Clinical trials, medical research, research question, sample size, study designs
Introduction
Family medicine practitioners (FPs) are confronted with numerous tough clinical decisions that need them to be abreast with the recent clinical practice guidelines. They might also have background and foreground questions in their minds that need to be answered to provide better care to their clients. This process of continuing medical education is the premise of modern medicine, and the answer to their background and foreground questions can be given by evidence-based medicine. In the present era of evidence-based medicine (EBM), it is crucial for biomedical researchers to ensure the statistical soundness of their claims. EBM encompasses the thoughtful, transparent, and informed application of the most current and superior evidence to guide decisions regarding individual patient care.[1] One important aspect of ensuring the quality of evidence is the study design used in generating evidence; systematic review and meta-analysis being the highest quality of evidence. The hierarchy of evidence moves all the way from single case reports to meta-analysis,[2] and sample size is one of the essential parameters for critically appraising any study. However, many published articles, both in Indian and international journals, do not report the steps and intricacies of sample size calculation in detail. As a result, many such studies may have inadequate sample size and may not be sufficiently powered to answer the research question of interest.[3,4] Numerous articles in the literature have extensively discussed sample size calculation methods and the availability of relevant software.[5] It is crucial to acknowledge that the techniques used for sample size calculation are contingent on the selected study design, and selecting an appropriate study design is critical for establishing a valid relationship between exposure and outcome. To draw meaningful conclusions and make valuable contributions to the medical literature, researchers must meticulously define their research question, study hypothesis, patient population, and research methods. This paper provides a comprehensive review of the formulas used for calculating sample size in various study designs, presented in a simplified manner, and supported by relevant examples. The aim is to equip family medicine practitioners with the necessary knowledge to accurately determine the appropriate sample size for their research, and critically appraise medical literature for their adequacy of sample size.
Parameters Required for Sample Size Calculation
Sample size refers to the essential count of experimental or observational units necessary for conducting research. These units may encompass study subjects/patients, blood or visceral fluids, tissue samples, or geographical areas, such as cities, states, regions, or countries. Achieving an appropriate sample size represents a delicate balance between practical constraints and scientific validity, significantly impacted by selected study designs. This review paper highlights seven essential components for accurate sample size calculation, as outlined below.
Research Question
The research question (RQ) should comprise the population under investigation, intervention, control group, and outcome measures (PICO).[6] For example, let us assume a researcher wants to see the effect of implementing Rashtriya Bal Swasthya Karyakram (RBSK) compared to no screening on early detection of developmental delay and improved academic performance among children aged 6–12 years living in a rural community, “P” is the children aged 6–12 years in a rural community, “I” is school-based health screening program, “C” is no screening program and “O” is early detection of developmental delay and improved academic performance. Further, the type of question and study design need to be formulated to answer the question (PICOTS).[7] The acronym “FINERMAPS” encapsulates the key attributes of a stronger research question, encompassing feasibility, interest, novelty, ethics, relevance, manageability, appropriateness, potential value, publishable, and systematic approach.[8]
Null Hypothesis (Ho)
The Ho aims to determine if there is a statistically significant association between the predictor variable and the outcome variable. As per the above research question, Ho is that there is no significant difference in developmental delay and academic performance among the children aged 6–12 years living in rural communities who underwent a school-based health screening program compared to those who did not.
Level of Significance/Type-I Error
The level of significance, also known as the alpha value or type-I error, is often referred to as the P value.[9] It represents the probability of rejecting a Ho when there is no true difference between the variables being studied. Results of the P value, if it is low (e.g. P ≤ 0.05), suggest that the observed difference may be unlikely to occur due to chance alone. Researchers commonly choose a significance level of 5% (P = 0.05) or 1% (P = 0.01), indicating their willingness to accept a 5% or 1% chance of making a type-I error. In other words, they aim to be 95% or 99% confident that their conclusions are accurate and that they are not falsely rejecting the Ho.
Statistical Power/Type-II Error
Power serves as a crucial metric in assessing the study’s ability to detect a clinically significant difference between the two study groups, thus gauging its overall validity. It is derived from another important parameter known as type-II error or β-error. A commonly accepted value for β error is 0.20 (or 20%), indicating a 20% chance of incorrectly accepting the Ho. Consequently, the power of the study is expressed as 1− β. For instance, if β is 0.20, then the power would be 0.8 (or 80%).[10] The study’s validity is enhanced with lower α (type-I error) and narrower β, but this comes at the expense of significantly increasing the required sample size.[11]
Effect Size
The effect size (ES) is a key parameter for determining the sample size needed in analytical studies. It represents the magnitude of the difference in the outcome variable between the intervention group and the control group and is expressed as a numerical value.[12] For continuous variables, the ES is calculated as the absolute difference between the means. For example, suppose the mean improvement in outcome for the intervention group is 75, with a standard deviation (SD) of 10, and for the control group is 60, SD: 8. Then ES = (75 + 60)/√[(102 + 82)/2] = 1.65. In this example, the ES (Cohen’s d) for the mean improvement in outcome is approximately 1.65, indicating a moderate to large ES. In categorical outcomes, the ES is calculated as the difference in proportions or rates between the two groups. For example, the proportion of individuals who exercise in one group before and after some intervention is 20% and 60%, respectively, and in the control group is 15% and 18% respectively. To calculate the ES, we can use the risk difference (RD), which is the difference in proportions between the intervention and control groups. In this case, RD = (60% − 20%) - (18% − 15%) = 37%. In this example, the RD or ES for the proportion of individuals who exercise is 37%. A higher ES indicates a larger difference between the groups and requires a smaller sample size to detect the effect with sufficient power, and vice-versa.[13] Effect size values can be obtained from pilot studies, previous studies, or based on the experience of researchers. It is essential to note that ES values are only relevant for analytical studies, and not applicable for descriptive or observational studies. However, a word of caution is warranted as the P value can be significant for the same difference in effect if the sample size is sufficiently large. Hence, modern researchers are discouraged from reporting P values and are required to report the ES.[14]
Variance/SD
Standard deviation represents the root mean square deviation, while variance is the square of the SD.[15] In comparative studies with a quantitative endpoint, this parameter becomes essential for sample size calculations. To determine the sample size needed, researchers must consider the effect size and obtain information on variance or SD. These values can be derived from previous research, pilot studies, or from the researcher’s own subjective experience. Notably, a larger SD corresponds to a larger required sample size for the study.
Dropout/Withdrawals/Losses to Follow-up/Non-response rate
Dropouts, withdrawals, and losses to follow-up refer to participants who enroll in the study but discontinue their involvement before its completion. To determine the appropriate sample size, researchers must consider practical issues, and one important factor is the dropout rate (d), typically set at 20%.[16] The adjusted sample size (n*) is calculated using the formula n* = n/((1 − d)), where n is the required sample size. In addition, in studies involving sensitive issues with voluntary participation instead of mandatory enrolment, non-response bias becomes an important consideration.[17]
Importance of Pilot Study
Several factors like mean, variance, SD, prevalence and ES are required for calculating sample size for a study, which can be extracted from the previously published literature that has reported similar outcomes. The approximate “effect” estimates can be obtained by reviewing meta-analysis and determining clinically meaningful effects.[18] However, such information is not always available, and conducting pilot studies becomes imperative to estimate the effects required for sample size calculations. A pilot study is undertaken on non-study participants, serving as a small-scale preliminary investigation. To calculate the appropriate sample size required for the main trial, the standard ES, known as Cohen’s d, is extracted from the pilot study.[19]
How to Calculate Sample Size?
For simple studies, standard formulas can be applied, while for more complex studies, statistical software programs are available to assist with sample size calculation, for example, Open-Epi, R, StatCalc, etc.[20,21] The common R packages for sample size calculation are epiR, pwr, Webpower, etc. In addition, it is important to check whether the calculated sample size pertains to the total sample size or the sample size required for each group, as this distinction can significantly affect the study’s design and statistical analysis.
Cross-sectional Studies
A cross-sectional study or survey is a research design used to estimate population parameters such as prevalence or the average value of a quantitative variable in a population. It can be either descriptive or analytical and is often used to show association between the variables.[22] [Figure 1] Sample size calculation formulas for qualitative and quantitative variables are different.
Figure 1.

Classification of study designs into major types of research
For categorical outcome variables, suppose a researcher in healthcare is interested in estimating the proportion/prevalence of underweight among children aged 1 to 5 years in a city. Based on the previously published studies, the prevalence of underweight is around 30%. The researcher aims to calculate sample size with precision or a margin of error set at 5% and a confidence level (CI) of 95%. The researcher should use the below mentioned formula for proportion or prevalence to estimate the sample size.
 , where n is the sample size,
  is the standard normal variate (1.96 at a 5% level of significance) [Table 1]; P represents the expected proportion in the population based on prior studies or pilot studies, and d refers to precision or absolute error.
Table 1.
Z-value for the sample size calculation
| Value | Variance | ||
|---|---|---|---|
|
| |||
| Z(1 - α/2) (two sided) | Z(1 - α) (one sided) | Z1 - β | |
| α | |||
| 0.01 (level of significance 1%) | 2.58 | 2.33 | - |
| 0.05 (level of significance 5%) | 1.96 | 1.65 | - |
| 0.10 (level of significance 10%) | 1.64 | 1.28 | - |
| β | |||
| 0.01 (power 99%) | - | - | 2.33 |
| 0.05 (power 95%) | - | - | 1.65 |
| 0.10 (power 90%) | - | - | 1.28 |
| 0.20 (power 80%) | - | - | 0.84 |
Therefore, 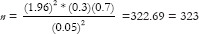
n = 323 + 32 = 355 (Consider 10% dropout of study participants)
Hence, for conducting this study researcher must identify at least 355 children in the age group 1–5 years.
Precision represents a quantification of random sampling error and can be classified into two types as follows:
Absolute precision quantifies uncertainty in a specific quantity. For example, if the prevalence of a condition is estimated to be 30 ± 10%, the absolute precision would be 10%.
Relative precision represents uncertainty as a fraction of the quantity under consideration. For example, when the prevalence is estimated at 30 ± 3%, the relative uncertainty amounts to 10% of 30, which is equivalent to 3%.
In conventional practice, when the disease prevalence is anticipated to fall within the range of 10 to 90%, the standard approach is to set the absolute precision at 5%.[12] However, if the prevalence falls below 10%, the precision is usually chosen as half of the prevalence. Conversely, when prevalence is expected to exceed 90%, the value of d is calculated as [0.5 (1 − p)], where p represents the prevalence.[23]
For continuous outcome variables,  where σ = SD and d is precision. Suppose a researcher seeks to estimate the population mean systolic blood pressure (SBP) in a specific community, ensuring a margin of error of 0.5 mmHg, while maintaining a 95% confidence level. From prior research or pilot study, the researcher estimates that the SD of SBP in this population is around 3 mmHg.

Here Z1-α/2 = 1.96; σ =3 mmHg; d = 0.5 mmHg
n = 138 + 14 = 152 (Consider 10% dropout of study participants)
Therefore, the researcher would need to recruit a sample of 152 patients to estimate the mean SBP.
Case-Control Studies
A case-control study is also known as a retrospective study. It is used to determine if there is an association between exposure and a specific health outcome.
For the categorical outcome variable,  ,
, 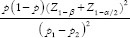 * where r = ratio of control to case (r = 1 if an equal number of participants in both the groups), P = average proportion in population P = (p1 + p2)/2; Z1–β = Z-value for 80% power would be 0.84 [Table 1], p1 = proportion in cases and p2 = proportion in controls. Suppose a researcher wants to investigate the association between genetic mutation and the risk of developing lymphoma, assuming that the prevalence of the genetic mutation is 0.25 in the control group and 0.40 in the cases, with an equal number of cases and controls. Therefore,
  *
*  . Assuming 10% non-response among study participants, then n = 153 + 15 = 168, the final sample size will be 336 (168 cases and 168 controls).
For continuous variables,  , where σ = SD and d = ES. For example, suppose the mean difference in outcome between the treatment and control groups is five, with an SD of 10, and the researcher also wants an equal number of cases and control.
Therefore,  . Assuming 10% non-response among study participants, the final sample size will be 138 (69 cases and 69 controls).
Cohort Studies
A cohort study (prospective study) is a type of longitudinal study that follows research participants over time to observe the occurrence rate of disease outcomes in both exposed and unexposed individuals to a specific risk factor [Figure 2]. For example, a researcher is interested in investigating the relationship between exposure to outdoor air pollution and the development of asthma in a community-based population. The incidence of asthma among individuals with low levels of outdoor air pollution exposure is 20%, while it is 30% among those with high levels of outdoor air pollution exposure.
Figure 2.

Directionality in various types of study designs
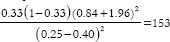
Here,  where po = probability of event in controls, p1 = probability of events in experimental group, m = ratio of control to experiment group and
Therefore, 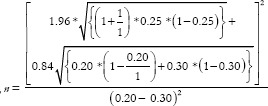 = 292.7 ≈ 293. Assuming 10% non-response among study participants and n = 293 + 29 = 322, the final sample size will be 644 (322 exposed and 322 controls).
Clinical Trials
Clinical trials or experimental studies are undertaken to investigate and compare the effectiveness of newly developed tests or treatments, with a focus on evaluating their impacts on health outcomes. They are of three types: superiority, non-inferiority, and equivalence. When the objective of a randomized control trial (RCT) is to demonstrate the superiority of one treatment over another, then the trial is categorized as a superiority trial.[24] Non-inferiority trials are designed to determine that a new experimental treatment is not significantly less effective than an active control treatment already established and are mainly used when placing patients on a placebo is unethical.[25] A superiority and non-inferiority trial is always one-tailed, whereas the equivalence trial is a two-tailed test. Assuming an equal number of participants in the experimental and control arms of a superiority trial,  for categorical outcomes and for continuous outcomes,
  , where d = actual margin between two interventions, p = outcome rate of standard intervention, d0 = clinical equivalence limit, indicating the absolute change in the outcome of interest used to assess treatment comparability, and σ = pooled SD (from both comparison groups). Similarly, in a non-inferiority trial, n =
  , for categorical outcomes and for continuous outcomes,
  . Whereas, in equivalence trials,
 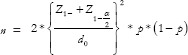 for categorical outcome and for continuous data, n =
  . For example, a researcher wants to demonstrate the superiority of a treatment over conventional treatment for patients with cancer, taking survival as the outcome. Conventional treatment has a survival of 45%, whereas the newer treatment demonstrated survival of 61%. The actual difference in survival between the groups is 16%, while 10% is the equivalence limit. Therefore,
  . Hence, the total sample size will be 1704 (852 experimental subjects and 852 controls). If the same researcher wants to demonstrate non-inferiority of the new treatment compared to conventional treatment,
 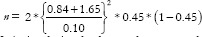 = 307. Thus, a non-inferiority design leads to a lesser sample size as compared to a superiority design. Categorization of trials into superiority or non-inferiority can sometimes be arbitrary, especially when determining whether treatment groups should be classified as standard or experimental proves to be complex and less definitive.[26] However, an equivalence design will always have more sample size than non-inferiority trials because it is a two-tailed test. The formula for equivalence trials is like that of non-inferiority trials, except that the Z values for beta should be for a two-tailed test. [Table 1] Hence,
  .
.
As another example, a researcher wants to compare two drugs (A and B) on reducing SBP, measured using a digital sphygmomanometer, enrolling an equal number of subjects in both arms. Mean SBP reduction in drugs A and B is 40 and 60, respectively, with a pooled SD of 20 and clinically allowable difference of 10.
Assuming superiority design, 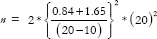 =49, and assuming non-inferiority,
  =49. Thus, a superiority trial gives exactly the same sample size as a non-inferiority trial, when the actual difference is twice the equivalence limit. Assuming equivalence,
  , demonstrating that equivalence design always yields a higher sample size than non-inferiority design.
Diagnostic Test
A diagnostic accuracy test is used to help figure out what disease or condition a person has based on their signs and symptoms. Moreover, these tests play a crucial role in treatment planning and assessing treatment efficacy for identified condition. Sensitivity and specificity assessment serves as a widely adopted approach for the assessment of screening or diagnostic studies.[27] Sensitivity and specificity are two inherent properties of the diagnostic test that are not dependent on the prevalence. However, the positive predictive value (PPV) of the test is directly proportional to the prevalence; that is, higher the prevalence, more will be the PPV.[28]
For sensitivity (Sn),  , where TP and FN indicate True Positive and False Negative, respectively,
 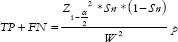 = prevalence rate of disease within the study population, and W = Maximum acceptable width of 5% for the 95% CI, is conventionally taken as 5%.
For specificity (SP),  , where TN = True Negative and FP = False Positive,
 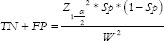 . For example, a researcher is interested in determining the sample size required to evaluate the accuracy of the new test to diagnose hypertension at a 5% margin of error. Hypertension has a prevalence of 20%, and the new diagnostic test has a sensitivity of 80% and specificity of 90% in diagnosing it.
For Sensitivity;
 ;
; 
For Specificity;
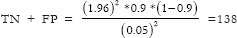 ;
; 
Total required sample size = 1229 + 172 = 1401
Discussion
Family physicians (FPs) must answer both background and foreground questions to deliver quality patient care. Background knowledge concerns well-established facts/theoretical knowledge.[29] It is primarily junior FPs or students who require background knowledge. However, senior FPs information needs typically relate to “foreground” knowledge, which is usually needed to support a specific aspect of clinical decision-making, like diagnosis, prognosis or management. A recent study conducted on FPs in Canada reported that out of 161 structured queries (following the PICOTS framework) related to foreground questions, the resources commonly accessed were summaries (64%), pre-appraised research (19.3%) and non-pre-appraised research (16.8%).[30] This is encouraging because nearly 85% of the research questions were being answered by critically appraised EBM. However, the level of research inclination and sensitization is not uniform across the countries, and FPs in many low-and-middle-income countries need skills to sift the scientifically rigorous studies from the rest.
This review article delivers a concise and extensive exploration of sample size calculation methods in observational and experimental studies, which will equip family physicians with the necessary knowledge to determine the optimal sample size for any investigation, and critically appraise available literature for their adequacy of sample size. In addition, they can use this knowledge to improve their own clinical research studies. By employing this valuable information, researchers can enhance the reliability and generalizability of the research they refer for clinical practice guidance, ultimately contributing to better patient care and the generation of more robust and valid research in their respective fields.
The appropriate sample size for a study should be determined based on factors such as study design, significance level, and power of the test, effect size, variance of outcome, and type of outcome. Underestimating or overestimating the sample size can result in incorrect or misleading findings, which can negatively impact the validity of the study. Therefore, a comprehensive review of the literature is essential for accurately estimating parameters, such as effect size and prevalence. In conclusion, knowledge of sample size estimation is critical for conducting an effective review of literature, and it requires a balanced consideration of technical knowledge and judgment based on experience and insight.
Financial support and sponsorship
Nil.
Conflicts of interest
There are no conflicts of interest.
References
- 1.Masic I, Miokovic M, Muhamedagic B. Evidence based medicine –New approaches and challenges. Acta Inform Med. 2008;16:219–25. doi: 10.5455/aim.2008.16.219-225. [DOI] [PMC free article] [PubMed] [Google Scholar]
- 2.Burns PB, Rohrich RJ, Chung KC. The levels of evidence and their role in evidence-based medicine. Plast Reconstr Surg. 2011;128:305–10. doi: 10.1097/PRS.0b013e318219c171. [DOI] [PMC free article] [PubMed] [Google Scholar]
- 3.Jaykaran, Yadav P, Kantharia ND. Reporting of sample size and power in negative clinical trials published in Indian medical journals. J Pharm Negat Results. 2011;2:87–90. [Google Scholar]
- 4.Jaykaran, Saxena D, Yadav P, Kantharia ND. Negative studies published in medical journals of India do not give sufficient information regarding power/sample size calculation and confidence interval. J Postgrad Med. 2011;57:176–7. doi: 10.4103/0022-3859.81861. [DOI] [PubMed] [Google Scholar]
- 5.Charan J, Biswas T. How to calculate sample size for different study designs in medical research? Indian J Psychol Med. 2013;35:121–6. doi: 10.4103/0253-7176.116232. [DOI] [PMC free article] [PubMed] [Google Scholar]
- 6.Aslam S, Emmanuel P. Formulating a researchable question: A critical step for facilitating good clinical research. Indian J Sex Transm Dis AIDS. 2010;31:47–50. doi: 10.4103/0253-7184.69003. [DOI] [PMC free article] [PubMed] [Google Scholar]
- 7.Riva JJ, Malik KMP, Burnie SJ, Endicott AR, Busse JW. What is your research question?An introduction to the PICOT format for clinicians. J Can Chiropr Assoc. 2012;56:167–71. [PMC free article] [PubMed] [Google Scholar]
- 8.Ratan SK, Anand T, Ratan J. Formulation of research question – stepwise approach. J Indian Assoc Pediatr Surg. 2019;24:15–20. doi: 10.4103/jiaps.JIAPS_76_18. [DOI] [PMC free article] [PubMed] [Google Scholar]
- 9.Aguinis H, Vassar M, Wayant C. On reporting and interpreting statistical significance and P values in medical research. BMJ Evid Based Med. 2021;26:39–42. doi: 10.1136/bmjebm-2019-111264. [DOI] [PMC free article] [PubMed] [Google Scholar]
- 10.Greenland S, Senn SJ, Rothman KJ, Carlin JB, Poole C, Goodman SN, et al. Statistical tests, P values, confidence intervals, and power: A guide to misinterpretations. Eur J Epidemiol. 2016;31:337–50. doi: 10.1007/s10654-016-0149-3. [DOI] [PMC free article] [PubMed] [Google Scholar]
- 11.Banerjee A, Chitnis UB, Jadhav SL, Bhawalkar JS, Chaudhury S. Hypothesis testing, type I and type II errors. Ind Psychiatry J. 2009;18:127–31. doi: 10.4103/0972-6748.62274. [DOI] [PMC free article] [PubMed] [Google Scholar]
- 12.Pourhoseingholi MA, Vahedi M, Rahimzadeh M. Sample size calculation in medical studies. Gastroenterol Hepatol Bed Bench. 2013;6:14–7. [PMC free article] [PubMed] [Google Scholar]
- 13.Serdar CC, Cihan M, Yücel D, Serdar MA. Sample size, power and effect size revisited: Simplified and practical approaches in pre-clinical, clinical and laboratory studies. Biochem Med (Zagreb) 2021;31:010502. doi: 10.11613/BM.2021.010502. [DOI] [PMC free article] [PubMed] [Google Scholar]
- 14.Sullivan GM, Feinn R. Using effect size—or why the P value is not enough. J Grad Med Educ. 2012;4:279–82. doi: 10.4300/JGME-D-12-00156.1. [DOI] [PMC free article] [PubMed] [Google Scholar]
- 15.Lee DK, In J, Lee S. Standard deviation and standard error of the mean. Korean J Anesthesiol. 2015;68:220–3. doi: 10.4097/kjae.2015.68.3.220. [DOI] [PMC free article] [PubMed] [Google Scholar]
- 16.Fincham JE. Response rates and responsiveness for surveys, standards, and the journal. Am J Pharm Educ. 2008;72:43. doi: 10.5688/aj720243. [DOI] [PMC free article] [PubMed] [Google Scholar]
- 17.Cheung KL, Ten Klooster PM, Smit C, De Vries H, Pieterse ME. The impact of non-response bias due to sampling in public health studies: A comparison of voluntary versus mandatory recruitment in a Dutch national survey on adolescent health. BMC Public Health. 2017;17:276. doi: 10.1186/s12889-017-4189-8. [DOI] [PMC free article] [PubMed] [Google Scholar]
- 18.Lakens D. Calculating and reporting effect sizes to facilitate cumulative science: A practical primer for t-tests and ANOVAs. Front Psychol. 2013;4:863. doi: 10.3389/fpsyg.2013.00863. [DOI] [PMC free article] [PubMed] [Google Scholar]
- 19.In J. Introduction of a pilot study. Korean J Anesthesiol. 2017;70:601–5. doi: 10.4097/kjae.2017.70.6.601. [DOI] [PMC free article] [PubMed] [Google Scholar]
- 20.Sullivan KM, Dean A, Minn MS. OpenEpi: A web-based epidemiologic and statistical calculator for public health. Public Health Reports. 2009;124:471–4. doi: 10.1177/003335490912400320. [DOI] [PMC free article] [PubMed] [Google Scholar]
- 21.Park S, Kim YH, Bang HI, Park Y. Sample size calculation in clinical trial using R. J Minim Invasive Surg. 2023;26:9–18. doi: 10.7602/jmis.2023.26.1.9. [DOI] [PMC free article] [PubMed] [Google Scholar]
- 22.Capili B. Overview: Cross-sectional studies. Am J Nurs. 2021;121:59–62. doi: 10.1097/01.NAJ.0000794280.73744.fe. [DOI] [PMC free article] [PubMed] [Google Scholar]
- 23.Charan J, Kaur R, Bhardwaj P, Singh K, Ambwani SR, Misra S. Sample size calculation in medical research: A primer. Ann Natl Acad Med Sci. 2021;57:74–80. [Google Scholar]
- 24.Lesaffre E. Superiority, equivalence, and non-inferiority trials. Bull NYU Hosp Jt Dis. 2008;66:150–4. [PubMed] [Google Scholar]
- 25.Hahn S. Understanding noninferiority trials. Korean J Pediatr. 2012;55:403–7. doi: 10.3345/kjp.2012.55.11.403. [DOI] [PMC free article] [PubMed] [Google Scholar]
- 26.Dunn DT, Copas AJ, Brocklehurst P. Superiority and non-inferiority: Two sides of the same coin? Trials. 2018;19:499. doi: 10.1186/s13063-018-2885-z. [DOI] [PMC free article] [PubMed] [Google Scholar]
- 27.Bujang MA, Adnan TH. Requirements for minimum sample size for sensitivity and specificity analysis. J Clin Diagn Res. 2016;10:YE01–6. doi: 10.7860/JCDR/2016/18129.8744. [DOI] [PMC free article] [PubMed] [Google Scholar]
- 28.Hunt BR, Kaloshin VY. Prevalence. Handbook Dynamical Systems. 2022;3:43–87. [Google Scholar]
- 29.Steele R. ‘Background’ and ‘foreground’ knowledge: Targeting learning materials to trainees’ needs. BJPsych Bull. 2015;39:206–7. doi: 10.1192/pb.39.4.206a. [DOI] [PMC free article] [PubMed] [Google Scholar]
- 30.Seguin A, Haynes RB, Carballo S, Iorio A, Perrier A, Agoritsas T. Translating clinical questions by physicians into searchable queries: Analytical survey study. JMIR Med Educ. 2020;6:e16777. doi: 10.2196/16777. [DOI] [PMC free article] [PubMed] [Google Scholar]