

Abstract
Background:
Patients with hypertrophic cardiomyopathy (HCM) are at risk for sudden death and individuals with ≥1 major risk markers are considered for primary prevention implantable cardioverter defibrillators. Guidelines recommend cardiac magnetic resonance imaging (CMR) to identify high-risk imaging features. However, CMR is resource intensive and is not widely accessible worldwide.
Objective:
To develop electrocardiogram (ECG) deep-learning (DL) models for identification of HCM patients with high-risk features.
Methods:
HCM patients evaluated at Tufts Medical Center (N=1,930; Boston, United States) were used to develop ECG-DL models for prediction of high-risk imaging features: systolic dysfunction, massive hypertrophy (≥30mm), apical aneurysm, and extensive late-gadolinium enhancement (LGE). ECG-DL models were externally validated in an HCM cohort from Amrita Hospital (N=233; Kochi, India).
Results:
ECG-DL models reliably identified high-risk features (systolic dysfunction, massive hypertrophy, apical aneurysm, and extensive LGE) during hold-out model testing (c-statistics 0.72, 0.83, 0.93, and 0.76) and external validation (c-statistics 0.71, 0.76, 0.91, and 0.68). A hypothetical screening strategy employing echocardiography combined with ECG-DL guided selective CMR use demonstrated sensitivity of 97% for identifying patients with high-risk features, while reducing the number of recommended CMRs by 61%. Negative predictive value with this screening strategy for absence of high-risk features in patients without ECG-DL recommendation for CMR was 99.5%.
Conclusions:
In HCM, novel ECG-DL models reliably identified patients with high-risk imaging features while offering the potential to reduce CMR testing requirements in under-resourced areas.
Keywords: Hypertrophic cardiomyopathy, sudden cardiac death, electrocardiography, cardiac magnetic resonance imaging, risk prediction, deep-learning
Graphical Abstract

Introduction
Hypertrophic cardiomyopathy (HCM) is the most common inherited heart disease, with a prevalence of up to 1 in 200 worldwide(1). While patients with HCM are at risk for SCD, the emergence of mature risk stratification strategies to identify high-risk HCM patients most likely to benefit from SCD prevention with implantable cardioverter-defibrillators (ICD) has led to significant reduction in HCM-related mortality(2).
Current American Heart Association/American College of Cardiology (AHA/ACC) guidelines for HCM recommend consideration of primary prevention ICD in patients with one or more major markers of high arrhythmic risk(3). Four of these risk markers are derived from non-invasive imaging: end-stage HCM with systolic dysfunction (left ventricular (LV) ejection fraction (EF) < 50%); massive LV hypertrophy (wall thickness ≥ 30mm); LV apical aneurysm(4); and extensive late gadolinium enhancement (LGE) (≥15% of LV mass). While echocardiography is the first-line imaging test in evaluation of HCM patients, it may be unreliable in identifying high-risk features, e.g. underestimating LV wall thickness(5), missing up to 50% of smaller apical aneurysms(6), and providing no assessment of myocardial scarring/fibrosis(7). For these reasons, the AHA/ACC guidelines recommend high-spatial resolution CMR imaging for those HCM patients not judged to be at high-risk for SCD after traditional evaluation and, since morphologic changes can develop over time, longitudinal evaluation with repeat CMR imaging every 3 to 5 years(3,8). However, routine CMR testing may not be logistically possible at many practicing HCM centers due to high cost and limited resource availability(9). These barriers are most pronounced in areas where there are significantly fewer facilities with the infrastructure and expertise to perform and interpret CMRs(10), the cost of CMR is exaggerated relative to other testing modalities(11), and the penetrance of health insurance coverage is low(12). These factors thus render routine use of CMR impractical for many patients with HCM. Low-cost tools for guiding prioritization of CMR testing thus represent an opportunity for improved high-value resource allocation in HCM globally.
The 12-lead electrocardiogram (ECG) is inexpensive, widely available, and routinely performed over many years in HCM patients(13,14). In the present study, we sought to leverage ECG data using deep-learning (DL) computational techniques to develop of screening tools that identify both 1) HCM patients with and without high-risk imaging features; and 2) those patients who are most likely to benefit from CMR imaging for risk stratification.
Methods
Study design
We conducted an observational, retrospective cohort study in accordance with the Transparent Reporting of a Multivariable Prediction Model for Individual Prognosis or Diagnosis (TRIPOD) statement(15). This study was approved by the institutional review boards of Tufts Medical Center (Boston, Massachusetts. United States) and Amrita Hospital (Kochi, Kerala. India).
Study Population
The study population used for model development and hold-out testing was comprised consecutive patients evaluated clinically at Tufts Medical Center between 2004 and 2021 (Boston Cohort). A separate cohort of patients evaluated at the Amrita Hospital HCM Center(11) was used for external model validation (Kochi Cohort). Patients were included if (i) they received a formal clinical diagnosis of HCM based on standard criteria(3), i.e., hypertrophied non-dilated LV with wall thickness ≥ 15mm in the absence of another cardiac or systemic disease capable of producing a similar magnitude of hypertrophy during the patient’s clinical course, or wall thickness ≥ 13mm with a family history or known pathologic/likely pathogenic gene for HCM, and (ii) had ECG obtained at the time of initial evaluation. Initial clinical evaluation was defined as the first assessment at either HCM center with available echocardiography and/or CMR diagnostic for HCM. Patients with septal reduction therapy prior to initial evaluation (either alcohol septal ablation or surgical myectomy) were excluded.
Data Collection and Definitions
Demographic and clinical data were obtained from medical records of patients meeting the above criteria. Electrocardiography, echocardiography and CMR were obtained as clinically indicated.
Electrocardiography
Electrocardiograms were performed using GE Marquette (Boston Cohort) and GE MAC5 A4 (Kochi Cohort) ECG machines (GE Healthcare, Chicago, US), with 10 second, 12-lead voltage tracings acquired at 500 Hz. ECGs were manually reviewed for pathologic features based upon standard definitions (Supplemental Table 1).
Echocardiography
Transthoracic echocardiographic studies (GE Healthcare, Chicago, US or Philips, Best, the Netherlands) were performed and analyzed according to clinical standards with maximum end-diastolic LV wall thickness measurements and presence or absence of LV apical aneurysms confirmed by senior cardiologists with extensive HCM expertise (Boston cohort: EJR, BJM, or MSM. Kochi cohort: HA or RK). LVEF was quantified from 2-dimensional images using the modified Simpson’s rule formula.
CMR
CMR imaging was performed with a 1.5-T scanner (Philips, Best, the Netherlands; or Siemens, Erlangen, Germany) for the Boston cohort and with either a 3.0-T (Siemens, Erlangen, Germany) or 1.5-T scanner (GE, Milwaukee, US) for the Kochi cohort. Image acquisition protocols were similar, with cines for LV structure and function acquired using steady-state, free-precession breath-held sequences in 3 long-axis planes and sequential short-axis slices from the atrioventricular ring to the apex(16). LGE images were acquired 10 to 20 minutes after intravenous administration of 0.2 mmol/kg gadolinium with breath-hold 2-dimensional segmented inversion-recovery sequence or phase-sensitive inversion-recovery sequences in identical planes as in cine images. LGE quantification was performed as previously described by expert readers as part of real-world clinical practice (Boston cohort: EJR or MSM. Kochi cohort: HA or RRK)(7,8).
High-Risk HCM Feature Definitions
Imaging-based high-risk features were defined according to the 2020 AHA/ACC guidelines for the diagnosis and management of HCM(3).
Systolic Dysfunction: LVEF ≤ 50% at rest.
Massive hypertrophy: maximal LV wall thickness of ≥ 30mm.
Apical Aneurysm: presence of a discrete, thin-walled, dyskinetic or akinetic segment of the distal portion of the LV chamber associated with regional scarring.
Extensive LGE (fibrosis): LGE comprising ≥ 15% of total LV myocardial mass.
ECG-DL Model Development and Testing
Convolutional neural networks which received ECG voltage tracings as input were developed to predict the four high-risk imaging features defined above: 1) systolic dysfunction, 2) massive hypertrophy, 3) apical aneurysm, and 4) extensive LGE. A detailed description of the ECG-DL model design is presented in the Supplemental Methods. Briefly, a variational auto-encoder (VAE) was pre-trained on median-beat ECG voltage wave-forms (12 leads, 1.2 seconds, 250 Hz) derived from the large, open-source PhysioNet/Computing in Cardiology ECG Challenge Database (n=88,105)(17). Individual HCM patient ECGs were then converted to latent space encodings (24 latent variables) using the encoder portion of the pre-trained VAE. These latent variables, along with patient age, sex, and heart rate, were used as the inputs to newly trained dense-network classifiers for prediction of each of the high-risk imaging features (Figure 1). During model development, the Boston cohort was divided randomly according to an 80%/20% split into development (n=1,544) and hold-out testing (n=386) datasets. Models were trained on the HCM development dataset using 5-fold cross-validation, and, for each high-risk feature, the single model with the best area under the receiver-operator curve (AUROC) derived c-statistic within the validation fold was selected for subsequent analysis in the hold-out testing dataset and Kochi external validation dataset (n=233). For each of the four models, only patients with known presence/absence of the high-risk imaging feature of interest were included during training (i.e. complete case analysis; missingness of each feature is presented in Supplemental Table 2). Model code including trained weights will be made publicly available upon manuscript publication.
Figure 1:
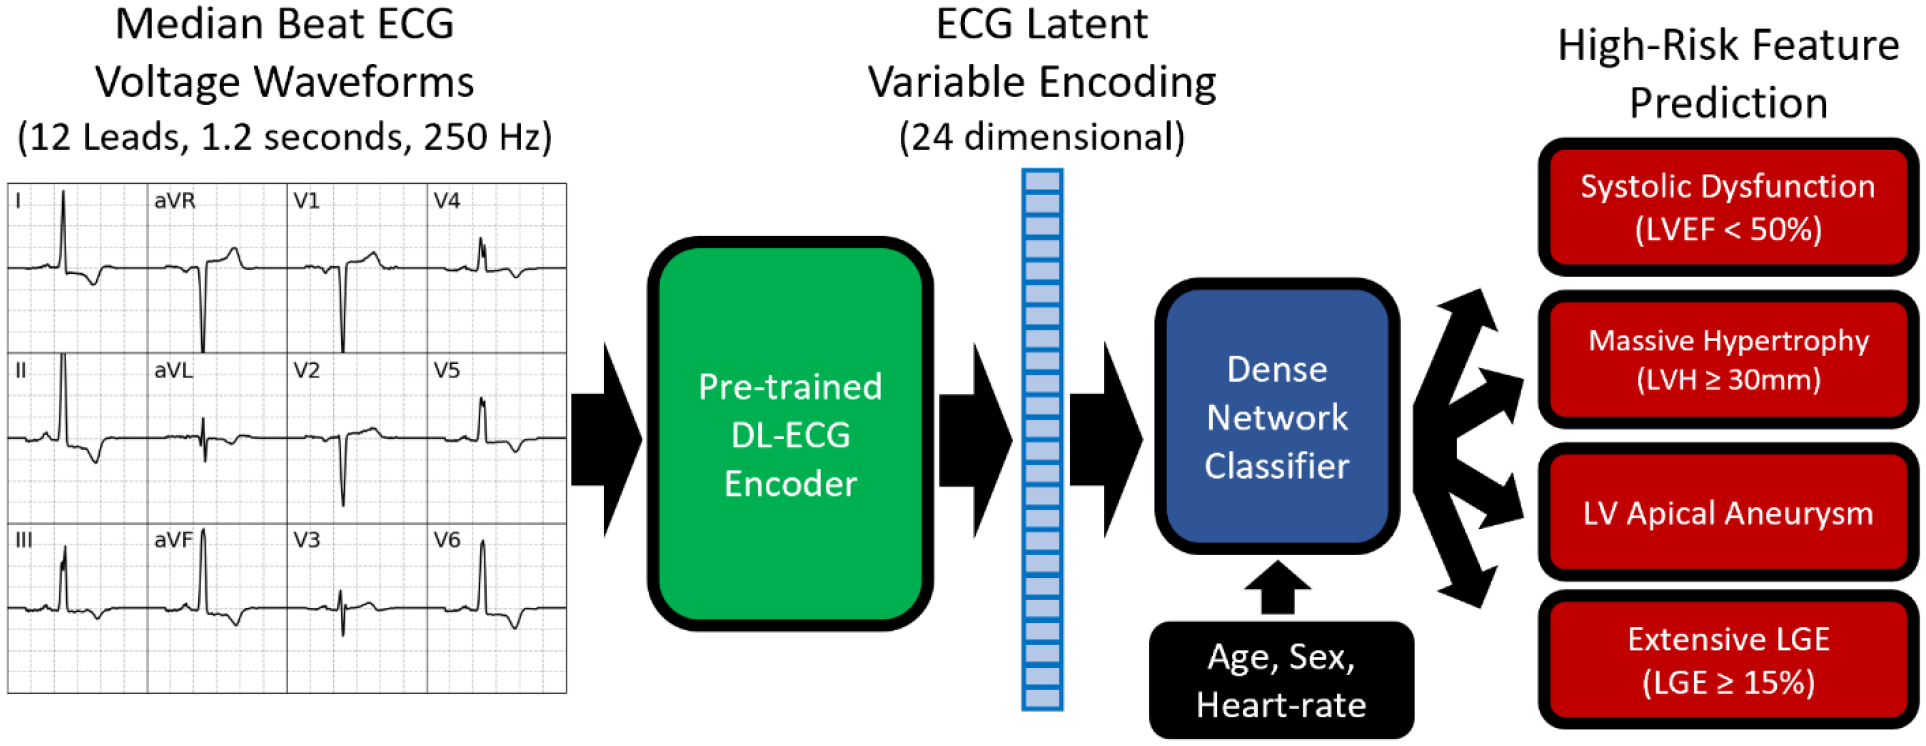
VAE based ECG-DL model for prediction of high-risk imaging features in HCM patients.
Model discriminations were assessed in the hold-out testing and external validation cohorts using AUROC-derived c-statistics, with mean and 95% confidence intervals determined using 5-fold bootstrapping without replacement. Cutoffs for converting the continuous model predictions to dichotomous predictions were selected to achieve sensitivity of 80% for each individual high-risk feature.
Saliency Analysis
Use of the pre-trained VAE enabled visual assessment of characteristic ECG features that differentiate patients with and without each of the high-risk imaging features. Representative ECG latent space encodings were generated using the averaged values of each of the 24 latent variables, and these encodings were then decoded into 12-lead, median-beat ECG voltage wave-forms using the decoder portion of the pre-trained VAE.
Clinical Utility of ECG-DL Models
We evaluated the potential utility of ECG-DL as an adjunct to echocardiography-based identification of HCM patients with high-risk imaging features. Three alternative screening strategies to detect high-risk imaging features were compared among HCM patients from both the Boston and Kochi cohorts with available CMR data: (1) routine use of echocardiography and unselective use of CMR in all patients, (2) routine use of echocardiography alone without the use of CMR in any patient, and (3) routine use of echocardiography in all patients followed by selective use of CMR only in patients in whom high-risk phenotype was predicted by ECG-DL.
For all strategies, CMR was considered the gold-standard for identification of high-risk features. Sensitivity, specificity, positive predictive value (PPV) and negative predictive value (NPV) were defined according to prediction of high-risk features prior to CMR testing. For example, patients suspected of a high risk feature by ECG-DL but who did not have a high risk phenotype identified by CMR were considered false positive. Additionally, we defined CMR testing efficiency as the percentage of recommended CMR tests that resulted in positive identification of a high-risk feature. For example, if ECG-DL recommended CMR in two patients with only one patient having a high-risk feature identified on CMR, CMR testing efficiency would be 50%.
Statistical Analysis
Categorical variables were summarized as frequencies (%) and compared using proportional z-tests. Continuous variables were presented as mean ± standard deviation or median [interquartile range (IQR)], and compared using independent sample Students t-tests or the Mann-Whitney U-tests, respectively. Individual metrics of the screening strategies were compared using proportions z-testing. All statistical analyses were performed using Python 3.9.13; DL model development was performed using TensorFlow (2.10.0).
Results
Study Population
The Boston cohort included 1,930 HCM patients. Baseline patient characteristics are presented in Table 1; 60% were men (n=1,165) and average age was 55±16 years. Most patients were symptomatic, including 588 (31%) with NYHA class II symptoms and 607 (32%) with NYHA class III/IV symptoms. Median peak LV outflow tract gradient was 60 mmHg [IQR; 0, 90]; 712 (37%) patients had resting gradient ≥ 30mmHg.
Table 1:
Baseline characteristics of patients included in both the Boston cohort used for model development and hold-out testing and the Kochi cohort used for external model validation.
| Boston, US (N=1,930) | Kochi, India (N=233) | p-value | |
|---|---|---|---|
| Age (years) | 55.4 (±15.5) | 55.6 (±16.5) | 0.87 |
| Male Sex | 1,165 (60.4%) | 179 (76.8%) | <0.0001 |
| NYHA Class I | 735 (38.0%) | 92 (39.5%) | 0.67 |
| NYHA Class II | 588 (30.5%) | 109 (46.8%) | <0.0001 |
| NYHA Class III/IV | 607 (31.5%) | 32 (13.7%) | <0.0001 |
| Maximal Wall Thickness (mm) | 17.9 (±3.8) | 19.6 (±6.2) | <0.0001 |
| Resting LVOT Gradient ≥ 30 mmHg | 712 (36.9%) | 48 (20.6%) | <0.0001 |
| Systolic Dysfunction (LVEF ≤ 50%) | 39 (2.0%) | 29 (12.4%) | <0.0001 |
| Massive LV Hypertrophy (Wall thickness ≥ 30mm) | 41 (2.1%) | 24 (10.3%) | <0.0001 |
| LV Apical Aneurysm | 72 (3.7%) | 1 (0.4%) | 0.008 |
| CMR performed | 1,584 (82.1%) | 104 (44.6%) | <0.0001 |
| LGE ≥ 15% | 57 (3.0%) | 30 (12.9%) | <0.0001 |
| Any High-Risk Imaging Feature | 185 (9.6%) | 63 (27.0%) | <0.0001 |
Echocardiography was performed in all patients, and CMR was performed in 1,584 patients (82%). High-risk imaging features were identified in 185 patients (9.6%), including 39 (2.0%) with systolic dysfunction, 41 (2.1%) with massive hypertrophy, 72 (3.7%) with apical aneurysm, and 57 (3.0%) with extensive LGE. More than one high-risk feature was identified in 23 patients (1.2%). ECGs were obtained within 1 [IQR: 0; 50] day of CMR testing. Manually identified ECG features for each high-risk feature and comparison to ECG features among patients with no high-risk features are presented in Supplemental Table 3. Abnormal ECG characteristics were common to HCM patients both with and without high risk features, and abnormalities were nonspecific for each of the high-risk markers.
Compared to those imaged by CMR, patients from the Boston cohort who did not undergo CMR examination were more likely to have at least one non-imaging derived AHA/ACC guideline-defined SCD risk factor (34% vs. 17%, p<0.0001) and were more likely to have ICD placed by the referring care-team prior to evaluation at the Tufts HCM center (42% vs. 3%, p <0.0001) (Supplemental Table 4).
ECG-DL Models for High-Risk Feature Identification
From the Boston cohort, 1,544 HCM patients were included in model development and 386 were reserved for hold-out model testing. ECG-DL effectively identified each of the high-risk imaging features, with moderate to strong discrimination within the hold-out testing cohort for detection of systolic dysfunction (c-statistic 0.72 [95%CI: 0.69, 0.75]), massive hypertrophy (c-statistic 0.83 [95%CI: 0.82, 0.85]), apical aneurysm (c-statistic 0.93 [95%CI: 0.92, 0.94]), and extensive LGE (c-statistic 0.76 [95%CI: 0.72, 0.79]).
The decoder portion of the pre-trained VAE was used to visualize representative ECGs for patients with and without each of the high-risk imaging features (Figure 2). Patients with systolic dysfunction had lateral T-wave inversions and higher anterior pre-cordial QRS amplitudes. Patients with massive hypertrophy had greater QRS amplitude (particularly in anterior precordial leads) with accompanying ST depressions. Patients with apical aneurysms had greater QRS amplitude in lateral leads with deep lateral T-wave inversions. Patients with extensive LGE had similar ECG morphologies to those with systolic dysfunction.
Figure 2: Saliency analysis.
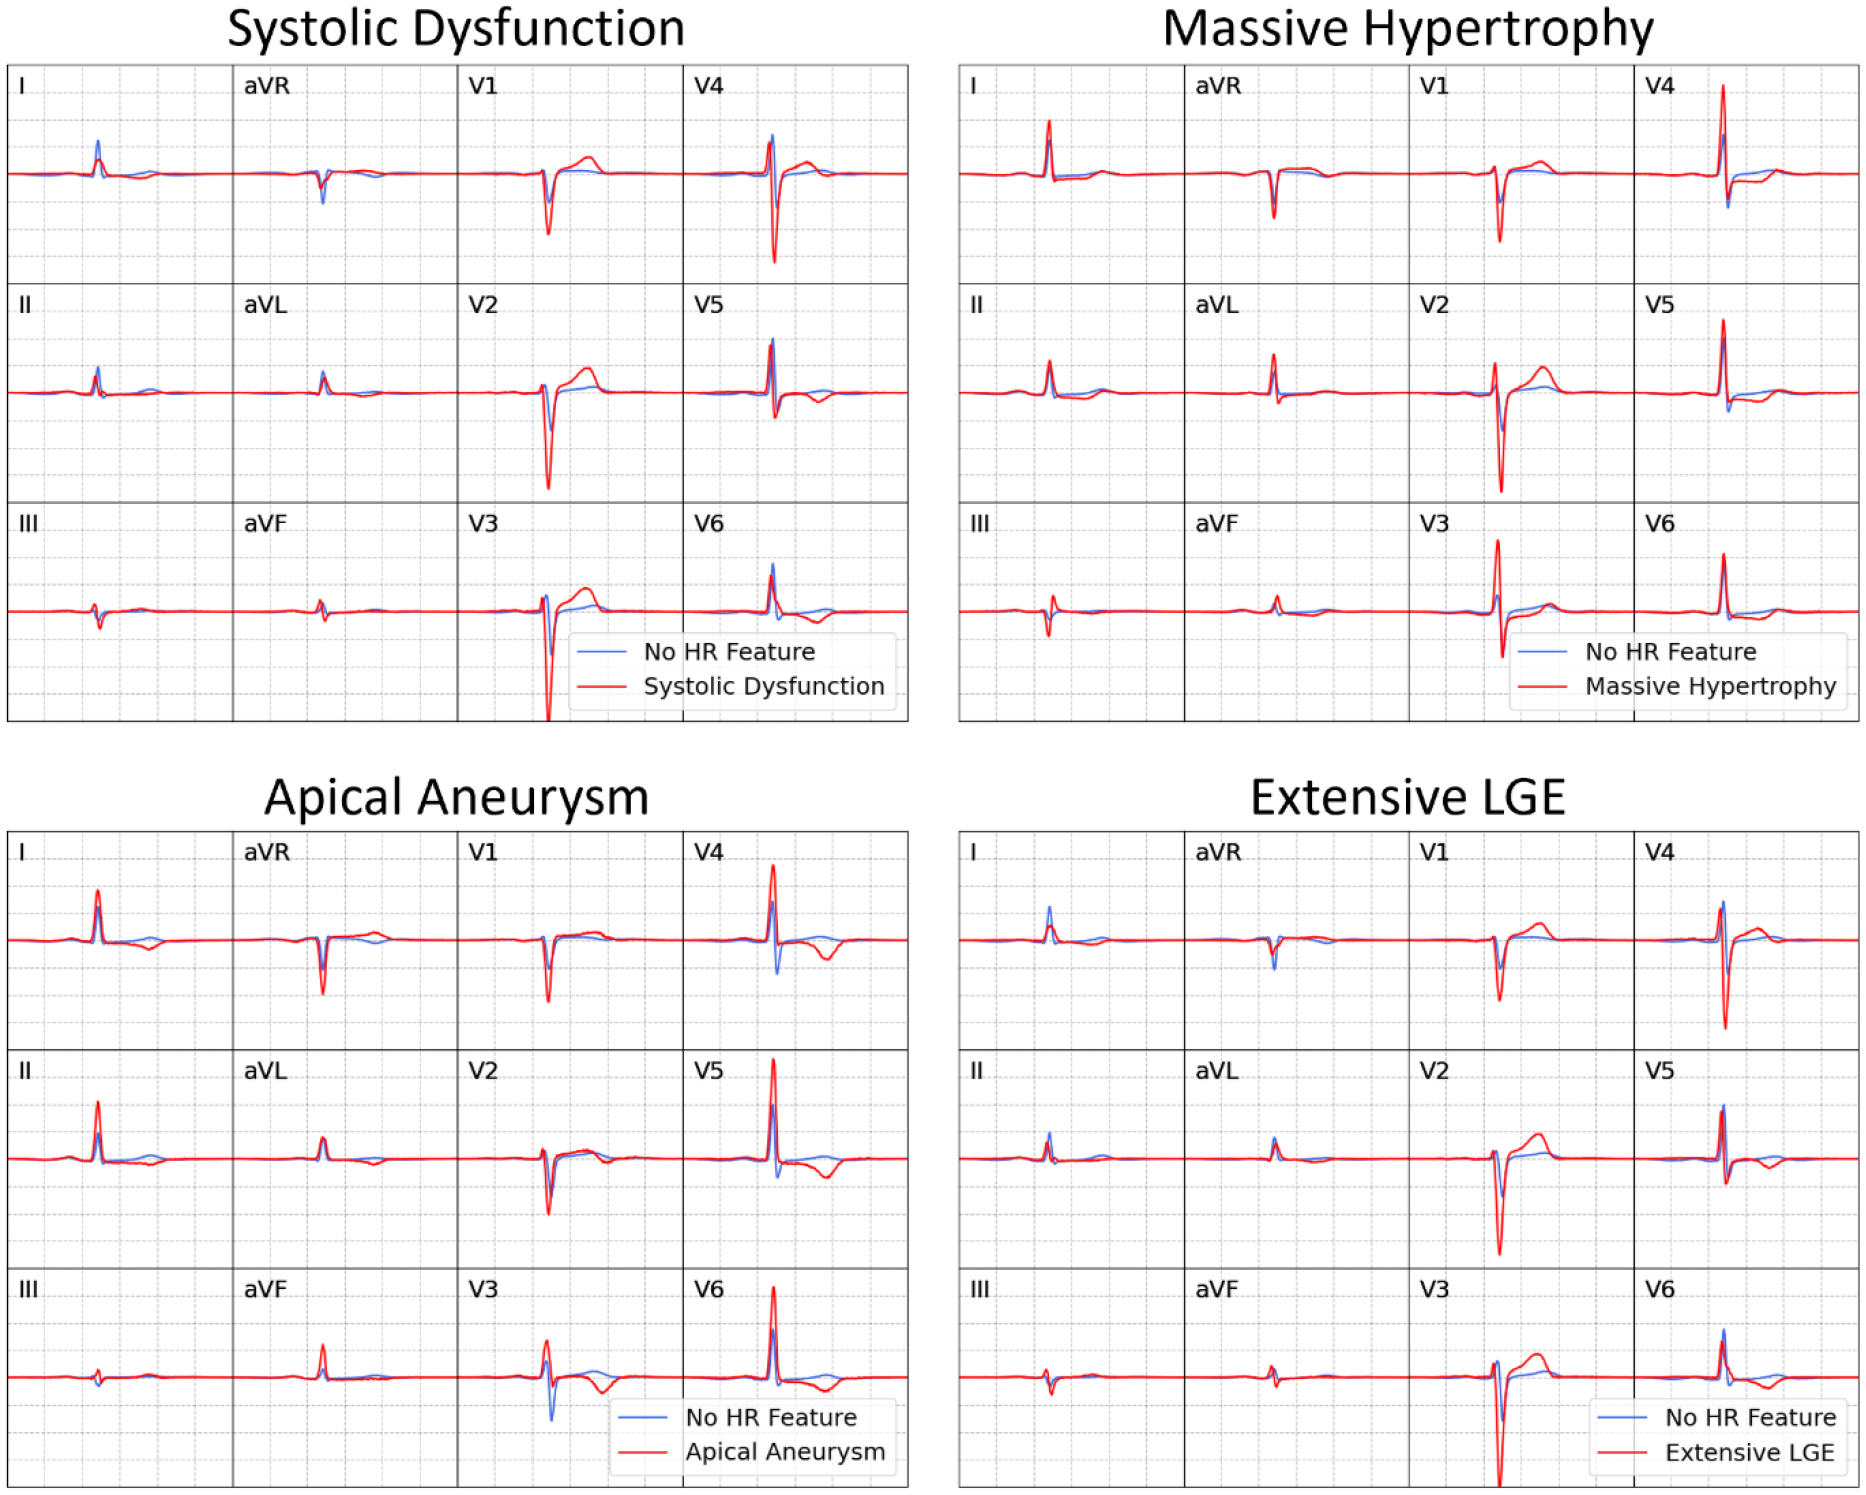
Representative ECGs are obtained by averaging latent variables for each high-risk (HR) feature and converting to 12-lead, median-beat ECG voltage wave-forms using the pre-trained VAE decoder.
External Validation of ECG-DL Models
The Kochi cohort included 233 HCM patients (mean age 56 years). Compared to the Boston cohort (Table 1), these patients were more frequently male (77% vs 60%, p<0.0001) and were less likely to have outflow obstruction at rest (21% vs 37%, p<0.0001). Given more limited CMR availability, the rate of CMR testing was much lower (45% vs 82%, p<0.0001). High-risk imaging features were more common (27% vs. 10%, p<0.0001), including systolic dysfunction (12% vs 2%, p<0.0001), massive hypertrophy (10% vs 2%, p<0.0001), and extensive LGE (13% vs 3%, p<0.0001). Only one patient with apical aneurysm was identified in the validation cohort (0.4%).
ECG-DL demonstrated moderate to strong discrimination within the external validation cohort for detection of systolic dysfunction (c-statistic 0.71 [95%CI: 0.69, 0.73]), massive hypertrophy (c-statistic 0.76 [95%CI: 0.75, 0.78]), apical aneurysm (c-statistic 0.91 [95%CI: NA]). C-statistic for identification of extensive LGE was 0.68 [95%CI: 0.67, 0.69].
ECG-DL for Clinical High-risk Feature Screening
We evaluated a series of hypothetical screening strategies to identify HCM patients with high-risk imaging features (Table 2). In the subset of all patients for whom CMR imaging was performed (N=1,688, including n=1,584 from Boston and n=104 from Kochi), 206 high-risk imaging features were identified in 167 patients, including 31 with systolic dysfunction, 42 with massive hypertrophy, 46 with apical aneurysm, and 87 with extensive LGE; 36 patients had ≥2 high-risk imaging features.
Table 2:
Comparison of alternative screening protocols for the identification of high-risk imaging in combined patients from the Boston and Kochi cohorts who underwent CMR examination. Here, † signifies a statistically significant difference relative to echocardiography alone strategy, ‡ signifies a statistically significant difference relative to echocardiography plus unselective CMR testing strategy.
| High-Risk Imaging Feature Screening Strategy | ||||
|---|---|---|---|---|
| Echocardiography + Unselective CMR in all patients | Echocardiography but no CMR in any patients | Echocardiography + Selective CMR use guided by ECG-DL | ||
| Number of CMR Studies Recommended | 1,688/1,688 (100%) | 0/1,688 (0%) | 662/1,688 (39%) | |
| Number Correctly Identified | Patients with ≥1 High-Risk Features (n=167) | 167/167 (100%) | 89/167 (53%) | 162/167 (97%) |
| Total High-risk Features (n=206) | 206/206 (100%) | 92/206 (45%) | 201/206 (98%) | |
| Systolic Dysfunction (n=31) | 31/31 (100%) | 31/31 (100%) | 31/31 (100%) | |
| Massive Hypertrophy (n=42) | 42/42 (100%) | 26/42 (62%) | 42/42 (100%) | |
| Apical Aneurysm (n=46) | 46/46 (100%) | 35/46 (76%) | 44/46 (96%) | |
| Extensive LGE (n=87) | 87/87 (100%) | 0/87 (0%) | 84/87 (97%) | |
| Sensitivity | 100% | 53% | 97%†‡ | |
| Specificity | 0% | 99.7% | 67%†‡ | |
| Positive Predictive Value | 9% | 96% | 24%†‡ | |
| Negative Predictive Value | NA | 95% | 99.5%† | |
| CMR Testing Efficiency | 10% | NA | 25%‡ | |
A screening strategy of echocardiography plus universal CMR testing in all patients by definition identified all 167 patients with high-risk imaging features. However, this approach also required CMR evaluation of all 1,688 patients, resulting in a low CMR testing efficiency of only 10%.
A strategy of echocardiography alone (without CMR) identified 89 of 167 higher-risk patients. This strategy, by definition, required no CMR utilization, however, sensitivity to identify higher risk patients was only 53%. Thus, 47% of the patients with high-risk features at increased risk for SCD would not have been identified by this strategy.
Finally, a screening strategy employing echocardiography followed by application of ECG-DL models to guide selective CMR use recommended CMR in only 662 patients while identifying 162 of the 167 HCM patients with high-risk imaging features. This strategy therefore maintained high sensitivity (97%) and testing efficiency (25%). Negative predictive value for this strategy was 99.5%, with only 5 of the 1,026 patients without CMR recommendation having unidentified high-risk features. Thus, the hypothetical use of ECG-DL models to guide CMR use resulted in only slightly lower sensitivity (97% vs 100%, p=0.024) but significantly improved testing efficiency (25% vs 10%, p<<0.0001) and required 61% less CMR (n=662 versus n=1,688) compared to a strategy of universal CMR screening (Table 2).
Discussion
In this study, a novel set of ECG-DL models reliably identified HCM patients with imaging-based SCD risk markers that guide consideration of primary prevention ICDs according to the 2020 AHA/ACC guidelines(3), including systolic dysfunction, massive hypertrophy, apical aneurysm, and extensive LGE. In addition, we demonstrated the potential clinical utility of ECG-DL as a method for guiding CMR allocation. By identifying those HCM patients most-likely to benefit from CMR to substantiate high-risk, ECG-DL models increased CMR testing efficiency and thereby reduced the number of CMRs required without sacrificing sensitivity. These findings support a possible role for ECG-DL based risk stratification in directing efficient allocation of advanced imaging resources. This is of particular relevance in regions where such resources may be limited, as in our validation cohort from the Amrita Hospital HCM Center in Kochi, India.
Applications of ECG-DL in HCM
Recently, ECG-DL models have emerged as powerful tools for expanding the diagnostic capabilities of ECG. While manually-defined ECG characteristics have limited utility in predicting SCD in HCM(13), prior studies have shown association between ECG parameters and HCM-specific CMR findings such as LVH and LGE(14). Our findings corroborate this linkage between cardiac structure and electrophysiologic manifestations, and further demonstrate that ECG-DL can be utilized to improve identification of high-risk imaging features.
During saliency analysis, visualization of representative high-risk ECGs using the ECG-DL decoder demonstrated a number of recognizable waveform patterns that could be manually identified (e.g. deep lateral T-Wave inversions in patients with apical aneurysm), thus confirming a biologic basis underpinning the ECG-DL predictions. However, the results of the ECG-DL predictions transcend the predictive capability of individual ECG features. Manually identified ECG abnormalities are common in HCM patients without high-risk features (Supplemental Table 3), and therefore, in isolation, had low specificity for any particular high-risk imaging feature. ECG-DL thus has the potential to improve risk prediction beyond that offered by manual assessment of the presence of any individual ECG abnormality, leveraging a more comprehensive assessment of ECG voltage wave-forms including identification of readily apparent ECG abnormalities (confirming those identified on manual assessment of ECGs) as well as features that are less readily apparent or are more difficult to quantitate. Additionally, due to non-linear connections between layers in the dense network classifier, complex relationships among these ECG characteristics are also incorporated into model predictions.
While prior models have been developed to diagnose HCM(18–20) as well as higher-risk features such as systolic dysfunction within the general population(21), the models reported here represent to our knowledge the first examples of openly available, HCM-specific tools developed using ECG-DL techniques to identify higher risk HCM phenotypes. Unlike most ECG-DL applications that rely on very large patient cohorts to generate diagnostic associations, the HCM-specific nature of our project limited training to a smaller, but more deeply phenotyped, cohort of HCM patients. These analyses therefore represent a concrete example of how the ECG-DL models can be leveraged to improve individualized risk assessment in relatively uncommon cardiac disorders such as HCM.
Clinical Utility
Although each of the ECG-DL models demonstrated good discrimination, we do not suggest that ECG-DL should replace imaging-based risk stratification with echocardiography or CMR, or that primary prevention ICD implantation decisions can (or should) be made solely based on predictions from our models. Nor was the intent of our ECG-DL models to identify HCM diagnosis from the general population. Instead, these ECG-DL models may be most clinically useful in patients with HCM diagnosed by echocardiography as a way to guide downstream allocation of CMR imaging. Towards this purpose, we assessed a hypothetical strategy relying on initial diagnostic echocardiography followed by application of our ECG-DL models to identify patients who would benefit from additional testing with CMR. This step-wise screening strategy was associated with excellent sensitivity (97%) for detection of patients with high-risk features, and demonstrated demonstrated excellent negative predictive value (>99%). Therefore, those HCM patients for whom CMR testing is not recommended are extremely unlikely to have undiagnosed high-risk imaging features. Additionally, this ECG-DL based screening strategy reduced the required number of CMR studies by >60%. The advantages of this approach would be most relevant in resource-limited settings in which routine CMR examinations are impractical for all HCM patients while ECGs are inexpensive and widely available. If further validated longitudinally, this approach would also inform the value of performing subsequent CMRs to update SCD risk stratification.
We assessed the performance of our ECG-DL models in a cohort of HCM patients from the HCM Center at Amrita Hospital in Kochi, India, where routine CMR for HCM patients is less available. This cohort represents an HCM patient population distinctly different from the US HCM patient cohort. Patients from Kochi had higher rates of marked LV hypertrophy, systolic dysfunction, and extensive LGE. This likely reflects the referral bias in Kochi towards more symptomatic patients with higher SCD risk ultimately being evaluated by the region’s only dedicated HCM center. Unlike in the US, routine cardiovascular screening (which may identify otherwise asymptomatic patients via auscultation of cardiac murmur or ECG abnormalities) is less common in India(22). Nonetheless, ECG-DL identification of systolic dysfunction, massive hypertrophy, and apical aneurysm remained robust during external validation.
Limitations
This was a retrospective, observational study of HCM patients evaluated at comprehensive, dedicated (but diverse) HCM referral centers in the US and India, which may not be representative of other HCM populations in terms of patient selection and use of CMR, which could have influenced risk markers and stratification. CMR use was not universal in either cohort and there may have been unidentified high-risk imaging features in the subset of patients without CMR. While ECG-DL predictions of extensive LGE remained reasonable, they were less reliable than expected in the Amrita cohort (c-statistic 0.68). This likely reflects the more limited subset of patients for whom CMR imaging was available (n=104/233; ~40%, or around half the CMR testing rate of the Boston cohort). Further testing of this ECG-DL model in a larger external cohort with more routine CMR in consecutive patients remains necessary.
Conclusions
We present a novel set of ECG-DL models that reliably identify high-risk imaging features associated with SCD in patients with HCM. These models demonstrate strong discrimination for identification of systolic dysfunction, massive LV hypertrophy, apical aneurysm, and extensive LGE. A hypothetical risk stratification strategy relying on ECG-DL to guide selective CMR use demonstrated excellent sensitivity for detection of high-risk features while significantly reducing the number of CMR studies required. These findings demonstrate that, by leveraging widely available, inexpensive ECG data, ECG-DL tools have the potential to refine the selection of HCM patients requiring CMR for SCD risk stratification, potentially reducing unnecessary, unavailable, and costly advanced imaging tests.
Supplementary Material
Funding:
RTC is funded by an NIH T32 Grant (T32HL007227), the NIH LRP (L30HL165535), and the Semyon and Janna Friedman Foundation Cardiology Fellowship Award.
Disclosures:
MSM: consultant for Cytokinetics, iRhythm, Imbria Pharmaceuticals, TAKEDA Pharmaceuticals; EJR: research funding from Pfizer, iRhythm. The remaining authors have nothing to disclose.
Abbreviations:
- HCM
Hypertrophic Cardiomyopathy
- CMR
Cardiac Magnetic Resonance
- ECG
Electrocardiogram
- DL
Deep-learning
- LGE
Late gadolinium enhancement
- LV
Left ventricle
- SCD
sudden cardiac death
- VAE
Variational Auto-encoder
- EF
ejection fraction
- PPV
positive predictive value
- NPV
negative predictive value
Footnotes
Publisher's Disclaimer: This is a PDF file of an unedited manuscript that has been accepted for publication. As a service to our customers we are providing this early version of the manuscript. The manuscript will undergo copyediting, typesetting, and review of the resulting proof before it is published in its final form. Please note that during the production process errors may be discovered which could affect the content, and all legal disclaimers that apply to the journal pertain.
References
- 1.Semsarian C, Ingles J, Maron MS, Maron BJ. New perspectives on the prevalence of hypertrophic cardiomyopathy. J Am Coll Cardiol 2015;65:1249–1254. [DOI] [PubMed] [Google Scholar]
- 2.Maron BJ, Rowin EJ, Casey SA, Maron MS. How Hypertrophic Cardiomyopathy Became a Contemporary Treatable Genetic Disease With Low Mortality: Shaped by 50 Years of Clinical Research and Practice. JAMA Cardiol 2016;1:98–105. [DOI] [PubMed] [Google Scholar]
- 3.Ommen SR, Mital S, Burke MA et al. 2020 AHA/ACC Guideline for the Diagnosis and Treatment of Patients With Hypertrophic Cardiomyopathy: Executive Summary: A Report of the American College of Cardiology/American Heart Association Joint Committee on Clinical Practice Guidelines. Circulation 2020;142:e533–e557. [DOI] [PubMed] [Google Scholar]
- 4.Rowin EJ, Maron BJ, Haas TS et al. Hypertrophic Cardiomyopathy With Left Ventricular Apical Aneurysm: Implications for Risk Stratification and Management. J Am Coll Cardiol 2017;69:761–773. [DOI] [PubMed] [Google Scholar]
- 5.Massera D, McClelland RL, Ambale-Venkatesh B et al. Prevalence of Unexplained Left Ventricular Hypertrophy by Cardiac Magnetic Resonance Imaging in MESA. J Am Heart Assoc 2019;8:e012250. [DOI] [PMC free article] [PubMed] [Google Scholar]
- 6.Lee DZJ, Montazeri M, Bataiosu R et al. Clinical Characteristics and Prognostic Importance of Left Ventricular Apical Aneurysms in Hypertrophic Cardiomyopathy. JACC Cardiovasc Imaging 2022;15:1696–1711. [DOI] [PubMed] [Google Scholar]
- 7.Chan RH, Maron BJ, Olivotto I et al. Prognostic value of quantitative contrast-enhanced cardiovascular magnetic resonance for the evaluation of sudden death risk in patients with hypertrophic cardiomyopathy. Circulation 2014;130:484–95. [DOI] [PubMed] [Google Scholar]
- 8.Rowin EJ, Maron MS, Adler A et al. Importance of newer cardiac magnetic resonance-based risk markers for sudden death prevention in hypertrophic cardiomyopathy: An international multicenter study. Heart Rhythm 2022;19:782–789. [DOI] [PubMed] [Google Scholar]
- 9.New Choice Health. National Cardiac MRI Procedure Pricing Summary. 2023.
- 10.World Health Organization. The Global Health Observatory. Magnetic resonance imaging units (per million population), total density. 2023.
- 11.Maron BJ. Importance and feasibility of creating hypertrophic cardiomyopathy centers in developing countries: the experience in India. Am J Cardiol 2015;116:332–4. [DOI] [PubMed] [Google Scholar]
- 12.Mohanty SK, Upadhyay AK, Maiti S et al. Public health insurance coverage in India before and after PM-JAY: repeated cross-sectional analysis of nationally representative survey data. BMJ Glob Health 2023;8. [DOI] [PMC free article] [PubMed] [Google Scholar]
- 13.Sherrid MV, Cotiga D, Hart D et al. Relation of 12-lead electrocardiogram patterns to implanted defibrillator-terminated ventricular tachyarrhythmias in hypertrophic cardiomyopathy. Am J Cardiol 2009;104:1722–6. [DOI] [PubMed] [Google Scholar]
- 14.Finocchiaro G, Sheikh N, Biagini E et al. The electrocardiogram in the diagnosis and management of patients with hypertrophic cardiomyopathy. Heart Rhythm 2020;17:142–151. [DOI] [PubMed] [Google Scholar]
- 15.Moons KG, Altman DG, Reitsma JB et al. Transparent Reporting of a multivariable prediction model for Individual Prognosis or Diagnosis (TRIPOD): explanation and elaboration. Ann Intern Med 2015;162:W1–73. [DOI] [PubMed] [Google Scholar]
- 16.Neubauer S, Kolm P, Ho CY et al. Distinct Subgroups in Hypertrophic Cardiomyopathy in the NHLBI HCM Registry. J Am Coll Cardiol 2019;74:2333–2345. [DOI] [PMC free article] [PubMed] [Google Scholar]
- 17.Reyna MA, Sadr N, Alday EAP et al. Will Two Do? Varying Dimensions in Electrocardiography: The PhysioNet/Computing in Cardiology Challenge 2021. 2021 Computing in Cardiology (CinC), 2021:1–4. [Google Scholar]
- 18.Ko WY, Siontis KC, Attia ZI et al. Detection of Hypertrophic Cardiomyopathy Using a Convolutional Neural Network-Enabled Electrocardiogram. Journal of the American College of Cardiology 2020;75:722–733. [DOI] [PubMed] [Google Scholar]
- 19.Siontis KC, Liu K, Bos JM et al. Detection of hypertrophic cardiomyopathy by an artificial intelligence electrocardiogram in children and adolescents. Int J Cardiol 2021;340:42–47. [DOI] [PubMed] [Google Scholar]
- 20.Goto S, Solanki D, John JE et al. Multinational Federated Learning Approach to Train ECG and Echocardiogram Models for Hypertrophic Cardiomyopathy Detection. Circulation 2022;146:755–769. [DOI] [PMC free article] [PubMed] [Google Scholar]
- 21.Attia ZI, Kapa S, Lopez-Jimenez F et al. Screening for cardiac contractile dysfunction using an artificial intelligence-enabled electrocardiogram. Nat Med 2019;25:70–74. [DOI] [PubMed] [Google Scholar]
- 22.Krishnan A, Mathur P, Kulothungan V et al. Preparedness of primary and secondary health facilities in India to address major noncommunicable diseases: results of a National Noncommunicable Disease Monitoring Survey (NNMS). BMC Health Serv Res 2021;21:757. [DOI] [PMC free article] [PubMed] [Google Scholar]
Associated Data
This section collects any data citations, data availability statements, or supplementary materials included in this article.