


Abstract
Objectives
Increasing evidence suggests that Fc‐mediated antibody effector functions have an important role in protection against respiratory viruses, including SARS‐CoV‐2. However, limited data are available on the potential differences in the development, heterogeneity and durability of these responses in children compared to adults.
Methods
Here, we assessed the development of spike S1‐specific serum antibody‐dependent cellular phagocytosis (ADCP), complement deposition (ADCD) and natural killer cell activation (ADNKA), alongside specific antibody binding concentrations (IgG, IgA and IgM) and IgG avidity in healthy adults (n = 38, 18–56 years) and children (n = 21, 5–16 years) following primary SARS‐CoV‐2 infection, with a 10‐month longitudinal follow‐up. Differences between groups were assessed using a nonparametric Kruskal–Wallis test with Dunn's multiple comparisons test.
Results
We found similar (functional) antibody responses in children compared to adults, with a tendency for increased durability in children, which was statistically significant for ADCD (P < 0.05). While ADNKA was strongly reduced in both adults (P < 0.001) and children (P < 0.05) at the latest time point, ADCP remained relatively stable over time, possibly relating to an increase in avidity of the spike‐specific antibodies (P < 0.001). Finally, the ADNKA capacity relative to antibody concentration appeared to decrease over time in both children and adults.
Conclusion
In conclusion, our data provide novel insights into the development of SARS‐CoV‐2‐specific antibody Fc‐mediated effector functions in children and adults. An increased understanding of these characteristics in specific age populations is valuable for the future design of novel and improved vaccination strategies for respiratory viruses such as SARS‐CoV‐2.
Keywords: adults, children, Fc‐functionality, monocytes, natural killer cells, viral infection
Increasing evidence suggests that Fc‐mediated antibody effector functions play a role in protection against viral disease, but limited data are available on the development, heterogeneity and durability of these responses in children compared to adults. The emergence of SARS‐CoV‐2 has provided a unique opportunity to study these in the context of a primary infection in both groups. Here, we show that virus‐specific Fc‐mediated responses in children and adults are largely similar, with a tendency for increased durability in the first.

Introduction
The humoral immune response to viral infections, including SARS‐CoV‐2, is often quantified by measuring binding antibody concentrations or virus neutralisation titres. 1 , 2 , 3 , 4 , 5 , 6 Importantly, however, virus‐specific antibodies can mediate a number of additional effector functions via the interaction of their Fc‐domain with Fc‐receptors (FcRs) on (innate) immune cells or with complement pathway proteins. 7 , 8 , 9 Increasing evidence suggests that these Fc‐mediated effector functions have an important role in protection and, in some cases, pathology during SARS‐CoV‐2 infections. 10 , 11 , 12 , 13 , 14 , 15 , 16 , 17 , 18 , 19 , 20 , 21 , 22 , 23
The most frequently studied Fc‐mediated effector functions are antibody‐dependent cellular phagocytosis (ADCP), complement deposition (ADCD) and cellular cytotoxicity (ADCC) by natural killer (NK) cells. During ADCP, antibody‐opsonised viral particles or infected cells are internalised and degraded by FcR‐expressing phagocytes such as monocytes and macrophages. Antibody‐opsonisation can also result in deposition of complement molecules on the surface of viral particles or infected cells, which can result in enhanced phagocytosis or the formation of a cytotoxic membrane‐attack complex, referred to as complement‐dependent cytotoxicity (CDC). Finally, antibody‐dependent NK cell activation (ADNKA) resulting from FcR interaction is characterised by NK cell degranulation and the release of cytotoxic molecules that will ultimately kill the infected target cell, that is ADCC.
To date, limited information is available on age‐related differences in infection‐induced development of Fc‐mediated effector functions between children and adults. One study by Selva et al. revealed differences in FcR binding of SARS‐CoV‐2‐specific antibodies between children and older adults, measured at a single time point postinfection and in the absence of a younger adult population for comparison. 24 Another study, revealing differences in phagocytosis between children and adults, also included a single time point postinfection and focussed on hospitalised individuals, which might not be representative of more common milder infections. 25 In this study, we have included at least two time points following SARS‐CoV‐2 infection in children and adult participants who are representative of the general healthy population.
A complicating factor in studying potential age‐related differences is that prior antigen exposure can influence antibody functionality. For example, changes in the isotype usage and binding strength of the antigen‐specific Fab region through affinity maturation influence Fc‐mediated effector functions. 26 , 27 Whereas naive children experience primary infections, older individuals often have a history of prior antigen exposure(s) that shapes their response, as exemplified by antibodies against respiratory syncytial virus (RSV) infection. 28 Notably, the emergence of SARS‐CoV‐2 has provided a unique opportunity to investigate the largely de novo development of Fc‐mediated antibody responses upon primary viral infection in both adults and children, which is the topic of the work described here. As cross‐reactive memory responses induced by seasonal coronaviruses to conserved coronavirus epitopes, for example in the spike S2 region or the nucleoprotein (N), have previously been described, we used the less conserved spike S1 region as an antigen in this study to focus as much as possible on primary responses. 24 , 29 The validity of this approach is supported by the previous observation that infection with seasonal, SARS‐ or MERS‐coronaviruses did not induce cross‐reactive antibodies against SARS‐CoV‐2 spike S1. 30
For the current analysis, we have longitudinally assessed the development of SARS‐CoV‐2 spike S1‐specific ADCP, ADCD and ADNKA for a period up to 10 months in a cohort consisting of previously healthy adults (n = 38, 18–56 years) and children (n = 21, 5–16 years) with a PCR‐confirmed primary SARS‐CoV‐2 infection. In addition, we measured spike S1‐specific IgG, IgA and IgM binding concentrations and IgG avidity in the same samples. Together, these data provide novel insights into age‐specific development, heterogeneity and durability of Fc‐mediated effector functions in adults and children in the absence of prior antigen exposure.
Results
Study population and disease severity
For the current analysis, we included both adults (n = 38, 18–56 years of age) and children (n = 21, 5–16 years of age) who were tested SARS‐CoV‐2 PCR‐positive during or shortly before inclusion in a prospective household cohort study initiated in March 2020. 31 Samples were obtained from all household members simultaneously at four time points: T1 was collected on average 4 days after a positive PCR test of the index case, and sample collection was repeated after 2–3 weeks (T2), 4–6 weeks (T3) and 9–10 months (T4). For children, we only included samples from T2 and T4 in the current analysis, as there was limited availability of material. Participants who received a COVID‐19 vaccination or were reinfected during the course of the study were excluded from the current analysis. Figure 1a shows a schematic overview of the participants and samples that were included in the current analysis. Details on the composition of individual households can be found in the original publication. 31 Based on questionnaire and symptoms diary data, approximately equal numbers of adult participants experienced mild (47%) and moderate (42%) symptoms while none remained asymptomatic during follow‐up. The majority of infected children experienced mild symptoms (71%), and three remained asymptomatic during follow‐up. Four adults (11%) and one child (5%) reported severe symptoms. An overview of participant characteristics can be found in Table 1.
Figure 1.

Study overview and SARS‐CoV‐2 spike S1‐specific IgG concentrations in adults and children up to 10 months after symptom onset of a primary SARS‐CoV‐2 infection. (a) Schematic overview of the study participants and sample collection schedule. Sampling time points are indicated by coloured circles on the timeline. (b, c) SARS‐CoV‐2 spike S1‐specific serum IgG binding concentrations were determined using a bead‐based immunoassay in adults (blue, A) and children (orange, C) up to 10 months after symptom onset. The kinetics graph (b) includes T1/2/3/4 samples for adults (n = 37) and T2/4 samples for children (n = 16). The black line indicates the smoothed conditional mean, the grey shading the 95% confidence interval of all samples. The boxplot (c) depicts median and quartiles for adults (n = 38) and children (n = 21). Differences between groups were assessed using a Kruskal–Wallis test with Dunn's multiple comparisons test and Holm's correction for multiple comparisons. *P < 0.05. BAU, binding antibody units.
Table 1.
Participant characteristics
| Adults (n = 38) | Children (n = 21) | |
|---|---|---|
| Age in years, median (range, SD) | 45 (18–56, 9.9) | 12 (5–16, 3.0) |
| Female sex, number (%) | 25 (66) | 10 (48) |
| Disease severity | ||
| Asymptomatic, number (%) | 0 (0) | 3 (14) |
| Mild, number (%) | 18 (47) | 15 (71) |
| Moderate, number (%) | 16 (42) | 2 (10) |
| Severe, number (%) | 4 (11) | 1 (5) |
| Time postsymptom onset for | ||
| T1 in days, mean (range, SD) | 13 (3–31, 6.6) | NA |
| T2 in days, mean (range, SD) | 29 (19–45, 6.5) | 28 (15–54, 11.3) |
| T3 in days, mean (range, SD) | 47 (35–66, 7.1) | NA |
| T4 in days, mean (range, SD) | 318 (259–352, 12.7) | 318 (289–363, 20.3) |
NA, not applicable; SD, standard deviation.
IgG, IgA and IgM antibody binding concentration kinetics
The sampling moments for each participant were timed relative to a positive PCR test of the household index case, which does not always accurately align with the timing of infection for each individual. For this reason, kinetics data for all participants are displayed relative to the day of symptom onset (based on questionnaire data) as a proxy for infection duration. When directly comparing adults to children, these data are organised by sampling time point (T2 and T4) in agreement with the design of the study. Notably, the means of the time between symptom onset and T2/T4 do not differ between adults and children (Table 1).
We first measured SARS‐CoV‐2 spike S1‐specific IgG binding concentrations using a bead‐based immunoassay. 30 A clear increase in S1‐specific IgG could be observed within 1–2 weeks from the onset of symptoms (Figure 1b). Maximum S1‐specific IgG concentrations were reached about 6 weeks after symptom onset, and at 10 months, these levels had slightly waned for most individuals. Waning could also be observed by comparing time points T2 and T4 (Figure 1c), although the decrease is only statistically significant for adults (P < 0.05). There was no statistically significant difference in the S1‐specific IgG concentrations between adults and children at either time point, although there was a trend towards increased IgG levels in children compared to adults at T4.
Similar to IgG, a clear increase in S1‐specific IgA and IgM could be observed within 1–2 weeks after symptom onset (Figure 2a and c). Both IgA and IgM levels peaked slightly earlier than IgG at approximately 3–4 weeks after symptom onset and had clearly waned by 10 months after symptom onset. In line with this observation, a clear decrease in median concentrations could be observed between T2 and T4 for IgA as well as IgM (Figure 2b and d), which was statistically significant for both adults (P < 0.001) and children (P < 0.05 and P < 0.001, respectively).
Figure 2.

SARS‐CoV‐2 spike S1‐specific IgA and IgM binding concentrations and IgG avidity in adults and children up to 10 months after symptom onset of a primary SARS‐CoV‐2 infection. SARS‐CoV‐2 spike S1‐specific serum IgA (a, b) and IgM (c, d) binding concentrations and IgG avidity (e, f) were determined using a bead‐based immunoassay in adults (blue, A) and children (orange, C) up to 10 months after symptom onset. The kinetics graphs (a, c, e) include T1/2/3/4 samples for adults (n = 30–37) and T2/4 samples for children (n = 16). The black lines indicate the smoothed conditional means, the grey shading the 95% confidence interval of all samples. The boxplots (b, d, f) depict median and quartiles for adults (n = 37 or 38) and children (n = 21). Differences between groups were assessed using a Kruskal–Wallis test with Dunn's multiple comparisons test and Holm's correction for multiple comparisons. *P < 0.05; ***P < 0.001. AU, arbitrary units.
Previous studies identified differences in the frequency of pre‐existing antibodies targeting the N protein between adults and children. 29 Therefore, we measured N‐specific IgG, IgA and IgM in our cohort (Supplementary figure 1). Compared to S1‐specific IgG, N‐specific IgG showed more pronounced waning between T2 and T4 in both adults and children (P < 0.001 and P < 0.01, respectively). In addition, children showed significantly lower levels of N‐specific IgA than adults at T4 (P < 0.05).
Analysing the S1‐specific antibody levels for adults based on sex revealed a tendency for males to have higher IgG and IgA concentrations, while no clear differences were apparent for IgM concentrations (Supplementary figure 2a–c).
Avidity of S1‐specific IgG antibodies increases over time
One important qualitative characteristic of antibodies is their avidity (an indicator of antibody binding strength), which increases over time as a result of B‐cell affinity maturation. Since Fc‐mediated effector functions depend on binding of antibodies to their specific antigen, the strength of this interaction affects their functionality. 27 As anticipated, the S1‐specific serum IgG avidity index (AI) increased over time (Figure 2e). In line with this, a statistically significant increase in AI was observed between T2 and T4 in both adults and children (P < 0.001, Figure 2f). Although there was no statistically significant difference between adults and children at T2 or T4, there was a trend towards increased avidity in children compared to adults at T4 (P = 0.096). Adult males showed a tendency for higher IgG avidity than adult females at T2, but not at T4 (Supplementary figure 2d).
Kinetics of Fc‐mediated antibody effector functions
We then assessed S1‐specific Fc‐mediated effector functions (ADCP, ADCD and ADNKA) of serum antibodies using a single‐serum dilution per assay. As these assays have an inherently limited dynamic range of approximately 2‐log, we selected the most optimal serum dilution to fit the window for quantification. However, some samples remained below the limit of quantification, especially for the ADCD assay.
S1‐specific serum antibody ADCP activity peaked at about 7 weeks after symptom onset and exhibited limited waning by 10 months after infection (Figure 3a). In line with this observation, the marginal differences in ADCP activity between T2 and T4 for both children and adults were not statistically significant (Figure 3b). There was no clear difference between the ADCP activity of adults and children at T2 or T4, although there was a trend towards increased ADCP activity in children compared to adults at T4.
Figure 3.

SARS‐CoV‐2 spike S1‐specific Fc‐mediated effector functions in adults and children up to 10 months after symptom onset of a primary SARS‐CoV‐2 infection. SARS‐CoV‐2 spike S1‐specific ADCP (a, b), ADCD (c, d) and ADNKA (e, f) activity in adults (blue, A) and children (orange, C) up to 10 months after symptom onset. The kinetics graphs (a, c, e) include T1/2/3/4 samples for adults (n = 36–37) and T2/4 samples for children (n = 16). The black lines indicate the smoothed conditional means, the grey shading the 95% confidence interval of all samples. The boxplots (b, d, f) depict median and quartiles for adults (n = 37 or 38) and children (n = 21). The horizontal grey dotted lines represent the negative PBS control. Differences between groups were assessed using a Kruskal–Wallis test with Dunn's multiple comparisons test and Holm's correction for multiple comparisons. *P < 0.05, ***P < 0.001. ADCD, antibody‐dependent complement deposition; ADCP, antibody‐dependent cellular phagocytosis; ADNKA, antibody‐dependent NK cell activation; iMFI, integrated median fluorescence intensity; NK, natural killer.
The S1‐specific serum ADCD activity showed similar kinetics as the ADCP activity, with a slightly more pronounced decrease in ADCD activity towards 10 months after infection in most individuals (Figure 3c). The median ADCD activity of the adult serum antibodies at T4 was below the limit of quantification (Figure 3d), which was significantly lower than the median at T2 (P < 0.05). For children, there was a slight increase in median ADCD activity between T2 and T4, but there was considerable variation between individuals. Whereas there was no apparent difference in ADCD activity between adults and children at T2, children did show a significantly increased ADCD activity compared to adults at T4 (P < 0.05), suggesting that this activity is more stable in children than in adults.
The S1‐specific serum ADNKA capacity showed a clear increase early postsymptom onset, with peak levels being reached at approximately 5 weeks after symptom onset and clear evidence of waning towards 10 months after infection in most individuals (Figure 3e). Furthermore, a clear decrease in ADNKA capacity could be observed between T2 and T4 in both adults (P < 0.001) and children (P < 0.05), but there was no clear difference between adults and children at T2 or T4 (Figure 3f).
In line with the observed tendency towards increased IgG and IgA levels, a trend could be observed towards increased antibody functionality in adult males compared to females (Supplementary figure 3a–c), which was statistically significant only for ADCP at T2 (P < 0.05).
Integrated analysis of the humoral response to primary SARS‐CoV‐2 infection
To obtain an indication of the relation between the different antibody features that were measured, we first created a correlation matrix based on the Spearman's rank‐order method using data from both adults and children at all measured time points (Figure 4a). All Fc‐mediated effector functions showed a strong positive correlation with IgG concentrations, followed by more moderate correlations with IgA concentration. Only ADCD and ADNKA showed a weak positive correlation with IgM concentration. The Fc‐mediated effector functions also showed strong positive correlations amongst themselves. IgG avidity showed a weak positive correlation only with ADCP, and the only negative correlations were observed between IgG avidity and IgA/IgM concentrations.
Figure 4.

Integrated analysis of SARS‐CoV‐2 spike S1‐specific antibody features. (a) A correlation matrix for all measured variables was produced based on Spearman's rank‐order correlation analysis of data from children (T2 and T4) and adults (T1–T4). Only correlations with a P‐value below 0.02 are shown as dots, of which the size and colour indicate the strength and direction of the correlation (also see the legend on the right side of the matrix). (b) Principal component analysis (PCA) was performed using data for adults and children at T2 and T4. The diagram shows the correlation between the five principal components extracted from PCA and the original variables (IgG, IgA and IgM concentration, IgG avidity, ADCP, ADCD and ADNKA). Correlations are indicated as dots of which the size and colour indicate the strength and direction of the correlation (also see legend on the right side of the matrix). PCA plots associated with the analysis in (b) visualising adults and children (c) and time of sampling (d). The coloured ellipses represent the 95% confidence ellipses of the scatter around overall assay mean of each group. ADCD, antibody‐dependent complement deposition; ADCP, antibody‐dependent cellular phagocytosis; ADNKA, antibody‐dependent NK cell activation; AI, avidity index; NK, natural killer.
We then performed an integrated analysis of the IgG, IgA and IgM concentration, IgG avidity, ADCP, ADCD and ADNKA data for both adults and children at T2 and T4 using principal component analysis (PCA). This analysis revealed that the first principal component (explaining 58.9% of the variation) showed a very strong positive correlation with especially IgG concentration and ADNKA, followed by ADCP, ADCD and IgA concentration and to a lesser extent with IgM concentration (Figure 4b). The second principal component (explaining 21.5% of the variation) showed a very strong positive correlation with IgG avidity, while showing a moderate negative correlation with IgM concentration. The associated PCA plot did not reveal a clear separation between adults and children (Figure 4c and Supplementary figure 4a), supporting the notion that differences between these groups in the assessed serological characteristics are limited. As would be expected, we did observe a separation based on time of sampling (T2 versus T4) in adults and children (Figure 4d). When integrating only the adult data for all time points (T1–T4), we did not observe a clear separation based on sex (Supplementary figure 4b, c) but did again observe separation based on time of sampling (Supplementary figure 4d).
Fc‐mediated effector functions relative to antibody concentration
As the correlation matrix revealed a strong positive correlation between IgG concentration and antibody functionality for all samples combined, we next assessed the strength of the correlations between S1‐specific IgG binding concentrations and ADCP (Figure 5a and b), ADCD (Figure 5c and d) and ADNKA (Figure 5e and f) for adults and children at T2 and T4 separately. All combinations showed a statistically significant correlation (P < 0.001), with Spearman's rank correlation coefficients ranging from 0.69 (ADCP, adults, T4) and 0.71 (ADCP, adults, T2) to 0.94 (ADNKA, children, T4) and 0.97 (ADCD, children, T2). For ADCP and ADCD, adults showed slightly weaker correlations than children, but there was no obvious separation based on age in the distribution of the datapoints relative to the mean at T2 or T4 for any of the effector functions.
Figure 5.
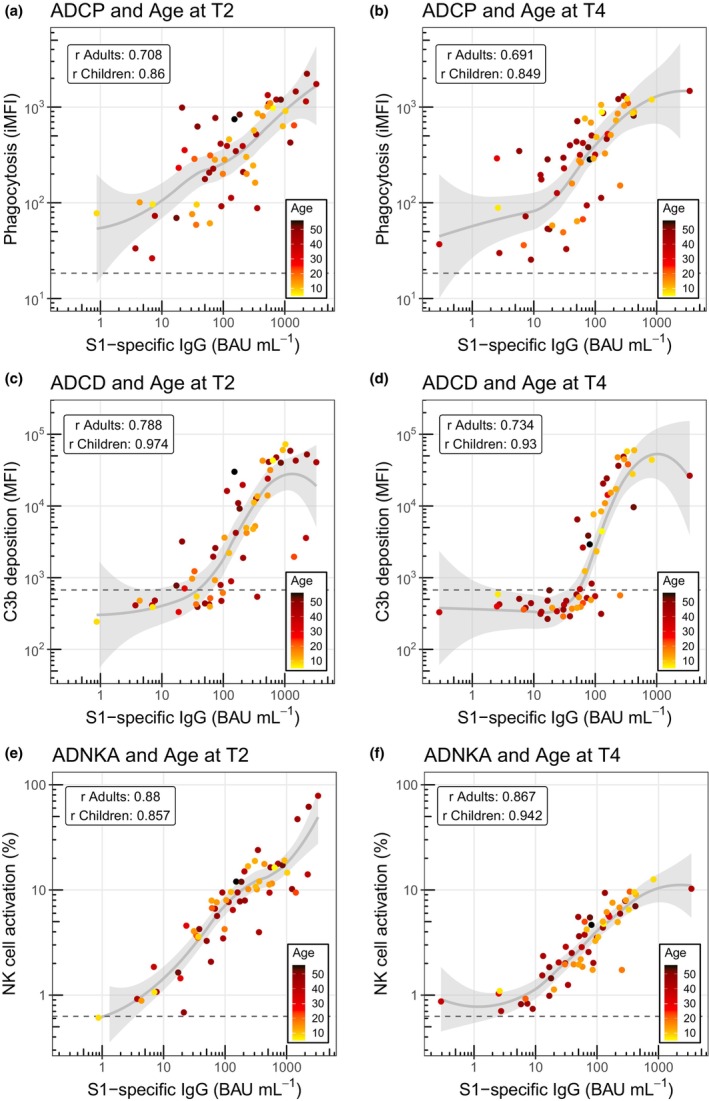
Correlation analysis of SARS‐CoV‐2 spike S1‐specific IgG binding concentration and Fc‐mediated effector functions separated by timepoints T2 and T4 in adults and children coloured by age. Correlations of SARS‐CoV‐2 spike S1‐specific serum IgG binding concentrations and ADCP (a, b), ADCD (c, d) and ADNKA (e, f) in adults (n = 37 or 38) and children (n = 21) at time points T2 and T4. Data points are coloured by linear age. Solid grey lines and shading represent smoothed conditional means and 95% confidence intervals. The horizontal grey dotted lines represent the negative PBS control. Correlations were assessed using the Spearman's rank‐order correlation test for adults and children separately and are indicated in each graph. ADCD, antibody‐dependent complement deposition; ADCP, antibody‐dependent cellular phagocytosis; ADNKA, antibody‐dependent NK cell activation; BAU, binding antibody units; iMFI, integrated median fluorescence intensity; NK, natural killer; r, Spearman's rank correlation coefficient.
Maturation of the antibody response over time, as illustrated for example by the observed increase in antibody avidity (Figure 2e), may lead to differences in the capacity of the antibodies to mediate Fc‐effector functions relative to antibody concentration. For this reason, we also compared the correlations between S1‐specific IgG binding concentrations and ADCP, ADCD or ADNKA (Figure 6a–c) at T2 and T4 for adults and children combined. For both ADCP and ADCD, S1‐specific antibodies exhibited equal or potentially enhanced relative functionality at T4 compared to T2. In contrast, the relative capacity to mediate ADNKA appears to decrease slightly over time, which is in line with the very clear decrease that was observed for absolute ADNKA capacity in both age groups (Figure 3f). Plotting the data of adults and children separately revealed similar patterns relating to timing of sampling (Supplementary figure 5).
Figure 6.
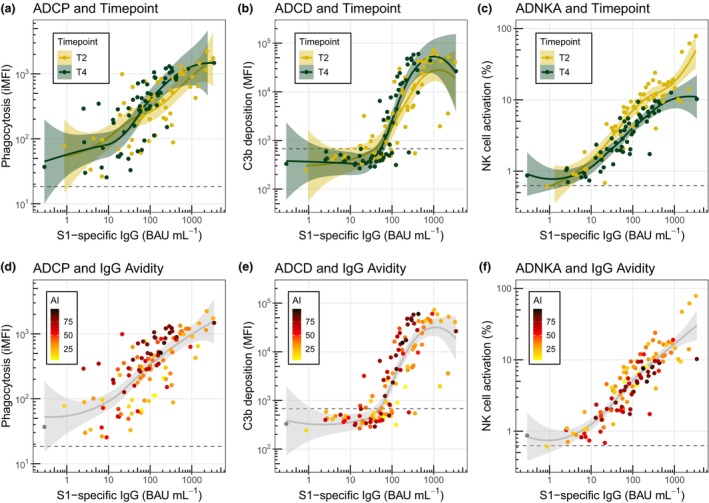
Correlation analysis of SARS‐CoV‐2 spike S1‐specific IgG binding concentration and Fc‐mediated effector functions coloured by time of sampling and avidity. Correlations of SARS‐CoV‐2 spike S1‐specific serum IgG binding concentrations and ADCP, ADCD and ADNKA in adults (n = 37 or 38) and children (n = 21) at timepoints T2 and T4. Data points are coloured by time of sampling (a–c) or avidity index (d–f). Solid lines and shading represent smoothed conditional means and 95% confidence intervals. The horizontal grey dotted lines represent the negative PBS control. ADCD, antibody‐dependent complement deposition; ADCP, antibody‐dependent cellular phagocytosis; ADNKA, antibody‐dependent NK cell activation; AI, avidity index; BAU, binding antibody units; iMFI, integrated median fluorescence intensity; NK, natural killer.
Finally, we assessed the influence of IgG avidity on the relative functionality of the serum antibodies in our assays. Higher avidity antibodies associated with enhanced ADCP and ADCD activity relative to antibody concentration (Figure 6d and e), whereas the opposite trend was observed for ADNKA (Figure 6f). We could not discern a clear pattern when looking at sex differences or disease severity in the correlation plots (Supplementary figures 3d–f and 6).
Discussion
With this study, we aimed to investigate whether differences exist between children and adults in the kinetics of Fc‐mediated effector functionality of virus‐specific antibodies upon primary SARS‐CoV‐2 infection. Overall, we found that both groups were quite similar with regard to the induction and heterogeneity of the assessed ADCP, ADCD and ADNKA responses. There was a tendency for increased durability of these responses in children compared to adults, possibly associated with a marginally enhanced affinity maturation and slightly reduced waning of IgG levels in children. However, this difference was only statistically significant for ADCD. Finally, adults showed a slightly weaker correlation between S1‐specific IgG binding concentrations and ADCP/ADCD activity than children, suggestive of more heterogeneity in qualitative antibody characteristics (including avidity) that influence these Fc‐mediated effector functions in adults compared to children.
Two limitations of our study warrant consideration. First, the children included in our study are not very young with an average age of 12 years and an age range of 5–16 years. Possibly, their immune systems have already substantially matured into an adult‐like composition, while younger children might show more pronounced differences when compared to adults. Supporting this premise, previous research has found that young children (<12 years) had higher levels of SARS‐CoV‐2‐specific IgG, neutralising and complement‐activating antibodies than older children. 32 Another study found higher FcγRIIa binding of spike S1‐specific antibodies in children than in older adults, 24 which might again be explained by the larger age difference. In contrast, Pierce et al. found higher levels of ADCP in adults than in children using the spike extracellular domain as antigen, but their study focussed specifically on hospitalised individuals, which might display altered functionality. 25 Second, the relatively small sample size, particularly regarding children (n = 21), may limit the detection of subtle differences. For example, Renk et al. showed that children (n = 548) had significantly higher levels of SARS‐CoV‐2‐specific antibodies than adults (n = 717) at 3–4 months after infection. 4 In agreement with our data, the latter finding supports an increased durability of antibody responses in children compared to adults.
For this study, we focussed on a single antigen (SARS‐CoV‐2 spike S1) because we were specifically interested in the antibody response to a novel antigen. Interestingly, however, it has previously been shown that both adults and children possess pre‐existing cross‐reactive spike S2‐ and N‐specific antibodies, likely because of previous exposure(s) to seasonal human coronaviruses. 24 , 29 It is conceivable that Fc‐mediated antibody responses towards these antigens display alternative functional profiles. Indeed, the work of Selva et al. shows elevated class‐switched antibodies in older adults, while children show enhanced Fc‐functionality. 24 It is furthermore possible that intrinsic antibody features, independent of previous exposure, affect the development and regulation of Fc‐mediated antibody effector functions. For example, it has been shown that the regulation of Fc‐mediated effector functions towards membrane‐bound and soluble antigens differs. 33 In addition, while several groups have previously shown robust ADNKA capacity of SARS‐CoV‐2 spike‐specific antibodies, it has been suggested that this functionality is even more pronounced with antibodies targeting SARS‐CoV‐2 ORF3A, membrane (M) and N proteins. 34 , 35 , 36 , 37 , 38 , 39 More research is needed to finely delineate the role of different antigen characteristics and previous exposures in the induction and regulation of Fc‐mediated effector functions.
In addition to comparing children and adults, our analysis adds to the current understanding of the kinetics of Fc‐mediated effector functions in general with four longitudinal sampling time points up to 10 months after infection. For example, compared to ADCD and ADNKA, we observed a limited decay of ADCP in adults over time, which is in line with previous reports. 35 , 40 , 41 Our results suggest that an increase in avidity counteracts the decrease in antibody binding concentrations, thereby supporting the durability of the ADCP response.
For ADNKA, we observed a strong absolute decrease in serum ADNKA capacity over time, which has previously been shown by others, as well as a decreasing trend in the relative ADNKA capacity of serum antibodies at later compared to earlier time points. 34 , 35 , 36 , 41 Unlike for ADCP, the relative ADNKA capacity did not appear to associate with IgG avidity, suggesting that other antibody characteristics are more important determinants of NK cell activity, at least in this experimental set‐up. A possible explanation for the relative decrease in ADNKA capacity over time is the likely waning of antibodies of the IgG3 subclass specifically, which show enhanced binding to the FcγRIIIa present on NK cells but have a shorter half‐life than IgG1. 26 Future research should aim at further elucidating the role and regulation of various structural antibody characteristics, for example subclass/isotype usage and glycosylation patterns, in the context of shaping the kinetics and heterogeneity of Fc‐mediated effector functions. 42 , 43 , 44
The exact role of Fc‐mediated effector functions in immunological protection remains to be fully elucidated. Whereas neutralising antibodies are probably most important in preventing the initial infection, protection from (severe) disease is likely a complex interplay between different immune components, including Fc‐mediated effector functions, T cells, B cells and innate immune cells. 45 The exact contribution of each of these factors may differ between individuals or with age and remains a topic of investigation. 46
In conclusion, our data provide novel insights into the development, heterogeneity and durability of antibody Fc‐mediated effector functionality in children compared to adults. As these antibody functions beyond neutralisation are increasingly recognised for their importance in immunological protection against disease, an enhanced understanding of their characteristics in specific populations is valuable for the future design of novel and improved vaccination strategies for respiratory viruses such as SARS‐CoV‐2.
Methods
Sample collection
Serum samples were collected from participants enrolled in a previously described prospective household cohort study that was initiated in March 2020 in the Netherlands. 31 In brief, the study consisted of 55 complete households including children who were enrolled following a positive SARS‐CoV‐2 RT‐PCR test of one adult member (i.e. the index case). The day of the positive test of the index case was defined as T0. At T1 (3–7 days after T0, with a mean of 4 days), all household members were swabbed to perform SARS‐CoV‐2 diagnostics, and blood was obtained for serum isolation by vena punction. Blood collection was repeated after 2–3 weeks (14–19 days, T2), 4–6 weeks (27–39 days, T3) and 9–10 months (266–309 days, T4). A questionnaire and symptoms diary were used to establish the day of symptom onset and the severity of symptoms, which was classified as asymptomatic, mild (any signs of respiratory infection except dyspnea), moderate (any signs of respiratory infection including dyspnea) or severe (any signs of respiratory infection including dyspnea and consultation of a healthcare professional). The current analysis includes a subset of participants that tested positive for SARS‐CoV‐2 by RT‐PCR on T0 and/or T1 and excludes individuals who were vaccinated for COVID‐19 or reinfected during the study, based on questionnaire data.
Ethics statement
The study was conducted in compliance with the European Statements for Good Clinical Practice and the Declaration of Helsinki of the World Medical Association. The protocol was approved by the Medical‐Ethical Review Committee (METC) of the University Medical Center Utrecht (METC number NL13529.041.06). Informed consent was obtained from all subjects and/or their legal guardian(s).
Cell culture conditions
THP‐1 cells (TIB‐202, RRID: CVCL_0006 American Type Culture Collection (ATCC) Manassas, VA, USA) were cultured in ATCC‐modified RPMI1640 medium (A1049101, ThermoFisher Scientific, Waltham, MA, USA) supplemented with 10% foetal bovine serum (FBS), 1× pen/strep and 0.05 mM 2‐mercaptoethanol. NK‐92‐CD16+ cells (ATCC, RRID: CVCL_V429) were cultured in MEM Eagle, Alpha modification medium (M0644, Sigma‐Aldrich, St. Louis, MO, United States) supplemented with 2.2 g L−1 sodium bicarbonate, 0.2 mM myo‐inositol (I5125, Sigma‐Aldrich), 10% FBS, 10% horse serum (16050122, ThermoFisher Scientific), 2.5 μM folic acid, 1× non‐essential amino acids (11140050, ThermoFisher Scientific), 1 mM sodium pyruvate (11360070, ThermoFisher Scientific), 1× pen/strep/glut (10378016, ThermoFisher Scientific), 200 IU mL−1 recombinant human IL‐2 (78220.1, STEMCELL Technologies, Vancouver, Canada) and 0.1 mM 2‐mercaptoethanol. Both cell lines were cultured in a standard 37°C, 5% CO2 incubator.
Determination of SARS‐CoV‐2 spike S1‐specific IgG, IgA and IgM concentrations
A previously validated bead‐based immunoassay was employed to quantify SARS‐CoV‐2 spike S1‐specific IgG, IgA and IgM in serum samples as previously described. 30 Briefly, microplex fluorescent beads were conjugated with recombinant HPLC‐purified SARS‐CoV‐2 monomeric spike S1 protein synthesised from the original Wuhan strain (40591‐V08H, Sino Biologicals, Beijing, China) and incubated with diluted serum samples. Following incubation and washing steps, captured antibodies were detected with a 1:400 dilution of phycoerythrin (PE)‐conjugated goat anti‐human IgG (Jackson ImmunoResearch Laboratories, West Grove, PA, USA), goat anti‐human IgA (SouthernBiotech, Birmingham, AL, USA) or goat anti‐human IgM (Jackson ImmunoResearch Laboratories) for 30 min, followed by additional washing. Samples were acquired on an FM3D instrument (Luminex, Austin, TX, USA). The median fluorescence intensity (MFI) values were converted into arbitrary units per mL (AU mL−1) by interpolation from a 5‐parameter logistic standard curve using Bioplex Manager 6.2 software (Bio‐Rad Laboratories, Hercules, CA, USA). For IgG, unitage values were standardised according to the logistic fit of the National Institute for Biological Standards and Control (NIBSC, South Mimms, UK) /WHO COVID‐19 reference serum 20/136, and expressed as international binding antibody units per mL (BAU mL−1). These data were then exported to Microsoft Excel for further analysis.
Assessment of SARS‐CoV‐2 spike S1‐specific IgG avidity
To determine the S1‐specific IgG AI, serum samples were diluted 400‐ and 4000‐fold and incubated for 45 min with S1‐conjugated beads and then washed. Subsequently, the samples were incubated for 10 min at RT with either 1.1 M NH4SCN (Sigma‐Aldrich) or phosphate‐buffered saline (PBS). This molarity was chosen to reach a similar range of avidity values as previously documented after primary SARS‐CoV infection. 47 Following washing steps and incubation with PE‐conjugated goat anti‐human IgG, the MFI values were acquired using an FM3D instrument. The AI (%) was calculated using the following formula:
To ensure accurate determination, the AI was calculated only when the MFIs of the PBS‐incubated samples fell within the limits of linearity (LOL) of the reference serum sample. A lower limit of 1000 MFI was applied to ensure accurate determination of low‐concentration samples. Samples outside these LOL were retested in a different dilution.
Antigen‐coating of microspheres for ADCP and ADCD assays
Sulfo‐NHS‐SS‐Biotin (EZ‐Link™ Micro Sulfo‐NHS‐SS‐Biotinylation Kit, 21 945, ThermoFisher Scientific) was added to recombinant SARS‐CoV‐2 monomeric spike S1 (40591‐V08H, Sino Biologicals) in a 50:1 molar ratio and incubated at RT for 60 min. Excess biotin was removed using a Zeba Spin Desalting Column (89889, ThermoFisher Scientific) according to the manufacturer's instructions and biotinylated protein was stored at −80°C until further use. Biotinylated spike S1 was added to either red or green fluorescent microbeads (Fluospheres NeutrAvidin‐Labeled Microspheres, F8775 or F8776, ThermoFisher Scientific) in a 1:1 (w/v) ratio and incubated o/n at 4°C. The beads were then washed with a 10× volume of PBS, centrifuged at 5000 g for 20 min and blocked in PBS with 2% bovine serum albumin (BSA) for at least 1 h. Beads were centrifuged again and stored in PBS/0.1%BSA at 4°C for a maximum of 1 week.
Bead‐based monocyte ADCP assay
Antigen‐coated green, fluorescent microbeads were diluted to 728× original bead volume in PBS/0.1%BSA and 20 μL (500 000 beads) was added per well in 96‐well V‐bottom plates. Heat‐inactivated (HI) serum (20 μL, 25× diluted in PBS) was added and incubated for 2 h at 37°C, after which the beads were washed twice with PBS/0.1%BSA. 25 000 THP‐1 cells in RPMI/10%FBS were added per well and incubated for 1 h at 37°C. Cells were washed with cold PBS and fixated in 100 μL 1% formaldehyde. Following centrifugation, cells were resuspended in PBS/0.5%BSA/2 mM EDTA, and data were acquired on a FACSCanto II (Becton, Dickinson and Company (BD), Franklin Lakes, NJ, USA). Data analysis was performed in FlowJo v10.8.1, and the integrated MFI (iMFI or phagocytic score) was determined by multiplying the percentage FITC‐positive cells with their MFI and dividing the result by 1000, which accounts for both the fraction of phagocytosing cells and the number of internalised beads per cell. The gating strategy is depicted in Supplementary figure 7a.
Bead‐based ADCD assay
Antigen‐coated red fluorescent microbeads were incubated with serum as described for ADCP. Low‐Tox® Guinea Pig Complement (CL4051, Cedarlane, Burlington, Canada) was reconstituted in 1 mL dH2O, diluted 25× in HBSS and 100 μL was added per well. Plates were incubated at 37°C for 15 min and washed twice with cold PBS/0.5%BSA/2 mM EDTA. Beads were stained with 100× diluted FITC‐conjugated goat IgG anti‐guinea pig complement C3 (11499934, MP Biomedicals, Irvine, CA, USA) and acquired on a BD FACSymphony. Analysis was performed in FlowJo. Single beads were selected based on FSC/SSC plots and PE signal. The FITC MFI of this population was determined as a measure of C3b deposition. The gating strategy is depicted in Supplementary figure 7b.
Plate‐based ADNKA assay
High‐binding 96‐well plates were coated with recombinant S1 protein at a concentration of 1 μg mL−1 by o/n incubation at 4°C. Plates were washed with PBS and blocked with PBS/2%BSA for 30 min. After removal of residual BSA, HI serum (50 μL, 50× diluted in PBS) was added and incubated for 2 h at 37°C. After washing, 25 000 NK‐92‐CD16+ cells in medium containing GolgiPlug (51‐2301KZ, BD) and anti‐CD107a‐PerCP‐Cy5.5 (328616, BioLegend, San Diego, CA, USA) were added per well. Following 4 h incubation, cells were stained with anti‐CD56‐PE (318306, BioLegend) and Fixable Viability dye eFluor™780 (65‐0865‐14, ThermoFisher Scientific) and fixated. Measurement was performed on a BD LSRFortessa and analysed in FlowJo. The gating strategy is depicted in Supplementary figure 7c.
Statistics and visualisation
Statistical analysis and graph design were performed using the R Statistical Software v4.3.0 and Rstudio v2023.03.1. The correlation matrix was generated based on Spearman's rank‐order correlation using the rcorr function in the Hmisc package v5.1–1 and visualised using the corrplot package v0.92. Principal component analysis was performed using the FactoMineR package v2.9 and visualised using the factoextra package v1.0.7. All values were log‐transformed, and samples with missing values for any of the variables were excluded listwise. The PCA correlation diagram was visualised using the corrplot package v0.92. All other graphs were generated using the ggplot2 package. Comparison between groups was performed using the nonparametric Kruskal–Wallis test from the R stats package with Dunn's multiple comparisons test from the DescTools package v0.99.50 and Holm's correction for multiple comparisons (T2 versus T4 for adults and children and adults versus children for T2 and T4). Additional R packages that were used for data analysis and visualisation are as follows: dplyr, tidyverse, scales, wesanderson, ggrepel, ggh4x, ggpubr and ggbeeswarm.
Author contributions
Anne T Gelderloos: Data curation; formal analysis; investigation; methodology; visualization; writing – review and editing. Anke J Lakerveld: Formal analysis; methodology; writing – review and editing. Rutger M Schepp: Formal analysis; investigation; methodology; writing – review and editing. Mioara Alina Nicolaie: Formal analysis; methodology; writing – review and editing. Josine van Beek: Conceptualization; project administration; supervision; writing – review and editing. Lisa Beckers: Data curation; investigation; writing – review and editing. Robert S van Binnendijk: Methodology; supervision; writing – review and editing. Nynke Y Rots: Conceptualization; project administration; supervision; writing – review and editing. Puck B van Kasteren: Conceptualization; formal analysis; methodology; project administration; supervision; visualization; writing – original draft; writing – review and editing.
Conflict of interest statement
The authors declare no conflict of interest.
Supporting information
Supplementary figure 1
Supplementary figure 2
Supplementary figure 3
Supplementary figure 4
Supplementary figure 5
Supplementary figure 6
Supplementary figure 7
Acknowledgments
We thank all participants for their willingness to contribute to this study and the study team and research nurses for organising the home visits and collecting the samples. We thank Alper Çevirgel, Anneke Westerhof, Elske Bijvank, Gabriel Goderski, Harry van Dijken, Helma Lith, Hinke ten Hulscher, Ilse Akkerman, Jeroen Hoeboer, Jolanda Kool, Joyce Greeber, Lidian Izeboud, Lisa Wijsman, Liza Tymchenko, Maarten Emmelot, Martijn Vos, Margriet Bisschoff, Marjan Bogaard, Marjan Kuijer, Martien Poelen, Nening Nanlohy, Olga de Bruin, Ronald Jacobi and Ruben Wiegmans for laboratory support during the early stages of this study. We thank Ryan Thwaites (Imperial College London) for generously sharing protocols and technical advice. This work was supported by the Dutch Ministry of Health, Welfare and Sport (VWS).
Data availability statement
The data that support the findings of this study are available from the corresponding author upon reasonable request.
References
- 1. Almendro‐Vázquez P, Laguna‐Goya R, Ruiz‐Ruigomez M et al. Longitudinal dynamics of SARS‐CoV‐2‐specific cellular and humoral immunity after natural infection or BNT162b2 vaccination. PLoS Pathog 2021; 1: e1010211. [DOI] [PMC free article] [PubMed] [Google Scholar]
- 2. Dehgani‐Mobaraki P, Zaidi AK, Yadav N, Floridi A, Floridi E. Longitudinal observation of antibody responses for 14 months after SARS‐CoV‐2 infection. Clin Immunol 2021; 230: 108814. [DOI] [PMC free article] [PubMed] [Google Scholar]
- 3. den Hartog G, Vos ERA, van den Hoogen LL et al. Persistence of antibodies to severe acute respiratory syndrome coronavirus 2 in relation to symptoms in a nationwide prospective study. Clin Infect Dis 2021; 73: 2155–2162. [DOI] [PMC free article] [PubMed] [Google Scholar]
- 4. Renk H, Dulovic A, Seidel A et al. Robust and durable serological response following pediatric SARS‐CoV‐2 infection. Nat Commun 2022; 13: 128. [DOI] [PMC free article] [PubMed] [Google Scholar]
- 5. Wright PF, Prevost‐Reilly AC, Natarajan H et al. Longitudinal systemic and mucosal immune responses to SARS‐CoV‐2 infection. J Infect Dis 2022; 226: 1204–1214. [DOI] [PMC free article] [PubMed] [Google Scholar]
- 6. Yang Y, Yang M, Peng Y et al. Longitudinal analysis of antibody dynamics in COVID‐19 convalescents reveals neutralizing responses up to 16 months after infection. Nat Microbiol 2022; 7: 423–433. [DOI] [PubMed] [Google Scholar]
- 7. Boudreau CM, Alter G. Extra‐neutralizing FcR‐mediated antibody functions for a universal influenza vaccine. Front Immunol 2019; 10: 440. [DOI] [PMC free article] [PubMed] [Google Scholar]
- 8. van Erp EA, Luytjes W, Ferwerda G, van Kasteren PB. Fc‐mediated antibody effector functions during respiratory syncytial virus infection and disease. Front Immunol 2019; 10: 548. [DOI] [PMC free article] [PubMed] [Google Scholar]
- 9. Zhang A, Stacey HD, D'Agostino MR, Tugg Y, Marzok A, Miller MS. Beyond neutralization: Fc‐dependent antibody effector functions in SARS‐CoV‐2 infection. Nat Rev Immunol 2023; 23: 381–396. [DOI] [PMC free article] [PubMed] [Google Scholar]
- 10. Atyeo C, Fischinger S, Zohar T et al. Distinct early serological signatures track with SARS‐CoV‐2 survival. Immunity 2020; 53: 524–532.e524. [DOI] [PMC free article] [PubMed] [Google Scholar]
- 11. Zohar T, Loos C, Fischinger S et al. Compromised humoral functional evolution tracks with SARS‐CoV‐2 mortality. Cell 2020; 183: 1508–1519.e1512. [DOI] [PMC free article] [PubMed] [Google Scholar]
- 12. Adeniji OS, Giron LB, Purwar M et al. Covid‐19 severity is associated with differential antibody fc‐mediated innate immune functions. mBio 2021; 12: e00281‐21. [DOI] [PMC free article] [PubMed] [Google Scholar]
- 13. Chakraborty S, Gonzalez J, Edwards K et al. Proinflammatory IgG fc structures in patients with severe COVID‐19. Nat Immunol 2021; 22: 67–73. [DOI] [PMC free article] [PubMed] [Google Scholar]
- 14. Gorman MJ, Patel N, Guebre‐Xabier M et al. Fab and fc contribute to maximal protection against SARS‐CoV‐2 following NVX‐CoV2373 subunit vaccine with matrix‐M vaccination. Cell Rep Med 2021; 2: 100405. [DOI] [PMC free article] [PubMed] [Google Scholar]
- 15. Ullah I, Prevost J, Ladinsky MS et al. Live imaging of SARS‐CoV‐2 infection in mice reveals that neutralizing antibodies require fc function for optimal efficacy. Immunity 2021; 54: 2143–2158.e2115. [DOI] [PMC free article] [PubMed] [Google Scholar]
- 16. Winkler ES, Gilchuk P, Yu J et al. Human neutralizing antibodies against SARS‐CoV‐2 require intact fc effector functions for optimal therapeutic protection. Cell 2021; 184: 1804–1820.e1816. [DOI] [PMC free article] [PubMed] [Google Scholar]
- 17. Yamin R, Jones AT, Hoffmann HH et al. Fc‐engineered antibody therapeutics with improved anti‐SARS‐CoV‐2 efficacy. Nature 2021; 599: 465–470. [DOI] [PMC free article] [PubMed] [Google Scholar]
- 18. Beaudoin‐Bussieres G, Chen Y, Ullah I et al. A Fc‐enhanced NTD‐binding non‐neutralizing antibody delays virus spread and synergizes with a nAb to protect mice from lethal SARS‐CoV‐2 infection. Cell Rep 2022; 38: 110368. [DOI] [PMC free article] [PubMed] [Google Scholar]
- 19. Junqueira C, Crespo A, Ranjbar S et al. FcγR‐mediated SARS‐CoV‐2 infection of monocytes activates inflammation. Nature 2022; 606: 576–584. [DOI] [PMC free article] [PubMed] [Google Scholar]
- 20. Sefik E, Qu R, Junqueira C et al. Inflammasome activation in infected macrophages drives COVID‐19 pathology. Nature 2022; 606: 585–593. [DOI] [PMC free article] [PubMed] [Google Scholar]
- 21. Vietzen H, Danklmaier V, Zoufaly A, Puchhammer‐Stöckl E. High‐affinity FcγRIIIa genetic variants and potent NK cell‐mediated antibody‐dependent cellular cytotoxicity (ADCC) responses contributing to severe COVID‐19. Genet Med 2022; 24: 1449–1458. [DOI] [PMC free article] [PubMed] [Google Scholar]
- 22. Kaplonek P, Cizmeci D, Kwatra G et al. ChAdOx1 nCoV‐19 (AZD1222) vaccine‐induced fc receptor binding tracks with differential susceptibility to COVID‐19. Nat Immunol 2023; 24: 1161–1172. [DOI] [PMC free article] [PubMed] [Google Scholar]
- 23. Ullah I, Beaudoin‐Bussieres G, Symmes K et al. The fc‐effector function of COVID‐19 convalescent plasma contributes to SARS‐CoV‐2 treatment efficacy in mice. Cell Rep Med 2023; 4: 100893. [DOI] [PMC free article] [PubMed] [Google Scholar]
- 24. Selva KJ, van de Sandt CE, Lemke MM et al. Systems serology detects functionally distinct coronavirus antibody features in children and elderly. Nat Commun 2021; 12: 2037. [DOI] [PMC free article] [PubMed] [Google Scholar]
- 25. Pierce CA, Preston‐Hurlburt P, Dai Y et al. Immune responses to SARS‐CoV‐2 infection in hospitalized pediatric and adult patients. Sci Transl Med 2020; 12: eabd5487. [DOI] [PMC free article] [PubMed] [Google Scholar]
- 26. Vidarsson G, Dekkers G, Rispens T. IgG subclasses and allotypes: From structure to effector functions. Front Immunol 2014; 5: 520. [DOI] [PMC free article] [PubMed] [Google Scholar]
- 27. Mazor Y, Yang C, Borrok MJ et al. Enhancement of immune effector functions by modulating IgG's intrinsic affinity for target antigen. PLoS One 2016; 11: e0157788. [DOI] [PMC free article] [PubMed] [Google Scholar]
- 28. Lakerveld AJ, Gelderloos AT, Schepp RM et al. Difference in respiratory syncytial virus‐specific Fc‐mediated antibody effector functions between children and adults. Clin Exp Immunol 2023; 214: 79–93. [DOI] [PMC free article] [PubMed] [Google Scholar]
- 29. Fraley E, LeMaster C, Banerjee D, Khanal S, Selvarangan R, Bradley T. Cross‐reactive antibody immunity against SARS‐CoV‐2 in children and adults. Cell Mol Immunol 2021; 18: 1826–1828. [DOI] [PMC free article] [PubMed] [Google Scholar]
- 30. den Hartog G, Schepp RM, Kuijer M et al. SARS‐CoV‐2‐specific antibody detection for seroepidemiology: A multiplex analysis approach accounting for accurate seroprevalence. J Infect Dis 2020; 222: 1452–1461. [DOI] [PMC free article] [PubMed] [Google Scholar]
- 31. Reukers DFM, van Boven M, Meijer A et al. High infection secondary attack rates of severe acute respiratory syndrome coronavirus 2 in Dutch households revealed by dense sampling. Clin Infect Dis 2022; 74: 52–58. [DOI] [PMC free article] [PubMed] [Google Scholar]
- 32. Tomasi L, Thiriard A, Heyndrickx L et al. Younger children develop higher effector antibody responses to SARS‐CoV‐2 infection. Open Forum Infect Dis 2022; 9: ofac554. [DOI] [PMC free article] [PubMed] [Google Scholar]
- 33. Larsen MD, de Graaf EL, Sonneveld ME et al. Afucosylated IgG characterizes enveloped viral responses and correlates with COVID‐19 severity. Science 2021; 371: eabc8378. [DOI] [PMC free article] [PubMed] [Google Scholar]
- 34. Anand SP, Prevost J, Nayrac M et al. Longitudinal analysis of humoral immunity against SARS‐CoV‐2 spike in convalescent individuals up to 8 months post‐symptom onset. Cell Rep Med 2021; 2: 100290. [DOI] [PMC free article] [PubMed] [Google Scholar]
- 35. Lee WS, Selva KJ, Davis SK et al. Decay of Fc‐dependent antibody functions after mild to moderate COVID‐19. Cell Rep Med 2021; 2: 100296. [DOI] [PMC free article] [PubMed] [Google Scholar]
- 36. Yu Y, Wang M, Zhang X et al. Antibody‐dependent cellular cytotoxicity response to SARS‐CoV‐2 in COVID‐19 patients. Signal Transduct Target Ther 2021; 6: 346. [DOI] [PMC free article] [PubMed] [Google Scholar]
- 37. Fuentes‐Villalobos F, Garrido JL, Medina MA et al. Sustained antibody‐dependent NK cell functions in mild COVID‐19 outpatients during convalescence. Front Immunol 2022; 13: 796481. [DOI] [PMC free article] [PubMed] [Google Scholar]
- 38. Hagemann K, Riecken K, Jung JM et al. Natural killer cell‐mediated ADCC in SARS‐CoV‐2‐infected individuals and vaccine recipients. Eur J Immunol 2022; 52: 1297–1307. [DOI] [PMC free article] [PubMed] [Google Scholar]
- 39. Fielding CA, Sabberwal P, Williamson JC et al. SARS‐CoV‐2 host‐shutoff impacts innate NK cell functions, but antibody‐dependent NK activity is strongly activated through non‐spike antibodies. elife 2022; 11: e74489. [DOI] [PMC free article] [PubMed] [Google Scholar]
- 40. Adhikari A, Abayasingam A, Rodrigo C et al. Longitudinal characterization of phagocytic and neutralization functions of anti‐spike antibodies in plasma of patients after severe acute respiratory syndrome coronavirus 2 infection. J Immunol 2022; 209: 1499–1512. [DOI] [PubMed] [Google Scholar]
- 41. Vangeti S, Periasamy S, Sun P et al. Serum fc‐mediated monocyte phagocytosis activity is stable for several months after SARS‐CoV‐2 asymptomatic and mildly symptomatic infection. Microbiol Spectr 2022; 10: e0183722. [DOI] [PMC free article] [PubMed] [Google Scholar]
- 42. Dekkers G, Treffers L, Plomp R et al. Decoding the human immunoglobulin G‐glycan repertoire reveals a Spectrum of fc‐receptor‐ and complement‐mediated‐effector activities. Front Immunol 2017; 8: 877. [DOI] [PMC free article] [PubMed] [Google Scholar]
- 43. Temming AR, de Taeye SW, de Graaf EL et al. Functional attributes of antibodies, effector cells, and target cells affecting NK cell‐mediated antibody‐dependent cellular cytotoxicity. J Immunol 2019; 203: 3126–3135. [DOI] [PubMed] [Google Scholar]
- 44. Jennewein MF, Alter G. The immunoregulatory roles of antibody glycosylation. Trends Immunol 2017; 38: 358–372. [DOI] [PubMed] [Google Scholar]
- 45. Goldblatt D, Alter G, Crotty S, Plotkin SA. Correlates of protection against SARS‐CoV‐2 infection and COVID‐19 disease. Immunol Rev 2022; 310: 6–26. [DOI] [PMC free article] [PubMed] [Google Scholar]
- 46. Neeland MR, Bannister S, Clifford V et al. Children and adults in a household cohort study have robust longitudinal immune responses following SARS‐CoV‐2 infection or exposure. Front Immunol 2021; 12: 741639. [DOI] [PMC free article] [PubMed] [Google Scholar]
- 47. Chan PK, Lim PL, Liu EY, Cheung JL, Leung DT, Sung JJ. Antibody avidity maturation during severe acute respiratory syndrome‐associated coronavirus infection. J Infect Dis 2005; 192: 166–169. [DOI] [PMC free article] [PubMed] [Google Scholar]
Associated Data
This section collects any data citations, data availability statements, or supplementary materials included in this article.
Supplementary Materials
Supplementary figure 1
Supplementary figure 2
Supplementary figure 3
Supplementary figure 4
Supplementary figure 5
Supplementary figure 6
Supplementary figure 7
Data Availability Statement
The data that support the findings of this study are available from the corresponding author upon reasonable request.