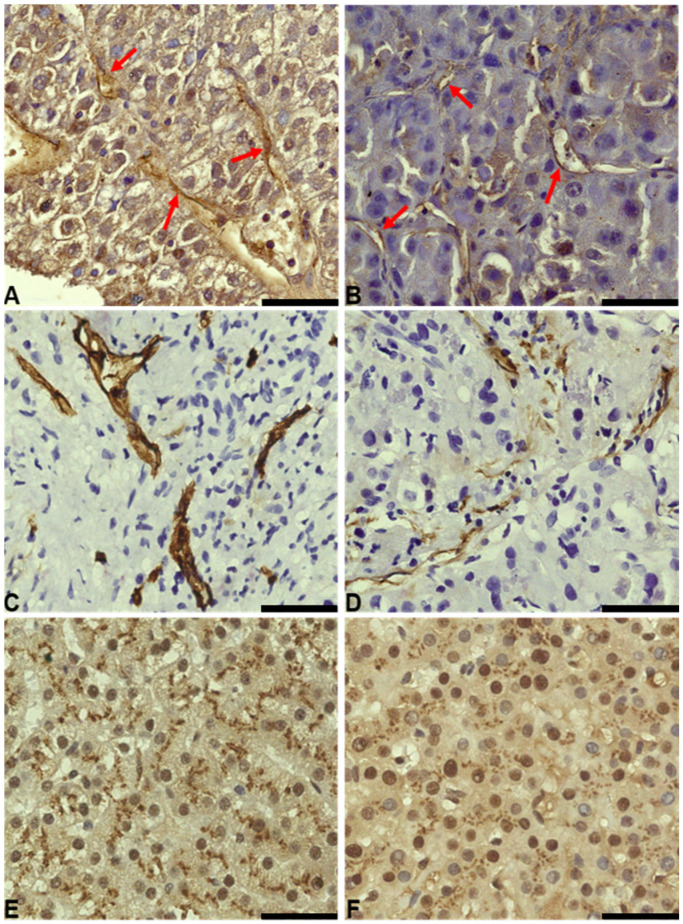
Figure 2.
Comparison of Ang2, podoplanin, and CLEC-2 staining in female and male patients treated with TKIs (50 µm scale bar). (A) 63× image of Ang2 staining in tumor and endothelial tissue (red arrows for endothelia) of a female patient. (B) 63× image of Ang2 staining in tumor and endothelial tissue (red arrows for endothelia) of a male patient. (C) 63× image of podoplanin staining at the level of the lymphatic endothelium in a female patient. (D) 63× image of podoplanin staining at the level of the lymphatic endothelium in a male patient. (E) 63× image of CLEC-2 staining at the level of tumor tissue in a female patient. (F) 63× image of CLEC-2 staining at the level of tumor tissue in a male patient.

