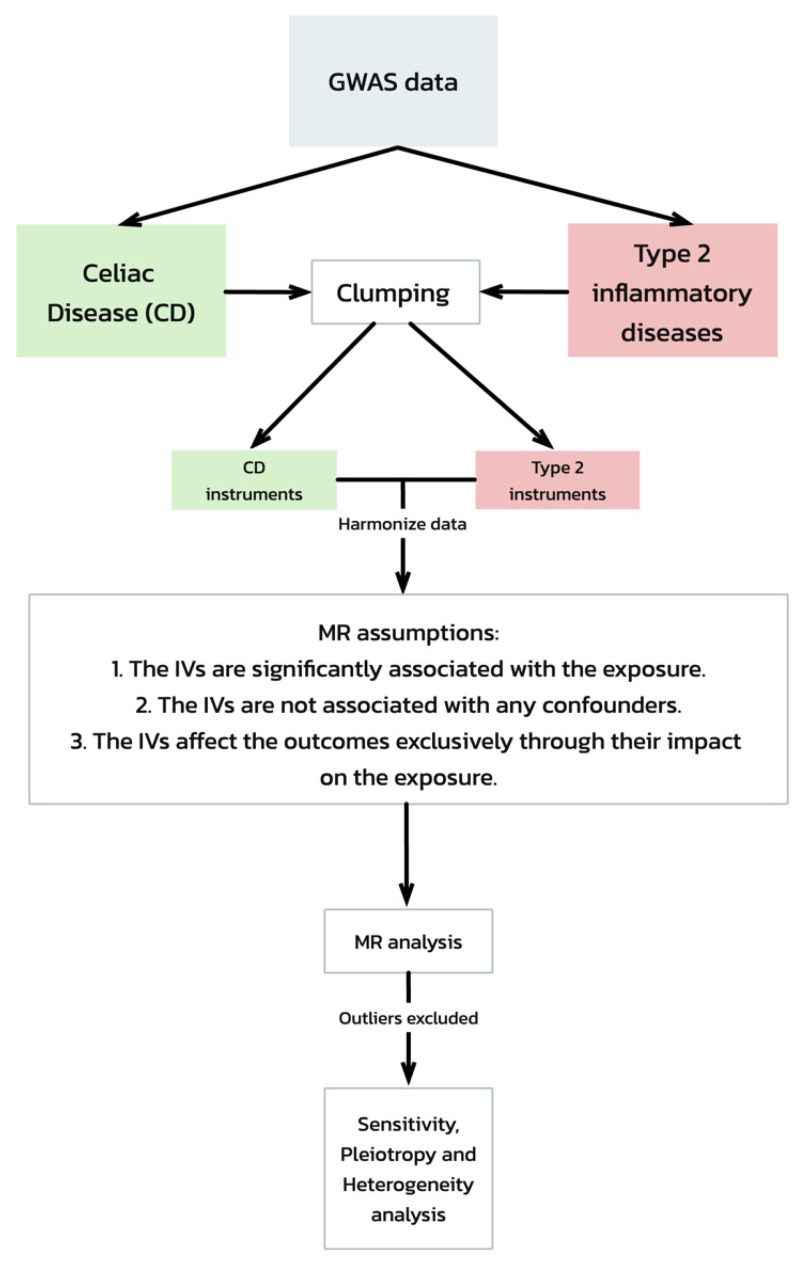
Figure 1.
Mendelian randomization (MR) analysis workflow and assumptions. This flowchart depicts the workflow of a Mendelian randomization (MR) analysis evaluating the genetic associations between celiac disease and type 2 inflammatory diseases, starting with GWAS data. It includes steps from data clumping and harmonization to MR analysis, emphasizing the key assumptions required for the validation of the causal inferences. The process concludes with sensitivity, pleiotropy, and heterogeneity tests to ensure the robustness of the results.

