

The need to express estimates of risk in an understandable manner is a challenge faced regularly by those who work with the results of epidemiological studies and try to convey their meaning to others. This is not an easy task, as is illustrated by the recent “pill scare” in the United Kingdom, in which there was much confusion over the clinical importance of the scientific information that was made public. Furthermore, practising clinicians also need a readily understandable tool for weighing the risks of various treatments. Ideally, this should be feasible without recourse to complicated statistical concepts. In this paper, we propose a simple and intuitively understandable method for expressing the results of case-control studies.
Summary points
Results of epidemiological studies need to be expressed in understandable terms if they are to be of practical use to clinicians and policy makers
Case-control studies are often used to study adverse effects of treatment; odds ratios from these are used to express the magnitude of adverse effects, but are not intuitively understandable estimates of risk
A more understandable and informative means of expressing the risk of adverse events in case-control studies is “the number of patients needed to be treated for one additional patient to be harmed”
This is calculated from the odds ratio and the unexposed event rate—that is, the rate of occurrence of the adverse event of interest in people not exposed to the treatment
Evidence from randomised controlled trials
Any intervention or exposure may have desirable and undesirable effects. Desirable effects are usually the intended effects of a treatment. These will often (at least for pharmacological interventions) have been established in randomised controlled trials before an agent is released onto the market and introduced into clinical practice.
In the context of randomised trials on the desirable effects of treatments, Sackett et al proposed a method for converting rate differences into a more intuitive quantity.1–4 This quantity was named the number needed to treat (NNT=1/absolute risk reduction). It is the number of people who must be treated in order that one adverse event is prevented by the treatment at issue. The number needed to harm is an analogous concept proposed by Sackett and colleagues to express the probability of additional adverse events occurring in randomised controlled trials because of treatment.4 In both cases, the concept of rate difference is converted into a number of individuals, a more intuitively understandable quantity.
However, undesirable effects are often apparent only after an intervention has become part of clinical practice. It may therefore no longer be possible to study them in a randomised controlled trial, making it necessary to resort to the less ideal case-control study.
Evidence from case-control studies
Case-control studies are more limited than randomised controlled trials with respect to the information they can yield because absolute estimates of risk for the exposure groups are not available from the study itself, unless the design is nested within a cohort or a primarily defined population. Consequently, estimates of risk are usually expressed in terms of the exposure odds ratio of cases compared with controls. Many doctors, however, are still unclear about the meaning of the odds ratio.
NNTH derived from case-control studies
Inspired by the number needed to treat and number needed to harm concepts for randomised controlled trials, we developed a similar concept for case-control studies. We focused on the adverse effects of treatments, a topic of importance to practising clinicians. In this context, the main problem is that estimates of rate differences are usually not available.
Consistent with a modified nomenclature for the number needed to harm proposed recently by Altman,5 we put forward the concept of the “number of patients needed to be treated for one additional patient to be harmed” (NNTH). The NNTH is the number of people exposed to a given treatment such that on average and over a given follow up period one additional person experiences the adverse effect of interest because of the treatment. It expresses the additional absolute risk of an adverse effect conferred by a treatment and is therefore a useful and intuitively understandable decision making tool for practising clinicians.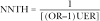
where OR is the odds ratio provided by the case-control study and UER is the unexposed event rate (see appendix on BMJ website for the derivation). The behaviour of the NNTH is illustrated in table 1 for various arbitrary values of the odds ratio and unexposed event rate.
Table 1.
Number needed to harm* for different arbitrary values of odds ratio and unexposed event rate
| Odds ratio | Unexposed event rate
|
|||||
|---|---|---|---|---|---|---|
| 1 in 10 | 1 in 100 | 1 in 1 000 | 1 in 10 000 | 1 in 100 000 | 1 in 1 000 000 | |
| 1.1 | 100 | 1 000 | 10 000 | 100 000 | 1 000 000 | 10 000 000 |
| 1.25 | 40 | 400 | 4 000 | 40 000 | 400 000 | 4 000 000 |
| 1.5 | 20 | 200 | 2 000 | 20 000 | 200 000 | 2 000 000 |
| 2 | 10 | 100 | 1 000 | 10 000 | 100 000 | 1 000 000 |
| 2.5 | 7 | 67 | 667 | 6 667 | 66 667 | 666 667 |
| 3 | 5 | 50 | 500 | 5 000 | 50 000 | 500 000 |
| 3.5 | 4 | 40 | 400 | 4 000 | 40 000 | 400 000 |
NNTH=1/((odds ratio-1)(unexposed event rate))
Practical application of the NNTH
The application of the NNTH to real life examples is illustrated in table 2.6–11 These examples were chosen because they cover a wide range of values for the odds ratio and the unexposed event rate. Obviously, the validity of the NNTH always depends on the odds ratio and unexposed event rate being unbiased estimators of their respective parameters.
Table 2.
Number needed to harm (NNTH): examples from medical literature
| Association of interest | Odds ratio
|
Unexposed event rate
|
NNTH | |||
|---|---|---|---|---|---|---|
| Value (95% CI) | Source | Value | Source | |||
| Third generation oral contraceptives and the risk of venous thromboembolism (unexposed subjects were users of second generation oral contraceptives) | 1.5 (1.1 to 2.1) | Spitzer et al6 | 16.1 per 100 000 women per year | Jick et al7 | 13 000 per year | |
| 2.2 (1.0 to 4.7) | Jick et al7 | Jick et al7 | 5 600 per year | |||
| 2.7 (1.6 to 4.6) | WHO8 | 10.3/100 000 women per year | WHO8 | 5 700 per year | ||
| Appetite suppressing drugs and the risk of primary pulmonary hypertension (unexposed subjects were non-users) | 23.1 (6.9 to 77.7) | Abenhaim et al9 | 1 case/2 000 000 people per year† | Abenhaim et al9 | 90 500* per year | |
| Use of non-steroidal anti-inflammatory drugs and risk of upper gastrointenstinal bleeding and perforation (unexposed were non-users) | 4.7 (3.8 to 5.7) | Rodriguez and Hick10 | 4.15 cases/10 000 people per 5 months | Carson et al11 | 650 per 5 months | |
Rounded to three significant digits; all other NNTHs are rounded to two significant digits, corresponding to the number of significant digits of their respective odds ratios.
Estimated by taking the number of cases that did not use appetite suppressing drugs over a two year period. We assumed that the estimated odds ratio applies to one year, although in the source article the odds ratio was computed for exposures of “three months or more” without taking the specific duration of exposure into account.
These examples illustrate how the NNTH, by taking the unexposed event rate into account, can lead to an assessment of risk importance which differs from the assessment that could be concluded from the odds ratio alone. For example, the NNTH gives the clinician a better understanding of the risks of thromboembolism associated with third generation oral contraceptives compared with second generation products. Furthermore, the different NNTH values obtained from the different studies used in this example illustrate how a measure of absolute risk (the NNTH) is more informative than a measure of relative risk (the odds ratio) because, unlike the odds ratio, it takes into account the “background” risk of the outcome occurring in unexposed people. The NNTH also illustrates better the range of risk estimates obtained from different studies.
In the case of appetite suppressing drugs, an odds ratio of 23.1 for pulmonary hypertension does not by itself provide a clinician with the necessary information to weigh properly the risks and benefits. However, the NNTH, which in this case is 90 500 for one year, is a better decision making tool since it takes into account the rate of events in the unexposed population (unexposed event rate), which is very low in this example. Likewise, in the case of non-steroidal anti-inflammatory drugs and gastrointestinal bleeding and perforation, a NNTH of 650 is more understandable and informative than an odds ratio of 4.7.
Advantages over the odds ratio
The NNTH is first and foremost a more intuitively understandable measure of risk than the odds ratio. In addition, it is a composite measure that takes into account not only the odds ratio but also the unexposed event rate. Consequently, it contains more information than the odds ratio alone and provides estimates of risk that better correspond with reality and with the intuitive assessment made by practising clinicians. For example, an odds ratio of 2 would weigh more heavily in the decision making process if it applied to an adverse event whose rate of occurrence in the unexposed population were 1 in 100 (NNTH=100) than if it were 1 in 100 000 (NNTH=100 000) (see table 1).
Limitations of the NNTH
Obtaining the unexposed event rate
Unless the case-control study providing the odds ratio is nested within a cohort or a primarily defined population, it is necessary to go to other sources to estimate the unexposed event rate. These sources can be either the controls in randomised controlled trials or the unexposed subjects in cohort studies. However, it is not always possible to find a study that provides an appropriate estimate of the unexposed event rate.
To estimate the unexposed event rate, we need a clear definition of the status of unexposed subjects in the case-control study from which the odds ratio comes. This is because calculating the NNTH logically requires congruence between the odds ratio and the unexposed event rate in terms of exposure status. For example, in the case of the risk of deep vein thrombosis conferred by using third generation oral contraceptives rather than second generation oral contraceptives (table 2), the appropriate unexposed event rate necessary to calculate the NNTH is the rate of deep vein thrombosis in women using second generation oral contraceptives (the “unexposed” group in the above comparison), and not the rate of deep vein thrombosis in women who do not use oral contraceptives.
Time dependency
In terms of duration of follow up for the occurrence of adverse events, the NNTH also calls for congruence between the studies from which the odds ratio and the unexposed event rate are derived. Thus, for the non-steroidal anti-inflammatory drugs example in table 2, the unexposed event rate, which is a monthly rate in the source article, had to be adjusted upward to fit with the five month follow up period for which the odds ratio was computed in the source case-control study. This extrapolation assumes that the rate of upper gastrointestinal bleeding is constant over time in unexposed people.
For most treatments that tend to be long term, such as oral contraceptives or non-steroidal anti-inflammatory drugs, the duration of follow up during which adverse events are documented is usually equal to or only slightly longer than the duration of exposure. For shorter treatments, such as some chemotherapy regimens for cancer or vaccination (an “instantaneous” exposure), the duration of follow up would be much longer than the duration of exposure (D G Altman, personal communication).
Confidence intervals
The confidence interval is nearly always provided for the odds ratio. Thus, it might be tempting to proceed simply by applying the NNTH formula to the upper and lower bounds of the confidence interval of the odds ratio. This does not, however, take into account the uncertainty surrounding the unexposed event rate, which is also an estimate. Even if a confidence interval were available for the unexposed event rate, the problem of calculating variances and covariances for these estimators would remain—a task complicated by the non-Gaussian distribution of the odds ratio.
An approximate confidence interval can be calculated for the NNTH by using the limits of the odds ratio's confidence interval (as described above) provided they are both greater than 1. If the lower limit of the confidence interval for the odds ratio is less than 1, then the NNTH formula used to calculate the upper limit of the approximate confidence interval for the NNTH becomes 1/(1-odds ratio)(unexplained event rate). If the lower limit of the confidence interval for the odds ratio is exactly 1, then the upper limit of the confidence interval for the NNTH is indeterminate.5 When interpreting approximate confidence intervals, bear in mind that the true confidence interval is inevitably larger than the one obtained by this method because of the additional uncertainty surrounding the unexposed event rate.
Which risk is expressed?
The NNTH is an estimator of risk that focuses only on the additional risk conferred by a treatment; it does not express the total risk attributable to the combination of the background risk and the risk due to exposure. This should be taken into consideration when using the NNTH as an adjunct to clinical decision making
Conclusion
In the context of case-control studies that focus on the adverse effects of treatments, we propose the NNTH as an aid to clinical decision making that is preferable to the odds ratio. As such, it is our hope that it may better convey the clinical importance of the results of epidemiological studies, thus helping to avoid future unnecessary confusion (and even panic) among clinicians, policy makers, and the public.
Supplementary Material
Acknowledgments
We thank Professor Doug Altman (reviewer) and Drs Lucie Blais, Henri McQuay, Olli Miettinen, Andrew Moore, David Sackett, Sami Suissa, and the other reviewers for helpful comments on the manuscript, and Mrs Anita Massicotte for clerical assistance.
Footnotes
Competing interests: None declared.
website extra: An appendix showing the derivation of the NNTH appears on the BMJ's website www.bmj.com
References
- 1.Laupacis A, Sackett DL, Roberts RS. An assessment of clinically useful measures of the consequences of treatment. N Engl J Med. 1998;318:1728–1733. doi: 10.1056/NEJM198806303182605. [DOI] [PubMed] [Google Scholar]
- 2.Sackett DL, Haynes RB, Guyatt GH, Tugwell P. Clinical epidemiology: a basic science for clinical medicine. 2nd ed. Toronto: Little, Brown; 1991. [Google Scholar]
- 3.Sackett DL, Deeks JJ, Altman DG. Down with odds ratios! Evidence-Based Med. 1996;1:164–166. [Google Scholar]
- 4.Sackett DL, Richardson WS, Rosenberg W, Haynes RB. Evidence based medicine. London: Churchill Livingstone; 1997. [Google Scholar]
- 5.Altman DG. Confidence intervals for the number needed to treat. BMJ. 1998;317:1309–1312. doi: 10.1136/bmj.317.7168.1309. [DOI] [PMC free article] [PubMed] [Google Scholar]
- 6.Spitzer WO, Lewis MA, Heinemann LAJ, Thorogood M, MacRae KD.for the Transnational Research Group on Oral Contraceptives and the Health of Young Women. Third generation oral contraceptives and risk of venous thromboembolic disorders: an international case-control study BMJ 199631283–88. [DOI] [PMC free article] [PubMed] [Google Scholar]
- 7.Jick H, Jick SS, Gurewich V, Myers MW, Vasilakis C. Risk of idiopathic cardiovascular death and non-fatal venous thromboembolism in women using oral contraceptives with differing progestagen components. Lancet. 1995;346:1589–1593. doi: 10.1016/s0140-6736(95)91928-7. [DOI] [PubMed] [Google Scholar]
- 8.WHO Collaborative Study of Cardiovascular Disease and Steroid Hormone Contraception. Effect of different progestagens in low oestrogen oral contraceptives on venous thromboembolic disease. Lancet. 1995;346:1582–1588. [PubMed] [Google Scholar]
- 9.Abenhaim L, Moride Y, Brenot F, Rich S, Benichou J, Kurz X, et al. Appetite-suppressant drugs and the risk of primary pulmonary hypertension. N Engl J Med. 1996;335:609–616. doi: 10.1056/NEJM199608293350901. [DOI] [PubMed] [Google Scholar]
- 10.Garcia Rodriguez LA, Jick H. Risk of upper gastrointestinal bleeding and perforation associated with individual non-steroidal anti-inflammatory drugs. Lancet. 1994;343:769–772. doi: 10.1016/s0140-6736(94)91843-0. [DOI] [PubMed] [Google Scholar]
- 11.Carson JL, Strom BL, Soper KA, West SL, Morse ML. The association of nonsteroidal anti-inflammatory drugs with upper gastrointestinal tract bleeding. Arch Intern Med. 1987;147:85–88. [PubMed] [Google Scholar]
Associated Data
This section collects any data citations, data availability statements, or supplementary materials included in this article.