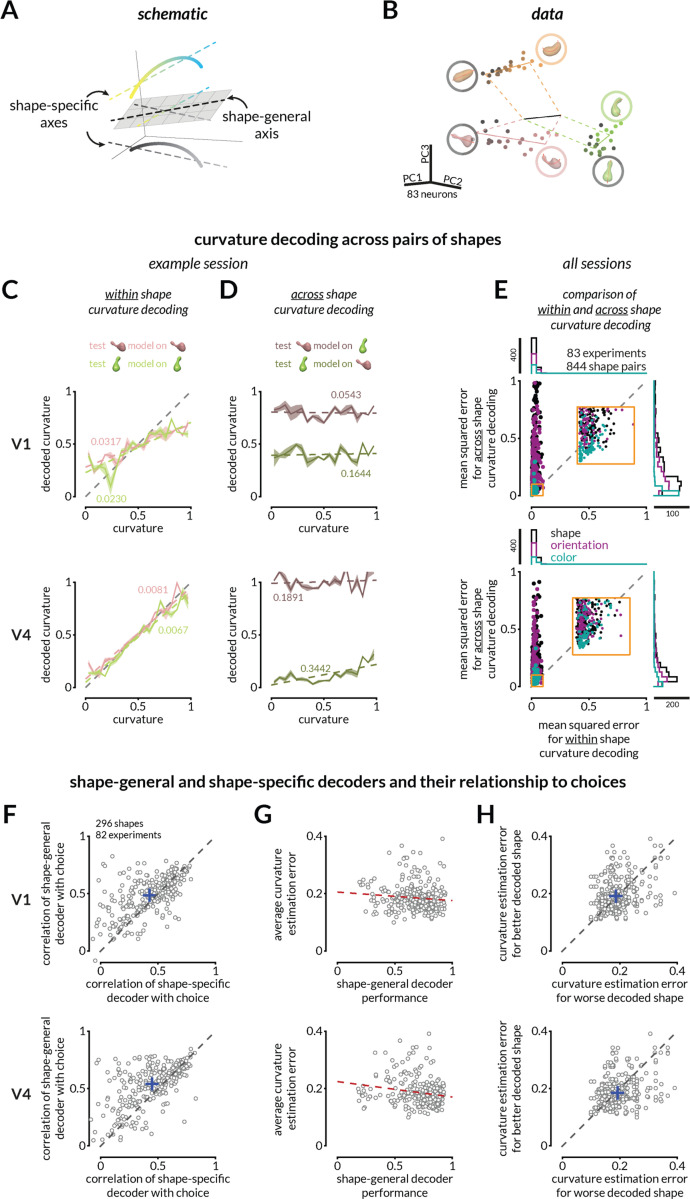
Figure 2: The monkeys’ behavior suggests that a fixed linear combination of neural responses explains curvature judgments across many irrelevant stimulus changes.
A. The representations of curvature for different shapes can be misaligned but a common shape-general axis can represent curvature.
B. For illustration purposes, V4 population responses to three shapes (varying in curvature) recorded on interleaved trials are projected into the first three principal components of the space in which the response of each simultaneously recorded neuron is one dimension. The points indicate the average population response to each unique stimulus at each curvature value. Luminance of the points (black to pink, green, or orange) represents increasing curvature. Solid colored lines represent best fit lines for each shape (shape-specific axis), and the black line represents the shape-general axis (see Figure S4 for other examples).
C. Curvature can be linearly decoded (cross-validated) from V1 (top) and V4 (bottom) responses for each shape independently for the example session in B. Colored labels indicate mean squared error (MSE) between the actual and predicted curvatures, and colored lines depict the linear fit relating predicted and actual curvatures. Shading indicates SEM across 100 folds of 50% trial splits (see Figure S4 for more example decoding analyses.)
D. The representations of curvature are not aligned across shapes. Same decoders as C, but the linear decoder is trained on responses to one shape and tested on responses to another in V1 (top) or V4 (bottom).
E. Curvature representations for different shapes are typically misaligned. Across shape pairs, our ability to decode curvature from V1 (top) and V4 (bottom) is better when the weights are based on responses to the same shape (x-axis) than when it is based on responses to the other shape in the pair (y-axis); MSE for same shape decoding from V1 responses (left) and V4 responses (right) is smaller than for across shapes (Wilcoxon rank sum test; p < 10−10). Each dot indicates a shape pair that is different in overall shape appearance (black), orientation only (purple), or color only (teal). The inset is a zoomed in view of the indicated area on the plot. The marginal distributions are shown on the top and right.
F. The monkeys’ choices are more strongly correlated with the prediction of a shape-general linear combination of neural responses (as in C) than a shape-specific strategy for V1 (top) and V4 (bottom) (Wilcoxon signed rank tests; p<10−8 V1; p<10−14 V4). Each point represents the correlation values (between the decoded curvature and the monkey’s choice) for one shape.
G. Behavioral choices are more accurate (lower average absolute error) for shapes whose representation is well-aligned with the shape-general curvature decoder of V4 (bottom) responses (correlation r= –0.17, vs constant model p=0.003), but not significantly for V1 (correlation r= –0.07, vs constant model p=0.261).
H. For pairs of shapes tested in the same session, average behavioral error was typically bigger for the worse decoded shape (using a shape-general decoder; x-axis) than the better decoded shape (y-axis) in V4 (Wilcoxon signed rank test; V4: p=0.004), but not significantly for V1 (p=0.19).

