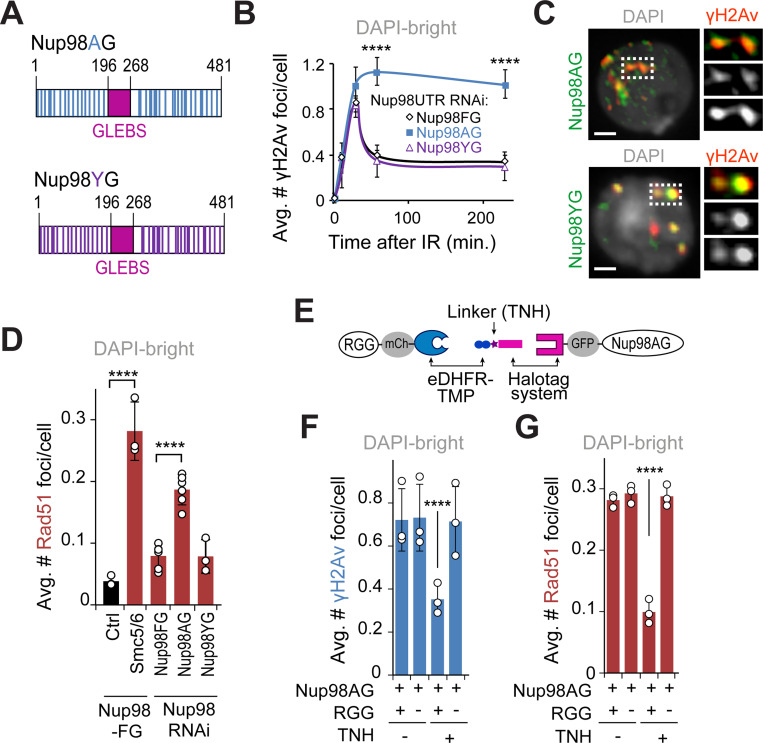
Figure 5. Nup98 mediates relocalization of heterochromatic DSBs via phase separation.
(A) Schematic representation of Nup98AG and YG mutations. Each Phenylalanine of the FG-domain of Nup98FG is substituted with Ala in Nup98AG or Tyr in Nup98YG. (B) Quantification of γH2Av foci in DAPI-bright at different time points after IR, in cells expressing FHA-Nup98-FG, -AG or -YG following RNAi depletion of endogenous of Nup98 (Nup98 UTR RNAi). ****P<0.0001 for Nup98AG relative to Nup98FG, n>50 cells for each time point. (C) IF shows Nup98AG and Nup98YG foci colocalizing with γH2Av foci. Dashed boxes and zoomed details highlight colocalizations. (D) Quantification of cells expressing FHA-Nup98-FG, -AG or -YG following depletion of endogenous Nup98, fixed 60 min after IR, shows the number of Rad51 foci in DAPI-bright. ****P<0.0001 for indicated comparisons. n>363 cells for each RNAi condition. Smc5/6 RNAi in cells expressing Nup98FG is shown as a positive control. (E) Schematic representation of the dimerizer system (adapted from58). The RGG domains are tagged with mCherry (mCh) and fused to eDHFR, whereas Nup98AG is tagged with GFP and fused to 3xHalo. The dimerizer is TNH. (F) Quantification of cells expressing (+) or non-expressing (−) RGG-mCherry-RGG-eDHFR, plus Halo-GFP-Nup98AG, treated for 120 min with (+) or without (−) TNH as indicated, and fixed 60 min after IR, shows the number of γH2Av foci in DAPI-bright. ****P<0.0001. n>346 cells for each condition. (G) As in F, except Rad51 foci were quantified. ****P<0.0001. n>342 cells for each condition. Error bars are SEM in B, and SD in D,F,G from three independent experiments. P values calculated with two-tailed Mann–Whitney test. Scale bars = 1 μm.

