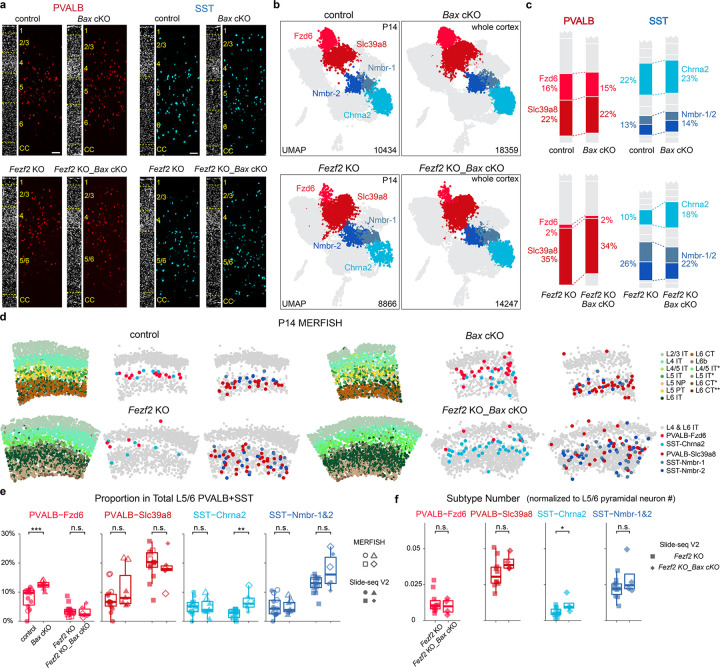
Figure 3. Preventing cell death rescues the loss of SST-Chrna2 but not PVALB-Fzd6 interneurons in Fezf2 mutants.
a, Representative RNAscope in situ hybridization images showing labeled Pvalb and Sst mRNA transcripts in the SSp region of P28–33 mice with four different genotypes. DAPI counterstaining is provided on the left of each image for laminar distribution reference. Scale bar: 100 μm. b, UMAP visualization of snRNA-seq of sorted interneurons from control (Nkx2.1-Cre;Baxfl/+;Rosa26LSL-h2b-GFP), Bax cKO (Nkx2.1-Cre;Baxfl/fl;Rosa26LSL-h2b-GFP), Fezf2 KO (Nkx2.1-Cre;Fezf2lacZ/lacZ;Rosa26LSL-h2b-GFP), and Fezf2 KO_Bax cKO (Nkx2.1-Cre;Fezf2lacZ/lacZ;Baxfl/fl;Rosa26LSL-h2b-GFP) mice at P14. control: n=1, Bax cKO: n=2, Fezf2 KO: n=1, Fezf2 KO_Bax cKO: n=4 mice. c, Proportion of deep-layer PVALB and SST interneuron subtypes in snRNA-seq dataset. d, MERFISH spatial map of coronal brain sections from SSp region of P14 mice of the four genotypes, showing PN and selected interneuron subtypes. e, Proportion of selected PVALB and SST interneuron subtypes within all PVALB+SST interneurons found in L5/6, based on spatial transcriptomic data in the SSp region. Control: n=14 ROIs (3 MERFISH), n=10 mice (WT: n=7, Bax cHET: n=1, Fezf2 HET_Bax cHET: n=2); Bax cKO: n=7 ROIs (2 MERIFSH), n=4 mice (all Fezf2 HET_Bax cKO); Fezf2 KO: n=13 ROIs (3 MERFISH), n=10 mice (Fezf2 KO: n=7, Fezf2 KO_Bax cHET: n=3); Fezf2 KO_Bax cKO: n=6 ROIs (2 MERFISH), n=4 mice. Age range: P14–37, with one Fezf2 KO mouse at 6-weeks old. f, Number of selected PVALB and SST subtypes normalized to the number of deep-layer PNs based on Slide-seq data. Fezf2 KO: n=10 ROIs, n=7 mice (Fezf2 KO: n=5, Fezf2 KO_Bax cHET: n=2); Fezf2 KO_Bax cKO: n=4 ROIs, n=3 mice. Wilcoxon rank-sum test, n.s. not significant, p≥0.05; *p<0.05; **p<0.01; ***p<0.001. Detailed p-values are provided in Supplementary Table 2.

