

Abstract
Availability of the essential amino acid methionine affects cellular metabolism and growth, and dietary methionine restriction has been implicated as a cancer therapeutic strategy. Nevertheless, how liver cancer cells respond to methionine deprivation and underlying mechanisms remain unclear. Here we find that human liver cancer cells undergo irreversible cell cycle arrest upon methionine deprivation in vitro. Blocking methionine adenosyl transferase 2A (MAT2A)-dependent methionine catabolism induces cell cycle arrest and DNA damage in liver cancer cells, resulting in cellular senescence. A pharmacological screen further identified GSK3 inhibitors as senolytics that selectively kill MAT2A-inhibited senescent liver cancer cells. Importantly, combined treatment with MAT2A and GSK3 inhibitors therapeutically blunts liver tumor growth in vitro and in vivo across multiple models. Together, methionine catabolism is essential for liver tumor growth, and its inhibition can be exploited as an improved pro-senescence strategy for combination with senolytic agents to treat liver cancer.
INTRODUCTION
Liver cancer remains a leading cause of global cancer-related death1. Most patients with hepatocellular carcinoma (HCC) are diagnosed at advanced stages due to a lack of widely implemented HCC surveillance. HCC are genetically very heterogeneous2, precluding the general use of targeted therapies for most patients. Current treatment options include transarterial chemoembolization (TACE) and multi-kinase inhibitors, which have very limited survival benefits. Recent clinical trials show that a small portion of HCC patients initially respond to combined anti-angiogenic therapy and immune checkpoint blockade, but eventually develop drug resistance3, 4. Therefore, there is an urgent need to develop improved strategies for liver cancer treatment.
Metabolic deregulation is a hallmark of cancer4. Cancer cells undergo dynamic metabolic remodeling to fulfill biosynthesis, survive harsh tumor microenvironments and escape immune surveillance and drug treatment5, 6. This metabolic remodeling is controlled by both cancer cell intrinsic mechanisms and metabolic interactions between cancer cells and tumor microenvironments7–9. Understanding how metabolic remodeling contributes to tumor growth may provide mechanistic insights into disease progression for heterogeneous malignancies such as HCC, and also identify actionable metabolic liabilities.
HCC develops from transformed hepatocytes with features of metabolic remodeling10. For example, HCC repress urea cycle gene expression and become auxotrophic for exogenous arginine11, and gluconeogenic genes like Fructose-1,6-Bisphosphatase (FBP1) are also universally silenced12. Notably, hepatic FBP1 loss in mice disrupts liver metabolism and promotes tumorigenesis through a hepatic stellate cell (HSC) senescence secretome; eliminating senescent HSCs effectively prevents tumor progression 12. Recently, CDC7 inhibitors induced senescence in p53-mutant liver cancer cells that can then be eliminated by mTOR inhibitors as “senolytics” 13. These findings raise the possibility of targeting senescent HSCs or liver cancer cells for treatment, which led us to explore metabolic targets for therapy-induced senescence (TIS). Methionine is an essential proteinogenic amino acid, whose catabolism produces S-adenosylmethionine (SAM), a universal donor for all methylation reactions14. Methionine can be regenerated from its catabolic product homocysteine in the presence of methyl tetrahydrofolate (meTHF) and vitamin B12. This “methionine cycle” couples methionine metabolism with one-carbon metabolism and transsulfuration pathways to regulate lipid and redox homeostasis15. By virtue of these essential roles, methionine deprivation or blocking methionine catabolism depletes tumor propagating capacity in human lung cancer16. Moreover, dietary methionine restriction increases the preclinical therapeutic efficacy of chemotherapy and immunotherapy in colorectal cancer, and radiotherapy in soft tissue sarcoma17,18. However, mice fed with a hepatocarcinogenic methionine and choline deficient (MCD) diet develop significant liver fibrosis, due to HSC activation and collagen deposition19, 20. Meanwhile, progression of liver tumors driven by transgenic MYC or carcinogenic diethylnitrosamine (DEN) treatment is also accelerated in mice administered MCD or choline deficient amino acid defined diets that contain much less methionine21. These observations suggest that dietary methionine restriction doesn’t effectively limit liver tumor growth. How liver cancer cells respond to exogenous methionine restriction, and the underlying metabolic adaptations remain unclear.
Here we find that most liver cancer cells undergo cell cycle arrest with profound DNA damage upon acute methionine deprivation. Blocking MAT2A-mediated methionine catabolism results in senescence of liver cancer cells, which can be eliminated by GSK3 inhibitors that act as specific senolytics. More importantly, combined treatment with MAT2A and GSK3 inhibitors therapeutically blunts liver cancer cell growth in vitro and in vivo. Our findings identify MAT2A as a pro-senescence metabolic target and GSK3 inhibitors as selective senolytics for treatment-induced senescence, which collectively provide an innovative strategy to limit liver tumor growth.
RESULTS
Liver cancer cells undergo senescence upon methionine deprivation.
We initially tested the direct effects of methionine restriction on human liver cancer cells by removing methionine from culture media. A panel of liver cancer cell lines, including Huh7, Hep3B, and PLC/PRF5 cells showed markedly decreased cell numbers after 72-hour methionine deprivation (Fig. 1a and Extended Data Fig. 1a). Significantly reduced DNA synthesis indicated by EdU incorporation was apparent (Fig. 1b), while apoptosis was not dramatically changed in most methionine-deprived cancer cells (Extended Data Fig.1b), indicating that decreased cell numbers mainly result from blunted cell proliferation. By titrating the concentrations of methionine in culture medium with dialyzed serum, we found that Huh7 and Hep3B cell proliferation was blocked when methionine concentrations were decreased to below 5 μM (Fig. 1c). Consistently, methionine deprivation upregulated protein levels of p16 and p21, two cell cyclin-dependent kinase inhibitors (Extended Data Fig. 1c). Moreover, in both cell growth, 12-day and 3-week clonogenicity assays, transiently methionine-deprived liver cancer cells failed to proliferate in methionine-restored medium (Fig. 1d, e and Extended Data Fig. 1d). These results suggest that even short-term methionine deprivation results in irreversible cell cycle arrest in most liver cancer cells.
Fig. 1. Liver cancer cells undergo cell cycle arrest with DNA damage upon methionine deprivation.

a, Huh7 and Hep3B cell numbers with or without 72-hour methionine (Met) deprivation. b, Quantification of EdU incorporation rates (%) in Huh7 and Hep3B lines with or without 72-hour methionine deprivation (n=3 independent experiments). c, Huh7 and Hep3B cell numbers cultured in medium with indicated concentrations of methionine for 72 hours. d, e, Representative crystal violet staining of control and methionine-deprived Huh7 and Hep3B cells replated in methionine-containing medium for cell growth (d) and clonogenicity (e) assays. f, Time course western blot analysis of γH2AX and GAPDH in Huh7 and Hep3B cells cultured in control and methionine deprived medium. g, Representative immunofluorescence images of control (Met+) and methionine-deprived (Met-) Huh7 and Hep3B cells stained with 53BP1 (red) and DAPI (blue). Scale bar: 50 μm. h, Scheme of methionine cycle that couples methionine catabolism with folate metabolism and transsulfuration pathways. i, Huh7 and Hep3B cell numbers cultured in medium with or without homocysteine (Hcy, 100 μM). j, Huh7 and Hep3B cell numbers cultured in medium with indicated supplements. Hcy, homocysteine (Hcy, 100 μM), B12, vitamin B12 (100 nM), 5-meTHF, 5-methyl-tetrahydrofolate (10 μM). n=4 for each group. Methionine deprived culture media includes dialyzed FBS throughout these studies. Data presented as mean ± s.e.m. of three independent experiments; statistical significance was determined by a two-tailed Student’s t-test (a-c, i, j). Experiments were repeated three times independently, with similar results (d, e).
In addition to stable cell cycle arrest upon methionine deprivation, we next evaluated DNA damage, an established feature of cellular senescence22–24. Both Huh7 and Hep3B cells exhibited basal levels of γH2AX under normal culture conditions, and γH2AX levels progressively increased in these cells after methionine deprivation (Fig. 1f). Moreover, accumulation of multiple 53BP1 foci, another late DNA damage response marker, was observed in methionine-deprived cancer cells (Fig. 1g and Extended Data Fig. 1e). Therefore, cell cycle arrest and increased DNA damage in liver cancer cells likely explain their responses to methionine deprivation.
We then studied whether liver cancer cells can regenerate methionine from exogenous substrates. Because methionine regeneration requires homocysteine as substrate, and meTHF and vitamin B12 as cofactors (Fig. 1h), adding exogenous homocysteine alone to methionine-deprived medium was unable to rescue cell growth defects in liver cancer cells (Fig. 1i and Extended Data Fig. 1f). When supraphysiological levels of vitamin B12 were supplied with homocysteine, however, liver cancer cells proliferated in the absence of exogenous methionine (Fig. 1j). It should be noted that some serum derived vitamin B12 and folic acid are present in the medium, explaining why some growth was observed upon supplementation with just homocysteine and meTHF. Notably, regardless of exogenous or endogenous sources, methionine must be catabolized to support cell metabolism and proliferation. We therefore focused on whether targeting methionine catabolism would limit liver cancer cell growth.
MAT2A inhibition induces senescence in liver cancer cells.
As a rate-limiting enzyme of methionine catabolism, the MAT family member MAT1A is specifically expressed in adult differentiated hepatocytes and silenced in proliferating hepatocytes, while MAT2A is expressed by proliferating hepatocytes, other extrahepatic cells, and certain cancer cells such as lung adenocarcinoma16, 25–27. Interestingly, methionine availability regulates MAT2A expression, and MAT2A is required for liver cancer cell proliferation28. Indeed, IHC staining of human liver cancer tissue arrays revealed that MAT2A is highly expressed in HCC samples compared to normal and adjacent liver tissues (Fig. 2a). Higher MAT2A levels were also detected in murine HCC from MYCOE; Trp53ko and DEN models (Fig. 2b and Extended Data Fig. 2a). Analysis of TCGA datasets demonstrated that elevated MAT2A mRNA levels are negatively correlated with patient survival (Fig. 2c). Furthermore, analysis of human liver cancer single cell RNA sequencing data revealed that the frequency of MAT2A expression was significantly greater in pro-tumorigenic hepatocytes (42%, 3061/7285) when compared with either non-malignant hepatocytes (26%, 385/1497) from HCC patients or uninjured hepatocytes from healthy livers (23%,1115/4800) (Extended Data Fig. 2b). We further performed GSEA to compare MAT2A-high with MAT2A-low HCC datasets, and found that gene sets of pyrimidine metabolism, nucleotide excision repair, mismatch repair and cell cycle progression were significantly enriched in the MAT2A-high samples, while gene sets of fatty acid metabolism and citrate TCA cycle were significantly enriched in the MAT2A-low samples (Extended Data Fig. 2c). These results indicate that MAT2A transcript levels may stratify human liver cancer samples with potentially distinct DNA repair and nucleotide metabolism involved in genome stability maintenance29.
Fig. 2. Blocking MAT2A induces senescence in liver cancer cells.
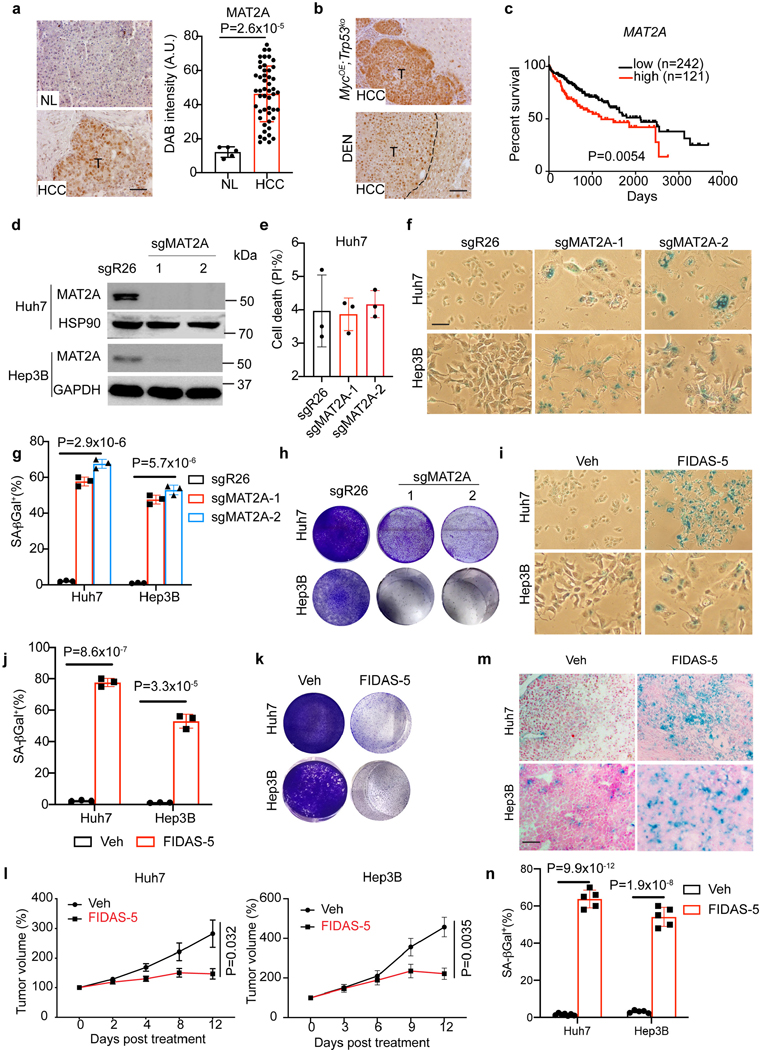
a, Left: representative IHC images of MAT2A staining in a human tissue array containing normal liver (NL) and HCC tissue sections. Scale bar: 100 μm. Right: quantification of DAB intensity of MAT2A IHC staining from normal liver (n=10) and HCC (n=49) sections. b, Representative IHC images of MAT2A staining of MYCOE;Trp53KO cell-derived orthotopic HCC tissue sections and DEN-treated mouse livers. T, tumor. Scale bar: 100 μm. c, Kaplan–Meier overall survival plots stratified by MAT2A high (red, n=121) or low (black, n=242) mRNA levels from TCGA HCC database. A log-rank Mantel–Cox test was performed between the groups. d, Western blot analysis of MAT2A and GAPDH isolated from Huh7-sgR26, Huh7-sgMAT2A-1, Huh7-sgMAT2A-2, Hep3B-sgR26, Hep3B-sgMAT2A-1, and Hep3B-sgMAT2A-2 cell lines (n=3 independent experiments). e, Quantification of cell death (% PI+) of Huh7-sgR26, Huh7-sgMAT2A-1 and Huh7-sgMAT2A-2 cell lines. f, g, Representative SA-β-gal staining (f) and quantification (g) of Huh7-sgR26, Huh7-sgMAT2A-1, Huh7-sgMAT2A-2, Hep3B-sgR26, Hep3B-sgMAT2A-1, and Hep3B-sgMAT2A-2 cell lines. Scale bar: 100 μm. h, Representative crystal violet staining of Huh7-sgR26, Huh7-sgMAT2A-1, Huh7-sgMAT2A-2, Hep3B-sgR26, Hep3B-sgMAT2A-1, and Hep3B-sgMAT2A-2 cell lines in cell growth assays. i, j, Representative SA-β-gal staining (i) and quantification (j) of vehicle control (Veh) and FIDAS-5 treated Huh7 and Hep3B cell lines. Scale bar: 100 μm. k, Representative crystal violet staining of vehicle control and FIDAS-5 treated Huh7 and Hep3B cell lines in long-term growth assays. l, Quantification of Huh7 and Hep3B xenograft tumor volume changes over time from vehicle control (Veh) (Huh7: n=7 female mice, Hep3B: n=4 female mice) and FIDAS-5 (Huh7: n=5 female mice, Hep3B: n=5 female mice) treatment groups. m, n, Representative SA-β-gal staining (m) and quantification (n) of Huh7 and Hep3B xenograft tumor cryosections. Control: n=7 female BAB/c mice for Huh7, n=4 female NSG mice for Hep3B. FIDAS-5: n=5 female BAB/c mice for Huh7, n=5 female NSG mice for Hep3B. Scale bar: 100 μm. Data presented as mean ± s.e.m. of three independent experiments (e,g,j,n) or mean ± s.e.m (a,l); statistical significance was determined by a two-tailed Student’s t-test (a,e,g,j,l,n) or log-rank Mantel–Cox test (c). Experiments were repeated three times independently, with similar results (d,h,k).
To target methionine catabolism and test effects on senescence induction, we employed CRISPR approaches to deplete MAT2A expression in Huh7 and Hep3B cells (Fig. 2d). Whereas cell death was not dramatic in pooled MAT2A-depleted cancer cells (Fig. 2e), they became senescent as evidenced by senescence-associated-β-galactosidase (SA-β-gal) staining (Fig. 2f and g). Accordingly, MAT2A-depleted Huh7 and Hep3B cells failed to proliferate (Fig. 2h), exhibited dramatic DNA damage and cytoplasmic DNA accumulation (Extended Data Fig. 3a, b), and expressed multiple genes encoding senescence-associated secretory phenotype (SASP) components (Extended Data Fig. 3c), all of which are typical senescence characteristics22, 24, 30. In accordance with this, FIDAS-5, a MAT2A inhibitor used in recent studies16, 31, 32, also dose-dependently dampened Huh7 and Hep3B cell growth and eventually resulted in senescence after 7-day treatment (Fig. 2i, j and Extended Data Fig. 4a, b). Indeed, abundance of methionine catabolic products including SAM and S-Adenosyl-L-homocysteine (SAH) was also reduced by FIDAS-5 exposure (Extended Data Fig. 4c). Like MAT2A depletion, FIDAS-5 treatment didn’t induce apoptosis but instead promoted DNA damage and cytoplasmic DNA accumulation in Huh7 and Hep3B cells (Extended Data Fig. 4 d-f). Consistent with the senescent phenotypes, FIDAS-5 treated cells failed to proliferate in cell growth and clonogenicity assays for three weeks (Fig. 2k and Extended Data Fig. 4g), and also expressed multiple SASP genes (Extended Data Fig. 4h). We then treated an ovarian cancer cell line TOV21G, and found that FIDAS-5 similarly induced robust senescence in TOV21G cells (Extended Data Fig. 4i and j), which implies that FIDAS-5’s senescence-inducing effect is not exclusive to liver cancer cells. Importantly, FIDAS-5 treatment of nude mice effectively blunted Huh7 and Hep3B xenograft tumor growth (Fig. 2l), and pathological examination revealed strong SA-β-gal staining of FIADS-5-treated tumor sections (Fig. 2m, n), indicating that MAT2A inhibition induces senescence in vivo. FIDAS-5 appears to be well-tolerated in this treatment regimen, based on comparable body weight changes in both groups of animals (Extended Data Fig. 4k). These in vitro and in vivo results support the notion that blocking MAT2A-mediated methionine catabolism induces senescence in liver cancer cells.
MAT2A inhibition elicits cell cycle arrest and DNA damage.
Previous studies reveal that oxidative stress promotes DNA damage and cellular senescence33. To test whether reactive oxygen species (ROS) accumulation is involved in senescence induction underlying MAT2A inhibition, we treated Huh7 cells with FIDAS-5 and ROS scavengers including N-acetylcysteine (NAC) and reduced glutathione (GSH). While FIDAS-5 blunted Huh7 cell growth, neither NAC nor GSH reversed FIDAS-5’s effects (Extended Data Fig. 5a), excluding ROS accumulation as senescence trigger. One outcome of blocking methionine catabolism is to deplete SAM pools and change SAM/SAH ratios, affecting histone and/or DNA methylation that in turn impacts gene transcription16. While global histone methylation marks (H3K4Me3, H3K9Me3, H3K27me3 and H3K36me3) were decreased by elevated doses of FIDAS-5 treatment for 7 days, short-term (48 hour) treatment didn’t dramatically reduce these modifications (Extended Data Fig. 5b). Notably, H3K9me3 puncta, a general feature of senescence-associated heterochromatin foci (SAHF) that contribute to proliferation-relevant gene silencing in senescent cells22, 34, was only observed in less than 30% of FIDAS-5-induced senescent (FIS) Huh7 cells. As a comparison, more than 80% of CDC7 inhibitor XL413-induced senescent Huh7 cells exhibited H3K9me3 foci (Extended Data Fig. 5c, d), suggesting that senescence induced by MAT2A inhibition is less associated with SAHF accumulation, and alternative mechanisms may contribute to cell cycle arrest in this context.
To identify early gene expression changes in response to MAT2A inhibition, we then performed RNA-seq on short-term (48 hour) FIDAS-5 treated Huh7 cells compared to controls. This profiling uncovered 4346 significantly changed mRNAs (adjusted p < 0.05), including 2504 upregulated and 1842 downregulated loci (Fig. 3a). In particular, cyclin-dependent kinase inhibitor (CDKN)-encoding genes such as CDKN1A (p21) and CDKN2B (p15) were upregulated, while DNA damage response and repair-associated gene (BRCA1, BRCA2, CHEK1, CHEK2) expression were decreased, which were further confirmed by qRT-PCR analysis (Extended Data Fig. 5e). Accordingly, gene set enrichment analysis (GSEA) further uncovered top-ranked gene sets of cell cycle and DNA repair pathways altered by FIDAS-5 exposure (Fig. 3b). DNA methylation supports genomic stability by promoting DNA condensation and transcriptional repression of heterochromatic genomic elements including centromeric, pericentric, and retrotransposable elements. Therefore, it has been reported that genetically or chemically induced DNA hypomethylation can lead to chromosomal or genomic instability through increased frequency of mutations, deletions, amplifications, inversions, and translocations35, 36. Since CDKNs promote cell cycle arrest, and MAT2A inhibition reduced levels of SAM required for DNA methylation (Extended Data Fig. 3c), we asked whether DNA hypomethylation contributes to CDKN gene activation. Methylated DNA immunoprecipitation (MeDIP) with an antibody against 5-methylcytosine was performed to compare relative methylation levels of CpG islands in CDKN gene promoters via quantitative PCR. FIDAS-5 treatment dramatically reduced CpG island methylation (Fig. 3c), suggesting that local DNA hypomethylation at least partly facilitates their transcriptional activation. Consistently, FIDAS-5 increased overall CDKN and γH2AX protein levels in Huh7 and Hep3B cells at 48 hours post treatment (Fig. 3d), an early time point before overt senescent characteristics. Indeed, 53BP1 foci were already evident in early FIDAS-5-treated cells (Fig. 3e and Extended Data Fig. 5f). Because persistent DNA damage is a trigger of cellular senescence and SASP gene expression23, this profiling provides substantial evidence of cell cycle arrest and DNA damage accumulation at early stages of MAT2A inhibition. Interestingly, although p21 is an early effector of cell cycle arrest during senescence22, 24, CRISPR-mediated p21 depletion didn’t prevent FIDAS-5-mediated senescence but decreased the viability of senescent cells instead (Extended Data Fig. 5g-j). This indicates that more than one CDK inhibitor protein cooperate to promote cell cycle arrest upon MAT2A inhibition.
Fig. 3. MAT2A inhibition leads to cell cycle arrest and DNA damage in liver cancer cells.

a, Volcano plot of differential gene expression from RNA-seq of vehicle control and FIDAS-5 treated Huh7 cells (n=3 samples for each group). b, GSEA plots of indicated gene sets based on RNA-seq of vehicle control and FIDAS-5 treated Huh7 cells (n=3 samples for each group). c, MeDIP-QPCR analysis of methylation status of indicated CpG islands of gene promoters. d, Western blot analysis of Huh7 and Hep3B cells with or without 48-hour FIDAS-5 (5 μM) treatment. e, Representative immunofluorescence images of vehicle control and FIDAS-5 treated Huh7, Hep3B cells stained with 53BP1 (red) and DAPI (blue). Scale bar: 100 μM. f, g, Representative SA-β-gal staining (f) and quantification (g) of vehicle control (Veh) and decitabine-treated Huh7 and Hep3B cells. Scale bar: 100 μm. h, Representative crystal violet staining of vehicle control and decitabine treated Huh7 and Hep3B cells in long-term growth assays. Data presented as mean ± s.e.m. of three independent experiments; statistical significance was determined by the Kolmogorov Smirnov (K-S) test (b) or a two-tailed Student’s t-test (c, g). Experiments were repeated three times independently, with similar results (d).
Given that blocking methionine catabolism leads to DNA hypomethylation and cellular senescence (Fig. 3c), we reasoned that DNA hypomethylating agents should phenocopy FIDAS-5 to induce senescence in liver cancer cells. To test this, we treated Huh7 and Hep3B cells with decitabine, a well-established DNA methyltransferase inhibitor that promotes DNA hypomethylation37. Indeed, decitabine exposure led to early DNA damage and cytoplasmic DNA accumulation in both cell lines (Extended Data Fig. 6a, b), followed by appearance of senescence phenotypes (Fig. 3f, g). Similar to FIDAS-5 treatment, decitabine-induced senescent (DIS) Huh7 cells failed to recover their proliferation in short term growth and three-week clonogenicity assays (Fig.3h and Extended Data Fig. 6c). Overall, we concluded that MAT2A inhibition results in cell cycle arrest and DNA damage, functionally facilitating liver cancer cell senescence.
GSK3 is a senolytic target in FIS liver cancer cells.
TIS cancer cells can be eliminated by senolytics that specifically induce their cell death: the combination of pro-senescence therapeutics and senolytics has emerged as a promising cancer treatment option13, 30, 38–41. For example, the CDC7 inhibitor XL413 induces senescence in p53-mutant cancer cells, which become selectively vulnerable to mTOR inhibitors13. Based on the suitability of kinases as drug targets and availability of a kinase inhibitor library, we sought to identify new senolytic targets in FIS liver cancer cells by performing a screen as previously described13 (Fig. 4a). Among 160 kinase inhibitors, BIO and CHIR99021, two GSK3 kinase inhibitors, more effectively and specifically decreased the viability of FIS Huh7 cells compared to control proliferating cells (Fig. 4b). After validating dose-dependent senolytic effects of BIO and CHIR99021 on FIS Huh7 cells (Extended Data Fig. 7a), we evaluated two more potent GSK3 inhibitors: LY2090314 and CHIR98014. Of note, single-agent LY2090314 has acceptable safety but limited clinical benefit in acute myeloid leukemia patients in phase II trials42, 43. We confirmed that both LY2090314 and CHIR98014 preferentially eliminated FIS Huh7 and Hep3B cells in vitro in a dose- and time course-dependent manner (Fig. 4c, d and Extended Data Fig. 7b). Focusing on LY2090314, we found that LY2090314 profoundly diminished the viability of senescent Huh7 cells induced by FIDAS-5, decitabine, XL413 and MAT2A deficiency (Fig. 4e and Extended Data Fig. 7c, d), suggesting that GSK3 inhibitors can be relatively broad senolytic agents for HCC. In support of this, Huh6 cells, which did not undergo senescence by FIDAS-5 treatment, were not sensitive to LY2090314 (Extended Data Fig. 7e).
Fig. 4. Identification of GSK3 inhibitors as senolytics in MAT2A-inhibited liver cancer cells.

a, Scheme of kinase inhibitor library screen in control and FIS Huh7 cells. b, Quantification of relative cell viability in control and FIS Huh7 cells from kinase inhibitor screen. Each dot represents a kinase inhibitor at 2.5 μM. Two red dots represent BIO and CHIR99021, respectively. Relative activity for BIO and CHIR99021 in control and FIS Huh7 cells are shown in the table. c, Relative cell numbers of Huh7 cell line treated with indicated doses of LY2090314 and CHIR98014 for 72 hours. d, Relative cell numbers of Huh7 cell line treated with indicated doses of LY2090314 and CHIR98014 over time. e, Representative crystal violet staining of vehicle control and FIS Huh7 and Hep3B cells treated with indicated doses of LY2090314. f, Cell viability (% PI-) of Huh7 cells treated with indicated doses of LY2090314. g, Representative crystal violet staining of FIS Huh7 cells transfected with indicated siRNAs. Data presented as mean ± s.e.m. of three independent experiments; statistical significance was determined by a two-tailed Student’s t-test (c, d, f). Experiments were repeated three times independently, with similar results (e, g).
As a component of Wnt signaling pathway, GSK3 family proteins directly phosphorylate β-catenin to promote its degradation, thus GSK3 inhibition should activate Wnt signaling43. Interestingly, loss of the H3K9me3 histone mark in TIS lymphoma cells renders senescent cells capable of re-entering the cell cycle with strongly enhanced Wnt signaling-dependent growth potential44. Both GSK3A and GSK3B expression was elevated in FIS cells and remained unchanged by LY2090314 treatment (Extended Data Fig. 8a), while Wnt signaling activity was decreased, based on luciferase reporter and subcellular fractionation assays (Extended Data Fig. 8b, c). Furthermore, higher expression of either GSK3A or GSK3B was negatively correlated with liver cancer patient survival (Extended Data Fig. 8d). These results suggest that FIDAS-5-induced senescence in liver cancer cells is distinct from TIS lymphoma cells in terms of Wnt signaling activation. Importantly, CRISPR-mediated GSK3A or GSK3B deletion reduced Huh7 cell growth without inducing cell death (Extended Data Fig.7 e-g), while loss of both GSK3A and GSK3B by shRNAs sensitized Huh7 cells to FIDAS-5 exposure (Extended Data Fig.8 h, i). Similarly, although LY2090314 impaired the proliferation of proliferating Huh7 cells, it failed to induce cell death as noted for FIS cells, and even slightly increased their viability (Fig. 4f and Extended Data Fig. 8j). Finally, we employed siRNAs to knock down GSK3A and GSK3B in FIS cells (Extended Data Fig.8k) and found that simultaneous depletion of both GSK3A and GSK3B dramatically decreased their viability (Fig. 4g). Altogether, these results indicate that the senolytic effects of GSK3 inhibition are FIS-dependent in liver cancer cells.
GSK3 inhibition induces senolysis partially by apoptosis.
We next determined how GSK3 inhibition promotes cell death in FIS liver cancer cells. Multiple mechanisms were possible, based on previous reports. Specifically, GSK3B inhibition bypasses drug resistance of p53-null colon carcinoma cells via PARP1-dependent and AIF-mediated but RIP1-independent necroptosis45, and GSK3B promotes cell survival by modulating Bif-1-dependent autophagy and cell death46. We employed pharmacological approaches to block specific cell death pathways and tested whether they can compromise LY2090314’s senolytic effects. Among these, the ferroptosis inhibitor ferrostatin-1 (Fer-1) did not rescue cell death (Fig. 5a). Olaparib, a specific PARP inhibitor that blocks poly-ADP ribose polymerase involved in DNA repair, also showed no beneficial effect, potentially excluding ferroptosis and PARP1-dependent mechanisms. To test whether autophagy is involved, we used Chloroquine (CQ) or Bafilomycin A1 (BafA1) at various concentrations; however, neither drug showed any substantial effects (Fig. 5a). Lysosome-dependent cell death is another mechanism that can be perturbed in vitro and in vivo by inhibiting lysosomal membrane permeabilization (LMP) or blocking cathepsin activity via pharmacological means47. However, common cathepsin inhibitors like Cathepsin Inhibitor 1 and E64D respectively failed to reverse cell death at their working concentrations (Fig. 5b).
Fig. 5. GSK3 inhibition promotes senolysis partially through apoptosis in TIS.
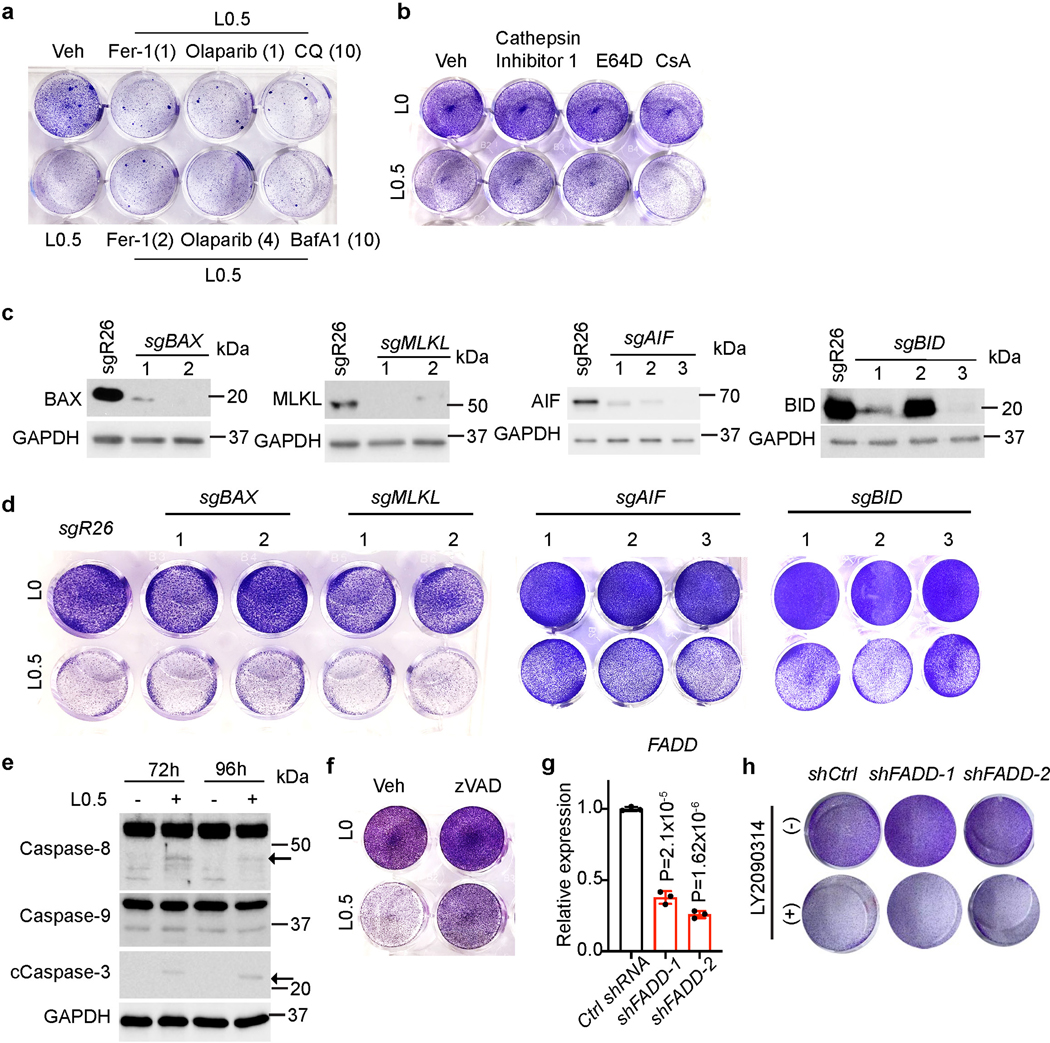
a, Representative crystal violet staining of FIS Huh7 cells treated with 0.5 μM LY2090314 (L0.5) with or without additional indicated chemicals for 96 hours. Fer-1: Ferrostatin-1,1 or 2 μM. Olaparib, 1 or 4 μM. CQ: Chloroquine, 10 μM. BafA1: bafilomycin A1, 10 nM. b, Representative crystal violet staining of FIS Huh7 cells treated for 96 hours with indicated single or combination treatment groups. c, Western blot analysis of Huh7 cells expressing indicated sgRNAs. GAPDH serves as a loading control. d, Representative crystal violet staining of FIS Huh7 cells expressing indicated sgRNAs with or without 0.5 μM LY2090314 (L0.5) treatment for 96 hours. e, Western blot analysis of Caspase3, Caspase 8, Caspase 9 and GAPDH isolated from FIS Huh7 cells with or without 0.5 μM LY2090314 (L0.5) treatment at indicated time points. The arrows indicate the target bands. f, Representative crystal violet staining of FIS Huh7 cells from vehicle, LY2090314 (L0.5), zVAD (50 μM) and combined LY2090314 (L0.5)/zVAD (50 μM) treatment groups. g, Q-PCR analysis of FADD mRNA levels in control and knocked down cells. h, Representative crystal violet staining of FIS Huh7 cells from shCtrl and shFADD-1/2 groups with or without 0.5 μM LY2090314 treatment for 96 hours. Data presented as mean ± s.e.m. of three independent experiments; statistical significance was determined by a two-tailed Student’s t-test (g). Experiments were repeated three times independently, with similar results (a-f, h).
To test the involvement of mitochondrial permeability transition (MPT)-driven necrosis, we also treated FIS cells with cyclosporin A (CsA), the cyclophilin D (CYPD) inhibitor, but failed to prevent LY2090314-induced cell death (Fig. 5b). CRISPR approaches to deplete MLKL, the key component of necroptosis signaling pathways also failed to rescue cell death (Fig. 5c, d). Similar results were obtained when BAX or BID was depleted by CRISPR: BAX or BID-depleted Huh7 cells remained equally sensitive to LY2090314 as control FIS cells (Fig. 5c, d). These findings differ from a previous study in which BID regulates AIF-mediated and caspase-independent necroptosis by promoting BAX activation48. Finally, we observed that LY2090314 modestly increased cleaved Caspase 3 levels in FIS cells (Fig. 5e), suggesting apoptosis likely contributes to the induced cell death. Indeed, z-VAD-FMK (zVAD), the pan-caspase inhibitor, substantially (albeit incompletely) prevented LY2090314-mediated loss in cell viability (Fig. 5f). Notably, knockdown of FADD encoding an essential component of extrinsic apoptosis pathways47, didn’t prevent cell death triggered by LY2090314 (Fig.5g, h), suggesting that intrinsic apoptosis pathway(s) most likely account for the observed cell death. Given the complexity and crosstalk between cell death pathways47, and the fact that GSK3 phosphorylates a broad spectrum of substrates43, GSK3 inhibition may induce TIS cell death though multiple inter-related mechanisms including apoptosis. Future studies are required to resolve these issues.
Combined MAT2A and GSK3 inhibition limits liver tumor growth.
Finally, we asked whether combined MAT2A and GSK3 inhibitor treatment could be an effective option for liver cancer intervention. We first performed an in vitro 12-day (long-term) cell growth assay, where Huh7 cells were exposed to elevated doses of FIDAS-5 and LY2090314 as single agents or in combination (Fig. 6a). Consequently, combined FIDAS-5/LY2090314 treatment led to diminished cellularity compared to single agent treatment groups (Fig. 6a). Similar synergistic effects were observed between two additional pro-senescence agents (XL413 and decitabine) and LY2090314 in long-term cell growth assays (Extended Data Fig. 9a).
Fig. 6. Combined MAT2A and GSK3 inhibition therapeutically limits liver tumor growth.
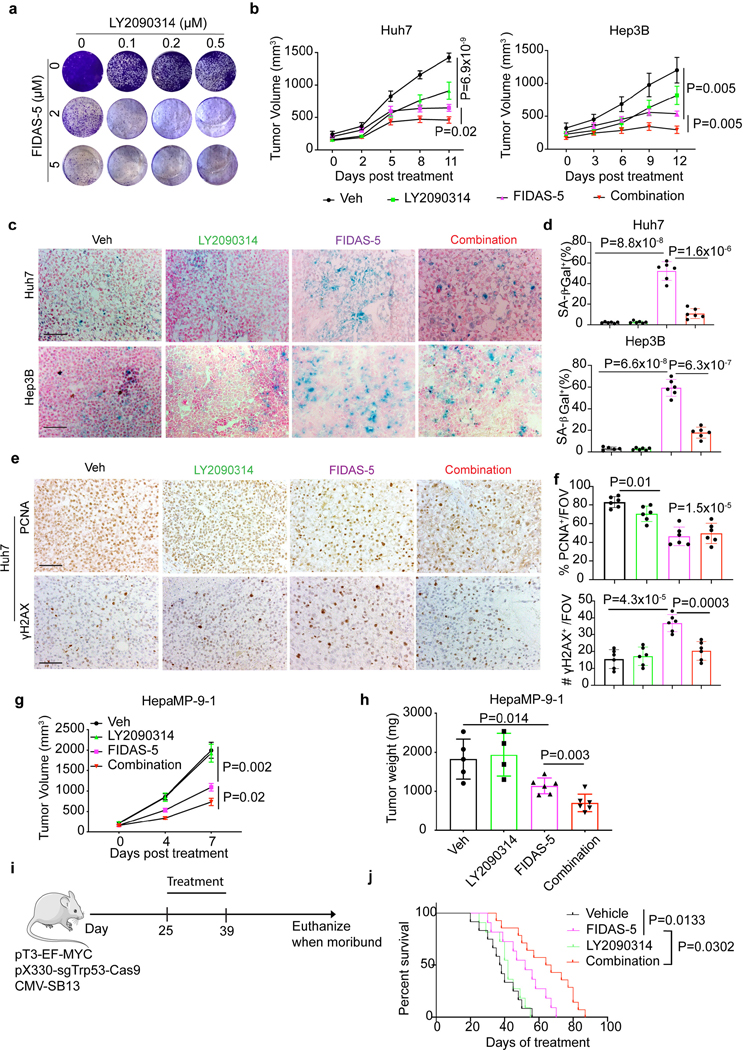
a, Representative crystal violet staining of Huh7 cells treated with indicated doses of drug combination for 12 days. b, Quantification of Huh7 and Hep3B xenograft tumor volumes over time in vehicle control (Veh) and FIDAS-5, LY2090314 and combined FIDAS-5/LY2090314 treatment groups. Huh7: n=6 for each group. Hep3B: n=5 female mice for Veh, n=6 female mice for FIDAS-5, n=6 female mice for LY2090314, n=7 female mice for combination group. c, d, Representative SA-β-gal staining (c) and quantification (d) of Huh7 and Hep3B xenograft tumor sections obtained from indicated treatment groups. Huh7: n=6 female mice for each group. Hep3B: n=5 female mice for Veh, n=6 female mice for FIDAS-5, n=6 female mice for LY2090314, n=7 female mice for combination group. To quantify, 5 representative images with a ×200 field of view (FOV) were used for quantification using Image J and averaged for each animal. Scale bar: 100 μm. e, f, Representative IHC images (e) and quantification (f) of PCNA and γH2AX staining in Huh7 xenograft tumor sections resected from indicated treatment groups. To quantify, 3–5 representative images with a ×200 FOV were used for quantification using Image J and averaged for each animal. n=6 mice for each group. Scale bar: 100 μm. g, Quantification of HepaMP9–1 allograft tumor volume over time in vehicle control (Veh, n=5 male mice) and FIDAS-5 (n=7 male mice), LY2090314 (n=4 male mice) and combined FIDAS-5/LY2090314 (n=6 male mice) treatment groups. h, Quantification of end point HepaMP9–1 allograft tumor weights in vehicle control (Veh, n=5 male mice) and FIDAS-5 (n=7 male mice), LY2090314 (n=4 male mice) and combined FIDAS-5/LY2090314 (n=6 male mice) treatment groups. i, Scheme of liver tumorigenesis and drug treatments of wildtype mice. j, Kaplan–Meier overall survival curves of indicated groups of mice. Veh: n=12 male mice, FIDAS-5: n=11 male mice, LY2090314: n=11 male mice, and Combination: n=14 male mice. Data presented as mean ± s.e.m. (b, d, f, g, h); statistical significance was determined by a two-tailed Student’s t-test (b,d,f,g,h) or log-rank Mantel–Cox test (j). Experiments were repeated three times independently, with similar results (a).
To ascertain whether our in vitro findings were recapitulated in vivo, we generated Huh7 and Hep3B xenografts followed by drug treatment. A combination of FIDAS-5 and LY2090314 exhibited more effective inhibition of xenograft tumor growth (Fig. 6b and Extended Data Fig. 9b, c), while mouse body weights were comparable among different groups (Extended Data Fig. 9d). FIDAS-5-treated tumors showed increased numbers of SA-β-gal+ and γH2AX+ cells, and decreased expression of PCNA (a proliferation marker) as compared to tumors treated with vehicle or LY2090314 (Fig. 6c-f and Extended Data Fig. 9e). These results validate the notion that MAT2A inhibition robustly induces senescence in vivo. DNA damaged (γH2AX+) and SA-β-gal+ cells in the combination-treated group were remarkably reduced compared with the FIDAS-5 group (Fig. 6c-f and Extended Data Fig. 9f), suggesting that senescent cells were efficiently eliminated by treatment with LY2090314. We also performed drug treatment on wild type and immune-competent mice bearing MYCOE;Trp53KO HCC allografts. Mice that received FIDAS-5 monotherapy exhibited a reduction in tumor volume and weight, whereas treatment with FIDAS-5 and LY2090314 more significantly reduced tumor growth (Fig. 6g, h).
Finally, we evaluated combinatorial treatment effects in an autochthonous mouse model of liver cancer. Using hydrodynamic tail vein injection, we delivered a MYC-expressing transposon vector and another expressing Cas9 and Trp53 sgRNA to hepatocytes of C57BL/6J mice, where MYC overexpression and p53 loss trigger massive liver tumorigenesis and shorten animal survival13. After injection, mice received different treatment regimens and their survival was monitored (Fig.6i). Mice receiving LY2090314 monotherapy exhibited comparable overall survival to vehicle controls, while animals in the FIDAS-5 treatment group had significantly longer survival. Most importantly, the longest overall survival was observed with combined FIDAS-5 and LY2090314 administration (Fig. 6j). Wild type mice receiving combined FIDAS-5 and LY2090314 treatment had comparable body weight change and liver histology to the vehicle cohort (Extended Data Fig. 9g, h), consistent with enhanced therapeutic effects relative to FIDAS-5 monotherapy. We concluded that pro-senescence therapy via a MAT2A inhibitor combined with GSK3 inhibitors represents an enhanced therapeutic benefit in liver cancer.
DISCUSSION
Defining metabolic interactions in liver tumor microenvironments provides enhanced understanding of disease progression and uncovers potential druggable dependencies for therapeutic intervention5, 49, 50. In this study, we find that most liver cancer cells undergo irreversible cell cycle arrest upon acute methionine deprivation. Among the cell lines tested, only SNU449 cells showed dramatic apoptosis upon methionine deprivation, potentially because this cell line is deficient in S-methyl-5’thioadenosine phosphorylase (MTAP), which results in methylthioadenosine (MTA) accumulation and consequent inhibition of the PRMT5 histone methyltransferase51, 52. This interpretation is consistent with previous reports that methionine deprivation or MAT2A inhibition is synthetically lethal with MTAP-deficiency in cancer cells53, 54. We also detect profound DNA damage in methionine-deprived liver cancer cells, comparable to that induced by MAT2A inhibition, prior to any observable evidence of senescence. Because cell cycle arrest and persistent DNA damage triggers senescence and SASP gene expression, we believe these early responses to methionine catabolism blockage, namely cycle arrest and profound DNA damage, are causes rather than consequences of cellular senescence in this context. Interestingly, while liver cancer cells are genetically heterogeneous, most cell lines sensitive to disrupted methionine catabolism are p53-mutant. In contrast, p53 wild type Huh6 cells fail to respond to FIDAS-5 treatment. Whether p53 status determines FIDAS-5 sensitivity remains to be validated, but it seems possible that such genetic alterations affect cellular responses to cell cycle arrest and DNA damage repair. Indeed, p53 loss renders cancer cells unable to repair DNA damage induced by the CDC7 inhibitor XL413, and these p53-mutant cancer cells ultimately undergo senescence upon XL413 treatment 13.
MAT2A has recently been identified as a potential oncogene with context-dependent functions. For example, MAT2A inhibition blocks lung cancer cell proliferation16, and promotes apoptosis in other cancer cells with MTAP deficiency via reduced PRMT5-dependent mRNA splicing and increased DNA damage53. MAT2A depletion induces global decreases in H3K36me3, a chromatin mark of transcriptional elongation perturbing oncogenic and developmental transcriptional programs in H3K27M mutant glioma55. Furthermore, hepatocyte-specific Mat2a deletion significantly delays DEN and high fat diet-induced liver tumor development32. These findings collectively indicate that MAT2A is crucial for tumor initiation and progression. Our data identify a distinct mechanism by which MAT2A inhibition induces senescence in most human liver cancer cells with intact MTAP, establishing a previously unrecognized link between methionine metabolism and liver cancer growth. From a therapeutic perspective, these results also provide a rational strategy to induce senescence for liver tumor control by targeting methionine catabolism, which should be more effective than dietary methionine restriction that adversely promotes liver fibrosis and liver tumor progression in mice. Given MAT2A over-expression in lung cancer, melanoma and endometrial cancer16, we anticipate that MAT2A inhibition may have broad senescence-inducing effects in these, and potentially, other cancers with intact MTAP activity.
Molecular mechanisms that induce senescence by blocking methionine catabolism are likely to be complex but appear to be independent of oxidative stress, as ROS scavengers NAC and GSH fail to prevent this process. It is known that methionine availability alters gene expression through changes in DNA and/or histone methylation; for example, MAT2A inhibition results in histone hypomethylation in lung cancer cells16. Interestingly, we found that MAT2A inhibition decreases global histone methylation in liver cancer cells only after relatively long-term (7-day) FIDAS-5 treatment, whereas CpG island hypomethylation and DNA damage accumulation are detected as early as 48 hours post treatment. This strongly suggests that DNA hypomethylation accounts for early expression changes in genes involved in cell cycle arrest and genome instability. Indeed, among the genes affected, we identify gene signatures of cell cycle arrest and DNA damage repair in early-stage cancer cells upon methionine deprivation or MAT2A inhibition, consistent with a causative role in senescence induction34–36. Moreover, the DNA hypomethylating agent decitabine phenocopies MAT2A inhibition, inducing similar early cell cycle arrest, DNA damage and later senescence. Notably, despite the overall increase in expression of multiple CDK inhibitor (CDKN) genes upon MAT2A inhibition, individual CDKN basal mRNA and protein levels vary among liver cancer cell lines, and p21 seems to be dispensable for senescence on its own. Therefore, the identity of all functional CDKNs and their precise upregulation mechanisms remain to be further clarified. It is also interesting to note that H3K9me3-based SAHF can account for the transcriptionally repressive shutdown of E2F target genes in an Rb-dependent manner, thereby firmly locking cells in the G1 phase of the cycle during replicative senescence and oncogene-induced senescence34. In contrast, liver cancer cell senescence during MAT2A inhibition occurs in a virtually opposite manner: the methyl donor-deprived cells exhibit reduced levels of H3K9me3. Therefore, SAHF appears to be dispensable for certain treatment-induced senescent (TIS) cancer cells.
We acknowledge that TIS in cancer represents a double-edged sword. While senescent liver cancer cells can activate antitumor immunosurveillance56, 57, residual senescent cells can also promote heterogeneous tumor growth30, 33, 38, 39, 41. Senolytics, previously used to eliminate senescent cells in ageing-associated disease models, have been repurposed for cancer treatment13, 38, 58. We previously showed that senolytic targeting of senescent HSCs blunts liver tumor progression driven by hepatic FBP1 deficiency12. In this study, we identify GSK3 inhibitors as selective senolytics that can effectively eliminate senescent liver cancer cells downstream of MAT2A inhibition. Moreover, such senolytic effects have been extended to other forms of TIS in liver cancer, including those induced by decitabine and the CDC7 inhibitor XL413. As such, GSK3 inhibitors could be more broadly used in senotherapy. While combining pro-senescence agents with senolytics is a viable treatment option, an ideal regimen in the future would be sequential treatment with pro-senescence agents followed by senolytics. However, several challenges remain, including a lack of rational strategies to monitor and characterize cancer cell senescence in vivo, and heterogeneous responses of tumor cells to senescence-inducing agents39.
As stated previously, HCC is an extremely heterogeneous disease in terms of genetic mutations and tumor microenvironments. In addition to p53 mutations observed in one third of HCC patients, Wnt-driven HCC represents another distinct category, while fibrotic and inflammatory microenvironments also have profound impact on treatment outcomes. Because our mouse models exclusively recapitulate p53-mutant liver tumorigenesis in the absence of fibrosis, it remains to be determined whether combined MAT2A/GSK3 inhibition can be applied to either Wnt-driven HCC or that involving liver fibrosis. Finally, given that senescent liver cancer cells can activate antitumor immunosurveillance56, 57, it will be important to explore whether our treatment regimen can be combined with antiangiogenic and immunotherapy, now a mainstream treatment option for unresected liver tumors in clinic3.
GSK3 proteins have pleiotropic functions in stem cell self-renewal, metabolic homeostasis, cancer cell survival and apoptosis43; however, their functions in cellular senescence have not been reported previously. Here we show that GSK3 maintains the viability of TIS liver cancer cells, and its inhibition elicits senescent cell death at least partly though intrinsic apoptosis pathways. Our results contrast with recent findings that senescent cancer cells are vulnerable to extrinsic apoptosis pathway activation59, which may be explained by differences in cancer cell types and senescence-inducing agents. GSK3 directly or indirectly modulates a broad spectrum of targets and GSK3 inhibition could exhibit pleiotropic effects on the kinome and related signaling pathways60. In addition, such effects may be further modified in the context of cancer cell senescence, and different from normal cells. Importantly, mice treated with the GSK3 inhibitors used here exhibited no overt toxic effects. Whether GSK3 inhibition activates a previously uncharacterized cell death pathway in senescent cancer cells, or simultaneously functions through multiple pathways will be the focus of future studies.
In summary, we provide a strategy to induce senescence in liver cancer cells by targeting MAT2A-mediated methionine catabolism and identify GSK3 inhibitors as senolytics. Combined MAT2A and GSK3 inhibition constitute an actionable pro-senescence and senolytics-based liver cancer treatment that we propose will be valuable for further validation in clinic.
METHODS
Our research complies with all relevant ethical regulations of both University of Pennsylvania and Fudan University. All animal protocols were approved by the Animal Research Ethics Committee of both institutions, and were performed following the guidelines for the use of laboratory animals.
Cell lines and culture conditions.
Hep3B, SNU449, PLC/PRF/5, 293T, TOV21G and HepG2 cell lines were purchased from ATCC. Huh6 (RCB1367) and Huh7 (RCB1366) cell lines were originally purchased from Riken Cell Bank. HepaMP-9–1 cell line was derived and maintained in the Simon lab at the University of Pennsylvania. Huh6, Huh7, Hep3B, PLC/PRF/5 and HepaMP9–1 cells were cultured in DMEM medium containing 10% fetal bovine serum (FBS). SNU449 and HepG2 cells were cultured in RPMI medium containing 10% FBS as previously described12. The cells were routinely tested to exclude mycoplasma contamination.
Methionine deprivation and regeneration assays.
For methionine deprivation, single cells in complete medium were seeded in 6-well plates (5×10⁴/well in triplicate) for 24 hours, then the medium was replaced with fresh methionine-free DMEM (Thermo Fisher Scientific, #21013024) containing 10% dialyzed FBS with or without exogeneous methionine (0–0.2 mM), and the cells were cultured for 72 hours. For methionine regeneration assays, the culture conditions remained the same unless exogeneous homocysteine (10–100 μM, Sigma, # 69453), vitamin B12 (100 nM, Sigma, #V6629) or 5-meTHF (10 μM, Sigma, #M0132) was supplemented to the culture medium.
Cell growth and clonogenicity assays.
For cell growth assays, single cells in complete medium were seeded in 12-well plates (1x10⁴/well, in triplicate), and the growth medium was changed every 3 days. When cells in control groups became 100% confluent, the cells were used for crystal violet staining. For clonogenicity assay, the cells were seeded in 12-well plates (1×10²–1×10³/well, in triplicate) and cultured for 12–21 days when cells in control groups became 100% confluent, the medium was changed every 3 days.
In vitro drug treatment.
For FIDAS-5 treatment in Extended Data Fig.4a, Huh7 and Hep3B cells were seeded in 6-well plates (5x10⁴/well, in triplicate) for 24 hours, then treated with different concentrations of FIDAS-5 (Sigma, #5.04173) in growth medium for 72 hours. For senolytic treatment, senescent Huh7 and Hep3B cells were seeded in 6-well plates (2×10⁵/well, in triplicate) for 24 hours, then treated with indicated drugs for 1–5 days. The viable cell numbers were manually counted with a hemacytometer. To induce senescence, Huh7 and Hep3B cells were seeded into 10-cm plates (1x10⁶/plate) for 24 hours, then cultured in FIDAS-5 (5 μM for Huh7, 1 μM for Hep3B)-containing or decitabine (1 μM for Huh7, 0.5 μM for Hep3B)-containing growth medium for 6 days, the medium was changed every 3 days. For long-term treatment with different drug combinations, proliferating (1x10⁴/well) and senescent (105/well) Huh7 and Hep3B cells were seeded in 12-well plates for 24 hours, then treated with indicated drug combinations/doses for 12 days; the medium was changed every 3 days. The following chemicals were purchased from Selleck: LY2090314 (S7063), CHIR98014 (S2745), XL413 (S7547), Decitabine (S1200), Fer-1 (S7243), Olaparib (S1060), CQ (S6999), BafA1 (S1413), Cathepsin Inhibitor 1 (S2847), E64D (S7393), CsA (S2286) and zVAD (S7023), NAC (S1623), reduced GSH (S4606).
Crystal violet staining.
The cells were washed once with 1xPBS, then stained with 1xPBS solution containing 20% methanol and 0.25% crystal violet for 30 min, the cells were then washed to remove residual crystal violet as described 12.
EdU labeling and Annexin V-PI apoptosis assay.
Cultured cells were labeled with 10 μM EdU over 4 hours, trypsinized and fixed with 4% PFA. The incorporated EdU was detected by a Click-iT™ EdU Alexa Fluor™ 488 Flow Cytometry Assay Kit according to the manufacturer’s instructions (ThermoFisher Scientific, #C10420). Cell death was determined using the FITC–Annexin V, PI Kit (catalog no. 556547) from BD Biosciences according to the manufacturer's instructions. Flow cytometry was performed using the BD FACS Calibur instrument (BD FACS Calibur), dead cells were represented as Annexin V-positive population, data were analyzed with the FlowJo 10.6.2 software (https://www.flowjo.com).
SA-β-Gal staining.
The SA-β-Gal staining was performed as previously described at pH 6.012. Cryosections or adherent cells were fixed with 0.5% glutaraldehyde for 15 min, washed with 1×PBS containing 1 mM MgCl2 and stained for 5–8 hours in staining buffer (1×PBS containing 1 mM MgCl2, 1 mg/ml X-Gal and 5 mM each of potassium ferricyanide and potassium ferrocyanide). The slides were then rinsed in 1×PBS, counterstained with 0.1% Nuclear fast red (Sigma) for 5 min and mounted for examination. To quantify, 3–5 representative images with a ×200 field of view for each sample/group were quantified using Image J12.
SAM and SAH quantification by LC-MS.
Huh7 cells were cultured in 15 cm plates and treated for 72 hours with either 5 or 10 μM FIDAS-5. Cells were washed twice, collected in ice cold saline, and quickly centrifuged (2 min, 4 oC, 500 x g). Metabolism was stopped by addition of cold 80% acetonitrile. Cells were lysed via three freeze/thaw cycles, centrifuged to remove protein (15 min, 4 °C, 15000 x g), and metabolite supernatant taken for analysis. Data acquisition was performed by hydrophilic interaction chromatography on a Vanquish Flex UHPLC (Thermo) system coupled to a Q Exactive mass spectrometer (Thermo). The mass spectrometer (MS) was operated in positive ion mode. Analytes were separated on an Acquity BEH Amide column (1.7 μm x 2.1 mm x 100 mm, Waters) at 35 °C. Mobile phase A composition was 10 mM ammonium acetate pH 9 and mobile phase B was 100% ACN. The LC gradient was: 0 min: 95% B; 10 min: 40% B; 15 min: 40% B; 16 min: 95% B; 25 min: 95% B. The flow rate was 300 μl min-1 with a sample injection volume of 2 μl. The MS was operated in full MS with the following parameters: resolution (140,000), AGC target (1e6), maximum IT (100 ms), and scan range (55 – 825 m/z). Data dependent MS/MS (dd-MS2) used the following parameters: resolution (17,500), AGC target (1e5), maximum IT (50 ms), loop count (5), topN (5), isolation window (1.5 m/z), stepped NCE (30, 60, 90), minimum AGC (8e3), and dynamic exclusion (4s). SAM and SAH peaks were verified by MS/MS and metabolite standards. Peaks were integrated using El-MAVEN and quantitated using an external calibration curve and normalized by BCA protein concentration61. Representative SAM and SAH chromatogram peaks from standards, vehicle control and FIDAS-5 treated Huh7 cells are provided in Supplementary Fig. 1.
TOP Flash/FOP Flash luciferase reporter assay 1x10⁵ control and FIS Huh7 cells were seeded into 12-well plates for 24 hours, TOP Flash (Addgene 12456) or Fop Flash (Addgene 12457) plasmids were co-transfected with a renilla plasmid using lipofectamine 2000 (Thermol Fisher), and luciferase activity was quantified using a dual luciferase assay kit (Promega). Relative Wnt signaling activity was calculated by normalizing relative TOP Flash luciferase activities to relative FOP Flash activities in each well.
Immunohistochemistry and Immunofluorescence staining.
Human HCC tissue array slides were purchased from US Biomax. DEN-induced mouse HCC tissue sections were described in our recent study12. Mouse tissues were fixed in 4% paraformaldehyde or embedded in OCT compound immediately after collection and submitted to the Molecular Pathology and Imaging Core (MPIC) at the University of Pennsylvania for processing, sectioning and HE staining, as previously12. For IHC, the slides were deparaffinized, rehydrated, quenched in 0.6% hydrogen peroxide in methanol for 15 min. Antigen retrieval was performed in citrate buffer (10 mM, pH 6.0). The slides were incubated overnight with primary antibodies at 4 °C and then with biotinylated secondary antibodies, followed by ABC solution, and developed with 3,3′-diaminobenzidine (Vector Laboratories, PK-6100). The slides were counterstained with hematoxylin, dehydrated and mounted with Permount (Thermo Fisher). To quantify IHC stainings, 3–5 representative images with a ×200 FOV were used for quantification using Image J and averaged for each animal. For immunofluorescence staining, cryosections were incubated with 0.25% Triton X-100 (10 min at room temperature) and blocking buffer (4% BSA and 2% serum in 1xPBS; 1 hour at room temperature), followed by primary antibodies incubation overnight at 4 °C. Fluorescein-conjugated secondary antibodies (Thermo Fisher) were incubated for 1 hour at room temperature and mounted with ProLong Gold Antifade Mountant with 4′,6-diamidino-2-phenylindole (DAPI; Thermo Fisher). All antibody information is provided in Supplementary Table 1. Slides were examined, and images captured on a Leica DM5000B microscope. To quantify IF stainings, 5 random x200 fields of view containing at least 30 cells were counted and averaged for each group.
Constructs and cell transfections.
sgRNAs were cloned into LentiCRISPR v2 (Addgene #52961) linearized with BsmBI, and shRNAs were cloned into pLko.1-puro (Addgene #8453) linearized with AgeI and EcoRI. To produce lentiviruses, 293T cells were co-transfected with LentiCRISPR v2 or pLko.1-puro plasmids along with packaging plasmids psPAX2 and pMD2.G using FuGENE 6 transfection reagent (cat. E2691, Promega). Lentiviruses were collected 48 hours after transfection. All oligonucleotides for sgRNAs and shRNAs are provided in Supplementary Table 2. ON-TARGETplus Non-targeting control pool (D-001810–10-05), ON-TARGETplus Human GSK3A (L-003009–00-0005) and GSK3B (L-003010–00-0005) siRNA pools were ordered from Horizon Discovery and transfected using Lipofectamine™ RNAiMAX Transfection Reagent (ThermoFisher Scientific, #13778075) following the manufacturer’s instructions.
Mouse experiments.
This study is compliant with all the relevant ethical regulations regarding animal research. All mouse experiments were reviewed and approved by the Institutional Animal Care and Use Committee at the University of Pennsylvania and Fudan University. Male C57BL/6J, female NOD-scid IL2Rgammanull (NSG) mice (The Jackson Laboratory, 4–6 weeks) and female BALB/c (Charles River Laboratories, 4–6 weeks) mice were maintained in a SPF animal facility at the University of Pennsylvania. Animals were housed at a suitable temperature (22–24 °C) and humidity (40–70%) under a 12/12-h light/dark cycle with unrestricted access to chow diet (15 kcal% Fat, D11112201, RESEARCH DIETS) and water for the duration of the experiment. For subcutaneous injections, 5x10⁶ HepaMP-9–1, Huh7 and Hep3B cells mixed 1:1 with Matrigel (BD Biosciences, #356234) in a final volume of 100 μl were injected into the blanks of C57BL/6J, BALB/c and NSG mice, respectively. Xenograft tumor burden was less than the maximum tumor size (2 cm3) approved by the Animal Research Ethics Committee of the University of Pennsylvania and Fudan University. For orthotopic injection, a surgery was performed on C57BL/6J mice under anesthesia to expose the median lobe of livers, 1x10⁵ HepaMP-9–1 cells mixed 1:1 with Matrigel in a final volume of 5 μl were injected under the liver capsule using a Hamilton syringe with a 26-G needle, as previously62. The liver lobes containing tumors were collected at 3 weeks post injection. For xenograft and allograft tumors, tumor volume was monitored by caliper measurements. When tumor volume reached 100 mm3, mice were randomized and divided into groups for drug treatment. For hydrodynamic tail vein injection (HDTI)13, vectors were prepared using the EndoFree-Maxi Kit (Qiagen) and resuspended in a sterile 0.9% NaCl solution/plasmid mix containing 10 μg of pT3-MYC (Addgene 92046), 10 μg of pX330-p53 (Addgene 59910), and 2.5 μg of CMV-SB13 transposase. A total volume mix corresponding to 10% of body weight was injected via lateral tail vein in 5–8 s into 6-week-old male C57Bl/6J mice, as previously13. HepaMP-9–1 is a syngeneic MYCOE;Trp53KO mouse HCC cell line from an HCC in C57BL/6J mouse after HDTI. For drug treatment, FIDAS-5 was diluted in 100 μl corn oil and injected at 10 mg/kg for 7 days, LY2090314 was diluted in 100 μl 40% (vol/vol) PEG400 and injected at 2.5 mg/kg for 7 days, and 100 μl corn oil or 40% PEG400 solution were used as vehicles. Drug treatment of HDTI-treated C57BL/6J mice remained the same, except that the treatment lasted for 2 weeks, the mice were carefully monitored, and euthanized when moribund.
Subcellular fractionation and Western blot analysis.
Subcellular fractionation was performed as previously12. Cells were washed with 1x PBS and lysed using lysis buffer (150mM NaCl, 10mM Tris pH7.6, 0.1% SDS and 5mM EDTA) containing Halt Protease and Phosphatase Inhibitor Cocktail (Thermo Fisher Scientific, 78445). Samples were centrifuged at 12,000 g for 20 min at 4°C. Protein lysates were separated by SDS-PAGE and were transferred to nitrocellulose membranes (Bio-Rad, 162–0115). All membranes were incubated with the indicated primary antibodies diluted in TBS-T (20mM Tris pH7.5, 150mM NaCl, 0.1% Tween-20) with 5% bovine serum albumin (BSA, Sigma-Aldrich, A7906) overnight at 4 °C. After TBS-T washes, membranes were incubated with secondary antibody and developed with Western Lightning Plus-ECL, Enhanced Chemiluminescence Substrate (PerkinElmer, cat. NEL103E001EA). Membranes were scanned using a Mini Chemiluminescent Imaging and Analysis System (Bio-rad). All antibodies are provided in the Supplementary Table 1.
Kinase inhibitor screen.
A Kinase Screening Library (96-Well) was purchased from Cayman (#10505). To screen, each well of DMSO and inhibitor stock was diluted into corresponding new 96-well plates containing 1 μl DMSO or inhibitor at 200, 500 μM and 1 mM, respectively. Control (5x10²/well) and senescent (1x10⁴ /well) Huh7 cells in 200 μl growth medium were added, so the final concentration of each drug was 1 μM, 2.5 μM and 5 μM, respectively. The cells were cultured for 6 days and then cell viability was quantified using the CellTiter-Blue Cell Viability Assay (Promega, #PAG8081). The relative survival of control cells and senescent cells in the presence of drug was normalized against DMSO control wells after subtraction of background signal. The kinase inhibitor small molecule screening information is provided in the Supplemental Table 4.
Quantitative reverse transcription PCR (qRT-PCR).
Total RNA was isolated using RNeasy Mini Kit (Qiagen, Cat. 74104). cDNA was synthesized using a High-Capacity RNA-to-cDNA kit (Applied Biosystems, Cat. 4368814). qRT-PCR was performed using ViiA7 Real-Time PCR system (Applied Biosystems) with SYBR green master mix (Life Technologies. Cat. 4444965). The relative mRNA levels were normalized to 18S ribosomal RNA. All primers are provided in Supplementary Table 3.
MeDIP.
Genomic DNA was extracted from 1x10⁶ vehicle control and FIDAS-5-treated (48-hour, 5 μM) Huh7 cells. MeDIP was performed with a kit from Active Motif (#55009) following the manufacturer’s instructions. Quantitative PCR analysis was performed with immunoprecipitated DNA from IgG and MeDIP groups using individual gene’s CpG island-specific primers, and results were normalized to that of IgG control groups. All primers are described in Supplementary Table 3.
RNA-seq and GSEA.
Total RNA was extracted from vehicle and FIDAS-5 treated Huh7 cells using a RNeasy mini kit (Qiagen). The RNA quality test, library construction and sequencing were performed by Novogene Corporation (Beijing). Data analysis was performed as described12, Fastq files were checked for quality using FastQC and qualimap. Alignment was performed using the STAR aligner under default settings with the hg19 reference genome. Raw counts of gene transcripts were obtained from the resulting bam files using the feature Counts. The raw count matrix was subsequently imported into R-studio (R version 3.3.3) and used as input for DESeq2 following the vignette of the package for normalization and differential gene expression analysis. Salmon/Sailfish was used in parallel to normalize and quantitate gene expression in transcripts per million through quasi-alignment. Gene set enrichment analysis (http://software.broadinstitute.org/gsea/index.jsp) was run for the contrast in pre-ranked mode using the DESeq2 statistic as the ranking metric. Where there were redundant mappings, the statistic with the highest absolute value was chosen63.
Statistics & Reproducibility.
All results were obtained from three independent biological experiments, using three technical replicates per condition, unless stated otherwise. Data distribution was assumed to be normal, but this was not formally tested. No statistical methods were used to predetermine sample size, but ours are similar to those reported in a previous publication12. No data were excluded from the analyses. The experiments were not randomized, except that mice were randomly grouped before different treatments. Data collection and analysis were not performed blinded to the conditions of the experiments. Statistical analyses per experiment are indicated in figure legends. Statistical tests were performed in GraphPad Prism 9.0.0 using Student’s two-tailed unpaired t-test for pairwise comparisons, one-way analysis of variance (ANOVA) for multiple comparisons, two-way ANOVA for multiple comparisons involving two independent variables, or by log-rank test for comparisons of survival distributions of two groups. Statistical data are presented as mean ± SEM of at least three independent experiments unless stated otherwise. A P value less than 0.05 was considered significant.
Data Availability.
Human liver cancer data were derived from the TCGA Research Network: http://cancergenome.nih.gov/, and were downloaded and analyzed at the Molecular Profiling Facility at the University of Pennsylvania as previously12. For single cell RNA-seq data analysis, MAT2A transcript levels were compared between 1,497 non-malignant and 7,285 tumorigenic hepatocytes using published dataset under accession code GSE14961464. Expression and the percentage of cells in which gene expression was analyzed using the non-parametric Wilcoxon rank-sum test. Each point represents expression value of each single cell and the yellow dot represents the mean expression for each group. We further compared the mRNA levels of MAT2A in tumorigenic hepatocytes by integrating uninjured hepatocytes (4,800 cells) from a separate dataset under accession code GSE17474865. RNA–seq data that support the findings of this study have been deposited in the Gene Expression Omnibus (GEO) under accession code GSE184065, the analyzed data is deposited in figshare (https://doi.org/10.6084/m9.figshare.22215361), and raw inage data files are deposited in figshare (10.6084/m9.figshare.24225508). The software and algorithms for data analyses used in this study are all well-established from previous work and are referenced throughout the manuscript. Source data for Fig. 1a,1c,1i,1j, 2a, 2g, 2j, 2l, 2n, 3c, 3g, 4c, 4d, 6b, 6d, 6f-h, 6j, and Extended Data Fig. 1a,1b,1e,1f, 2a, 3b, 3c, 4a-d, 4f, 4h, 5a, 5d-f, 5i, 5j, 6b, 7a, 8b, 8f, 8g, 9b-d, 9f, and 9g have been provided as Source Data files. All other data supporting the findings of this study are available from the corresponding author upon reasonable requests.
Reporting Summary.
Further information on research design is available in the Nature Research Reporting Summary linked to this article.
Code Availability.
No custom code was used in this study.
Extended Data
Extended Data Fig. 1. HCC cells undergo senescence upon methionine starvation.

a, Cell numbers of HepG2, PLC/PRF/5 and SNU449 cells with or without 72-hour methionine (Met) deprivation. b, Cell death quantification (Annexin V+%) of indicated HCC cells with or without 72-hour methionine (Met) deprivation. c, Western blot analysis of Huh7 cells with or without 72-hour methionine (Met) deprivation. Actin was used as a loading control. d, Representative crystal violet staining of control and methionine-deprived Huh7 and Hep3B cells replated in methionine-containing medium for 3-week clonogenicity assays. e, Quantification of cells with >2 53BP1 foci in control and methionine-deprived Huh7 and Hep3B cells. f, HepG2, PLC/PRF5 and SNU449 cell numbers when cultured in medium with or without homocysteine (Hcy, 100 μM). All statistical graphs show the mean ± s.e.m. P values were calculated using a two-tailed Student’s t-test. All experiments were performed in biological triplicate.
Extended Data Fig.2. MAT2A as a potential oncogene in HCC.

a, Quantification of DAB intensity of MAT2A IHC staining of liver sections from MycOE;Trp53KO (n=7 for AL, n=12 for tumor) orthotopic model and DEN (n=7 for AL, n=16 for tumor) model. AL: adjacent liver. Representative immunofluorescence images of Huh7-sgR26, Huh7-sgMAT2A-1 and Huh7-sgMAT2A-2 cells stained with 53BP1 (red), γH2AX (red) and DAPI (blue). Scale bar: 50 μm. b, The frequency and normalized UMI of MAT2A transcripts in 7,285 pro-tumorigenic hepatocytes as compared to 1497 non-malignant hepatocytes (left) or 4800 uninjured hepatocytes from healthy livers (Right) using public single cell RNA-seq data. The data was analyzed using the non-parametric Wilcoxon rank-sum test. c, GSEA plots of indicated gene sets based on MAT2A expression in 374 HCC patient samples from TCGA dataset. MAT2A-high : top 50%, n=187; MAT2A-low:bottom 50%, n=187.
Extended Data Fig.3. Genetic MAT2A inhibition induces DNA damage and promotes SASP gene expression.

a, Representative immunofluorescence images of Huh7-sgR26, Huh7-sgMAT2A-1 and Huh7-sgMAT2A-2 cells stained with 53BP1 (red), γH2AX (red) and DAPI (blue). Scale bar: 50 μm. b, Quantification of cells with >2 53BP1 foci in Huh7-sgR26, Huh7-sgMAT2A-1 and Huh7-sgMAT2A-2 cells. To quantify, 5 random fields containing at least 30 cells were counted and averaged. c, qRT-PCR analysis of indicated gene expression in Huh7-sgR26, Huh7-sgMAT2A-1 and Huh7-sgMAT2A-2 cells. Except a, all statistical graphs show the mean ± s.e.m. P values were calculated using a two-tailed Student’s t-test. All experiments were performed in biological triplicate.
Extended Data Fig.4. MAT2A inhibition by FIDAS-5 induces senescence in liver cancer cells.

a, Cell viabilities of Huh7 and Hep3B cells treated with indicated doses of FIDAS-5 for 72 hours. b, Huh7 and Hep3B cell growth curves in the presence of 1 μM FIDAS-5. c, Relative SAM and SAH abundance determined by LC-MS analysis of control and FIDAS-5 treated Huh7 cells for 72 hours. d, Cell death quantification (Annexin V+%) of Huh7 and Hep3B cells with or without 72-hour FIDAS-5 exposure (Hep3B:1 μM, Huh7: 5 μM). e, Representative immunofluorescence images of vehicle control and FIDAS-5-induced senescent (FIS) Huh7 cells stained with 53BP1 (red), γH2AX (red) and DAPI (blue). Scale bar: 50 μm. f, Quantification of cells with >2 53BP1 foci in control and FIS Huh7 cells. To quantify, 5 random fields containing at least 30 cells were counted and averaged. g, Representative crystal violet staining of control and FIS Huh7 cells replated in growth medium for 3-week clonogenicity assays. h, qRT-PCR analysis of indicated gene expression in control and FIS Huh7 cells. i, j, Representative SA-β-gal staining (i) and quantification (j) of vehicle control (Veh) and FIDAS-5 treated TOV21G cells. Scale bar: 100 μm. k, Mouse body weight curves over time in vehicle control (Veh, n=7) and FIDAS-5 (n=5) treatment groups. All statistical graphs show the mean ± s.e.m. P values were calculated using a two-tailed Student’s t-test. All experiments were performed in biological triplicate.
Extended Data Fig. 5. Characterization of early FIDAS-5 treated HCC cells.

a, Relative numbers of Huh7 cells cultured in growth medium with indicated ROS scavengers for 72 hours. b, Western blot analysis of indicated histone methylation marks in Huh7 cells treated with indicated concentration of FIDAS-5 for indicated time. H3 was used as loading control. c, d, Representative immunofluorescence images (c) and statistical analysis (d) of Veh and treatment-induced senescent Huh7 cells stained with H3K9Me3 antibody (green). To quantify in d, 10 random fields containing at least 80 cells were counted and averaged for the percentage of H3K9Me3+ nuclei. Scale bar: 50 μm. e, Relative gene expression by qRT-PCR analysis of FIDAS-5 and vehicle treated Huh7 and Hep3B cells for 48 hours. f, Quantification of cells with >2 53BP1 foci in FIDAS5-treated Huh7, Hep3B cells for indicated time. To quantify, 5 random fields containing at least 30 cells were counted and averaged. g, Western blot analysis of p21 and GAPDH from Huh7-sgR26, Huh7-sgP21–1, Huh7-sgP21–2 and Huh7-sgP21–3 cells. h, i, Representative SA-β-gal staining (h) and quantification (i) of Huh7 cells and FIDAS-5 treated Huh7-sgR26, Huh7-sgP21–1, Huh7-sgP21–2 and Huh7-sgP21–3 cells. Scale bar: 100 μm. g, Relative cell numbers of FIDAS-5 treated Huh7-sgR26, Huh7-sgP21–1 and Huh7-sgP21–2 cells. All statistic graphs except d show the mean ± s.e.m. P values were calculated using a two-tailed Student’s t-test. All experiments were performed in biological triplicate.
Extended Data Fig. 6. DNA damage in early decitabine-treated HCC cells.

a, Representative immunofluorescence images of vehicle control and 48-hour decitabine-treated Huh7 and Hep3B cells stained with 53BP1 (red), γH2AX (red) and DAPI (blue). The arrows indicate cytoplasmic DNA. Scale bar: 10 μm. b, Quantification of cells with >2 53BP1 foci or >2 γH2AX foci in decitabine-treated Huh7 and Hep3B cells for 48 h. To quantify, 5 random fields containing at least 30 cells were counted and averaged. c, Representative crystal violet staining of control and decitabine-induced senescent Huh7 cells replated in growth medium for 3-week clonogenicity assays. All statistical graphs show the mean ± s.e.m. P values were calculated using a two-tailed Student’s t-test. All experiments were performed in biological triplicate.
Extended Data Fig.7. GSK3 inhibition induces cell death in TIS liver cancer cells.

a, Relative cell numbers of Huh7 cells treated with different doses of BIO and CHIR99021 for 72 hours. b, Representative crystal violet staining of control and FIS Huh7 and Hep3B cells treated with indicated doses of CHIR98014 for 6 days. c, Representative crystal violet staining of vehicle control and TIS Huh7 cells treated with indicated doses of LY2090314 for 6 days. d, Representative crystal violet staining of Huh7-sgR26, Huh7-sgMAT2A-1 and Huh7-sgMAT2A-7 cells treated with 0.5 μM LY2090314 for 6 days. e, Representative crystal violet staining of Huh6 cells treated with indicated drug combinations for 6 days. All statistical graphs show the mean ± s.e.m. P values were calculated using a two-tailed Student’s t-test. All experiments were performed in biological triplicate.
Extended Data Fig.8. GSK3 maintains viability of TIS liver cancer cells.

a, Western blot analysis of GSK3A, GSK3B and GAPDH in lysates from control and FIS Huh7 cells with or without 48-hour LY2090314 treatment at indicated doses. b, Normalized TOP Flash and FOP Flash luciferase activity in control and FIS Huh7 cells. c, Subcellular fractionation and western blot analysis of indicated proteins in vehicle and FIS Huh7 cells. d, Kaplan–Meier overall survival plots stratified by GSK3A or GSK3B mRNA levels from HCC TCGA database. A log-rank Mantel–Cox test was performed between the groups. e, Western blot analysis of GSK3A, GSK3B and GAPDH in lysates from Huh7 cells expressing indicated sgRNAs. f, Cell growth curves of Huh7 cells expressing indicated sgRNAs. g, Cell death quantification (Annexin V+%) of Huh7 cells expressing indicated sgRNAs. h, Western blot analysis of GSK3A, GSK3B and GAPDH from Huh7 cells expressing indicated shRNAs. i, Representative crystal violet staining of Huh7-shCtrl, Huh7-shGSK3A/B-1 and Huh7-shGSK3A/B-2 cells with or without 0.5 μM LY2090314 treatment for 6 days. j, Flow cytometry plots of Annexin-V/PI apoptosis assay in Huh7 cells treated with indicated doses of LY2090314 for 72 hours. k, Western blot analysis of GSK3A, GSK3B and GAPDH from FIS Huh7 cells expressing indicated siRNAs. All statistical graphs show the mean ± s.e.m. P values were calculated using a two-tailed Student’s t-test. All experiments were performed in biological triplicate.
Extended Data Fig.9. Combined MAT2A and GSK3 inhibition limits liver tumor growth.
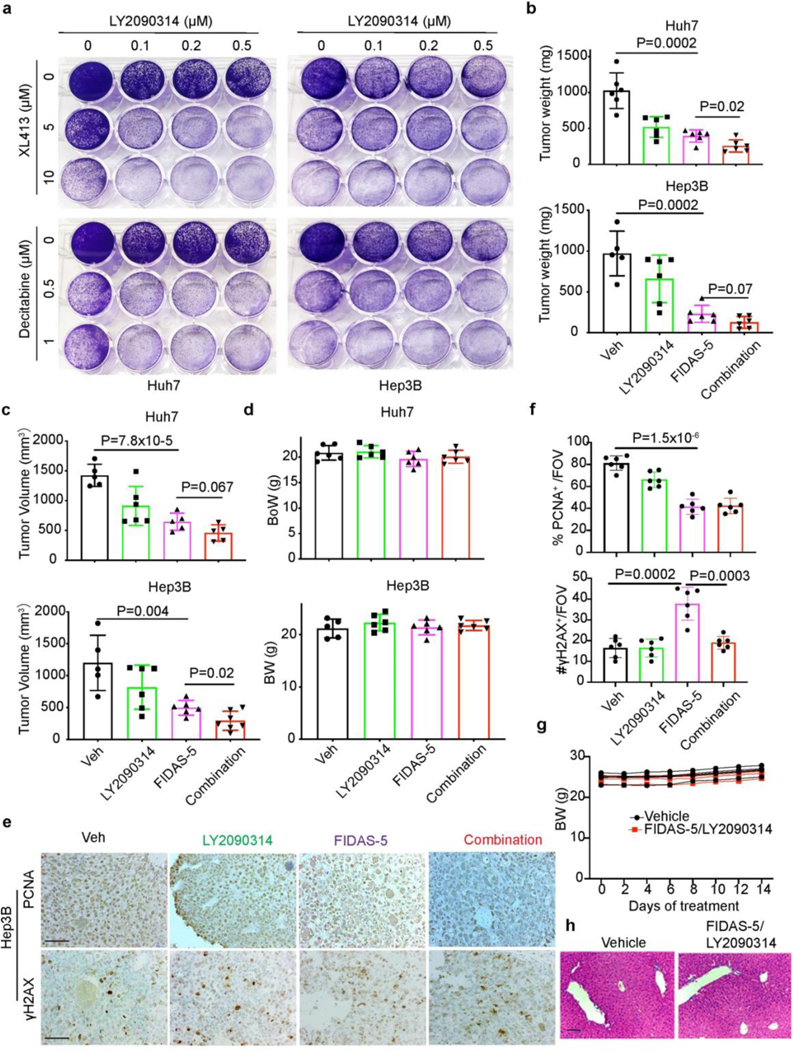
a, Representative crystal violet staining of Huh7 cells treated with indicated doses of drug combination for 12 days. b-d, Quantification of end point Huh7 and Hep3B xenograft tumor weight (b), volume (c) and mouse body weight (d) from vehicle control (Veh), FIDAS-5, LY2090314 and combined FIDAS-5/LY2090314 treatment groups. Huh7: n=6 for each group. Hep3B: n=5 for Veh, n=6 for FIDAS-5, n=6 for LY2090314, n=7 for combination group. e, f, Representative IHC images (e) and quantification (f) of PCNA and γH2AX staining in Hep3B xenograft tumor sections from indicated treatment groups. To quantify, 3–5 representative images with a ×200 FOV were used for quantification using Image J and averaged for each animal. Scale bar: 100 μm. g, Body weight change of vehicle control (n=5) and combined FIDAS-5/LY2090314 (n=5)-treated C57BL/6 mice. h, Representative HE staining of liver sections from vehicle and combined FIDAS-5/LY2090314-treated wild type mice. Scale bar: 100 μm. All statistic graphs show the mean ± s.e.m. P values were calculated using a two-tailed Student’s t-test. All experiments were performed in biological triplicate.
Supplementary Material
ACKNOWLEDGEMENTS
We thank the members of the Simon and Li laboratories for their helpful discussions and insights on the manuscript. We are grateful to J. Tobias for help with processing the human TCGA data, and to H. Ji and L. Hu for the critical reading of the manuscript. This work was supported by the National Key R&D Program of China (2022YFA1103900 to F.Li), the National Natural Science Foundation of China (82273223 to F.Li, 32270798 to P. Liu), and Shanghai Pujiang Program (21PJ1400800 to F. Li), and the National Institutes of Health grants P01CA104838 and R35CA197602 to M.C. Simon.
Financial support:
Listed in acknowledgements.
Footnotes
DECLARATION OF INTERESTS
The authors declare no potential conflicts of interest.
REFERENCES
- 1.Siegel RL, Miller KD, Fuchs HE & Jemal A. Cancer Statistics, 2021. CA Cancer J Clin 71, 7–33 (2021). [DOI] [PubMed] [Google Scholar]
- 2.Cancer Genome Atlas Research Network. Electronic address, w.b.e. & Cancer Genome Atlas Research, N. Comprehensive and Integrative Genomic Characterization of Hepatocellular Carcinoma. Cell 169, 1327–1341 e1323 (2017). [DOI] [PMC free article] [PubMed] [Google Scholar]
- 3.Finn RS et al. Atezolizumab plus Bevacizumab in Unresectable Hepatocellular Carcinoma. N Engl J Med 382, 1894–1905 (2020). [DOI] [PubMed] [Google Scholar]
- 4.Hanahan D. & Weinberg RA Hallmarks of cancer: the next generation. Cell 144, 646–674 (2011). [DOI] [PubMed] [Google Scholar]
- 5.DeBerardinis RJ & Chandel NS We need to talk about the Warburg effect. Nat Metab 2, 127–129 (2020). [DOI] [PubMed] [Google Scholar]
- 6.Faubert B, Solmonson A. & DeBerardinis RJ Metabolic reprogramming and cancer progression. Science 368 (2020). [DOI] [PMC free article] [PubMed] [Google Scholar]
- 7.Li F. & Simon MC Cancer Cells Donť Live Alone: Metabolic Communication within Tumor Microenvironments. Dev Cell 54, 183–195 (2020). [DOI] [PMC free article] [PubMed] [Google Scholar]
- 8.Anderson NM & Simon MC The tumor microenvironment. Curr Biol 30, R921–R925 (2020). [DOI] [PMC free article] [PubMed] [Google Scholar]
- 9.Lyssiotis CA & Kimmelman AC Metabolic Interactions in the Tumor Microenvironment. Trends Cell Biol 27, 863–875 (2017). [DOI] [PMC free article] [PubMed] [Google Scholar]
- 10.Satriano L, Lewinska M, Rodrigues PM, Banales JM & Andersen JB Metabolic rearrangements in primary liver cancers: cause and consequences. Nat Rev Gastroenterol Hepatol 16, 748–766 (2019). [DOI] [PubMed] [Google Scholar]
- 11.Missiaen R. et al. GCN2 inhibition sensitizes arginine-deprived hepatocellular carcinoma cells to senolytic treatment. Cell Metab 34, 1151–1167 e1157 (2022). [DOI] [PMC free article] [PubMed] [Google Scholar]
- 12.Li F. et al. FBP1 loss disrupts liver metabolism and promotes tumorigenesis through a hepatic stellate cell senescence secretome. Nat Cell Biol 22, 728–739 (2020). [DOI] [PMC free article] [PubMed] [Google Scholar]
- 13.Wang C. et al. Inducing and exploiting vulnerabilities for the treatment of liver cancer. Nature 574, 268–272 (2019). [DOI] [PMC free article] [PubMed] [Google Scholar]
- 14.Sanderson SM, Gao X, Dai Z. & Locasale JW Methionine metabolism in health and cancer: a nexus of diet and precision medicine. Nat Rev Cancer 19, 625–637 (2019). [DOI] [PubMed] [Google Scholar]
- 15.Ducker GS & Rabinowitz JD One-Carbon Metabolism in Health and Disease. Cell Metab 25, 27–42 (2017). [DOI] [PMC free article] [PubMed] [Google Scholar]
- 16.Wang Z. et al. Methionine is a metabolic dependency of tumor-initiating cells. Nat Med 25, 825–837 (2019). [DOI] [PubMed] [Google Scholar]
- 17.Fang L. et al. Methionine restriction promotes cGAS activation and chromatin untethering through demethylation to enhance antitumor immunity. Cancer Cell 41, 1118–1133 e1112 (2023). [DOI] [PubMed] [Google Scholar]
- 18.Gao X. et al. Dietary methionine influences therapy in mouse cancer models and alters human metabolism. Nature 572, 397–401 (2019). [DOI] [PMC free article] [PubMed] [Google Scholar]
- 19.Machado MV et al. Mouse models of diet-induced nonalcoholic steatohepatitis reproduce the heterogeneity of the human disease. PLoS One 10, e0127991 (2015). [DOI] [PMC free article] [PubMed] [Google Scholar]
- 20.Itagaki H, Shimizu K, Morikawa S, Ogawa K. & Ezaki T. Morphological and functional characterization of non-alcoholic fatty liver disease induced by a methionine-choline-deficient diet in C57BL/6 mice. Int J Clin Exp Pathol 6, 2683–2696 (2013). [PMC free article] [PubMed] [Google Scholar]
- 21.Ma C. et al. NAFLD causes selective CD4(+) T lymphocyte loss and promotes hepatocarcinogenesis. Nature 531, 253–257 (2016). [DOI] [PMC free article] [PubMed] [Google Scholar]
- 22.Campisi J. Aging, cellular senescence, and cancer. Annu Rev Physiol 75, 685–705 (2013). [DOI] [PMC free article] [PubMed] [Google Scholar]
- 23.Rodier F. et al. Persistent DNA damage signalling triggers senescence-associated inflammatory cytokine secretion. Nat Cell Biol 11, 973–979 (2009). [DOI] [PMC free article] [PubMed] [Google Scholar]
- 24.Campisi J. & d'Adda di Fagagna F. Cellular senescence: when bad things happen to good cells. Nat Rev Mol Cell Biol 8, 729–740 (2007). [DOI] [PubMed] [Google Scholar]
- 25.Li Z. et al. Methionine metabolism in chronic liver diseases: an update on molecular mechanism and therapeutic implication. Signal Transduct Target Ther 5, 280 (2020). [DOI] [PMC free article] [PubMed] [Google Scholar]
- 26.Frau M, Feo F. & Pascale RM Pleiotropic effects of methionine adenosyltransferases deregulation as determinants of liver cancer progression and prognosis. J Hepatol 59, 830–841 (2013). [DOI] [PubMed] [Google Scholar]
- 27.Cai J, Mao Z, Hwang JJ & Lu SC Differential expression of methionine adenosyltransferase genes influences the rate of growth of human hepatocellular carcinoma cells. Cancer Res 58, 1444–1450 (1998). [PubMed] [Google Scholar]
- 28.Martinez-Chantar ML et al. L-methionine availability regulates expression of the methionine adenosyltransferase 2A gene in human hepatocarcinoma cells: role of S-adenosylmethionine. J Biol Chem 278, 19885–19890 (2003). [DOI] [PubMed] [Google Scholar]
- 29.Jeggo PA, Pearl LH & Carr AM DNA repair, genome stability and cancer: a historical perspective. Nat Rev Cancer 16, 35–42 (2016). [DOI] [PubMed] [Google Scholar]
- 30.Lee S. & Schmitt CA The dynamic nature of senescence in cancer. Nat Cell Biol 21, 94–101 (2019). [DOI] [PubMed] [Google Scholar]
- 31.Zhang W. et al. Fluorinated N,N-dialkylaminostilbenes repress colon cancer by targeting methionine S-adenosyltransferase 2A. ACS Chem Biol 8, 796–803 (2013). [DOI] [PMC free article] [PubMed] [Google Scholar]
- 32.Li JT et al. Dietary folate drives methionine metabolism to promote cancer development by stabilizing MAT IIA. Signal Transduct Target Ther 7, 192 (2022). [DOI] [PMC free article] [PubMed] [Google Scholar]
- 33.Schmitt CA, Wang B. & Demaria M. Senescence and cancer - role and therapeutic opportunities. Nat Rev Clin Oncol 19, 619–636 (2022). [DOI] [PMC free article] [PubMed] [Google Scholar]
- 34.Narita M. et al. Rb-mediated heterochromatin formation and silencing of E2F target genes during cellular senescence. Cell 113, 703–716 (2003). [DOI] [PubMed] [Google Scholar]
- 35.Chen RZ, Pettersson U, Beard C, Jackson-Grusby L. & Jaenisch R. DNA hypomethylation leads to elevated mutation rates. Nature 395, 89–93 (1998). [DOI] [PubMed] [Google Scholar]
- 36.Sato T, Issa JJ & Kropf P. DNA Hypomethylating Drugs in Cancer Therapy. Cold Spring Harb Perspect Med 7 (2017). [DOI] [PMC free article] [PubMed] [Google Scholar]
- 37.Christman JK 5-Azacytidine and 5-aza-2'-deoxycytidine as inhibitors of DNA methylation: mechanistic studies and their implications for cancer therapy. Oncogene 21, 5483–5495 (2002). [DOI] [PubMed] [Google Scholar]
- 38.Leite de Oliveira R. & Bernards R. Anti-cancer therapy: senescence is the new black. EMBO J 37 (2018). [DOI] [PMC free article] [PubMed] [Google Scholar]
- 39.Kirkland JL & Tchkonia T. Cellular Senescence: A Translational Perspective. EBioMedicine 21, 21–28 (2017). [DOI] [PMC free article] [PubMed] [Google Scholar]
- 40.Toso A. et al. Enhancing chemotherapy efficacy in Pten-deficient prostate tumors by activating the senescence-associated antitumor immunity. Cell Rep 9, 75–89 (2014). [DOI] [PubMed] [Google Scholar]
- 41.Dorr JR et al. Synthetic lethal metabolic targeting of cellular senescence in cancer therapy. Nature 501, 421–425 (2013). [DOI] [PubMed] [Google Scholar]
- 42.Rizzieri DA et al. An open-label phase 2 study of glycogen synthase kinase-3 inhibitor LY2090314 in patients with acute leukemia. Leuk Lymphoma 57, 1800–1806 (2016). [DOI] [PubMed] [Google Scholar]
- 43.Beurel E, Grieco SF & Jope RS Glycogen synthase kinase-3 (GSK3): regulation, actions, and diseases. Pharmacol Ther 148, 114–131 (2015). [DOI] [PMC free article] [PubMed] [Google Scholar]
- 44.Milanovic M. et al. Senescence-associated reprogramming promotes cancer stemness. Nature 553, 96–100 (2018). [DOI] [PubMed] [Google Scholar]
- 45.Grassilli E. et al. Inhibition of GSK3B bypass drug resistance of p53-null colon carcinomas by enabling necroptosis in response to chemotherapy. Clin Cancer Res 19, 3820–3831 (2013). [DOI] [PubMed] [Google Scholar]
- 46.Yang J. et al. GSK-3beta promotes cell survival by modulating Bif-1-dependent autophagy and cell death. J Cell Sci 123, 861–870 (2010). [DOI] [PMC free article] [PubMed] [Google Scholar]
- 47.Galluzzi L. et al. Molecular mechanisms of cell death: recommendations of the Nomenclature Committee on Cell Death 2018. Cell Death Differ 25, 486–541 (2018). [DOI] [PMC free article] [PubMed] [Google Scholar]
- 48.Cabon L. et al. BID regulates AIF-mediated caspase-independent necroptosis by promoting BAX activation. Cell Death Differ 19, 245–256 (2012). [DOI] [PMC free article] [PubMed] [Google Scholar]
- 49.DeBerardinis RJ & Chandel NS Fundamentals of cancer metabolism. Sci Adv 2, e1600200 (2016). [DOI] [PMC free article] [PubMed] [Google Scholar]
- 50.DeBerardinis RJ, Lum JJ, Hatzivassiliou G. & Thompson CB The biology of cancer: metabolic reprogramming fuels cell growth and proliferation. Cell Metab 7, 11–20 (2008). [DOI] [PubMed] [Google Scholar]
- 51.Marjon K. et al. MTAP Deletions in Cancer Create Vulnerability to Targeting of the MAT2A/PRMT5/RIOK1 Axis. Cell Rep 15, 574–587 (2016). [DOI] [PubMed] [Google Scholar]
- 52.Kryukov GV et al. MTAP deletion confers enhanced dependency on the PRMT5 arginine methyltransferase in cancer cells. Science 351, 1214–1218 (2016). [DOI] [PMC free article] [PubMed] [Google Scholar]
- 53.Kalev P. et al. MAT2A Inhibition Blocks the Growth of MTAP-Deleted Cancer Cells by Reducing PRMT5-Dependent mRNA Splicing and Inducing DNA Damage. Cancer Cell 39, 209–224 e211 (2021). [DOI] [PubMed] [Google Scholar]
- 54.Mavrakis KJ et al. Disordered methionine metabolism in MTAP/CDKN2A-deleted cancers leads to dependence on PRMT5. Science 351, 1208–1213 (2016). [DOI] [PubMed] [Google Scholar]
- 55.Golbourn BJ et al. Loss of MAT2A compromises methionine metabolism and represents a vulnerability in H3K27M mutant glioma by modulating the epigenome. Nat Cancer 3, 629–648 (2022). [DOI] [PMC free article] [PubMed] [Google Scholar]
- 56.Chen HA et al. Senescence rewires microenvironment sensing to facilitate anti-tumor immunity. Cancer Discov (2022). [DOI] [PMC free article] [PubMed] [Google Scholar]
- 57.Marin I. et al. Cellular senescence is immunogenic and promotes anti-tumor immunity. Cancer Discov (2022). [DOI] [PMC free article] [PubMed] [Google Scholar]
- 58.Wang L. et al. High-Throughput Functional Genetic and Compound Screens Identify Targets for Senescence Induction in Cancer. Cell Rep 21, 773–783 (2017). [DOI] [PubMed] [Google Scholar]
- 59.Wang L. et al. cFLIP suppression and DR5 activation sensitize senescent cancer cells to senolysis. Nat Cancer 3, 1284–1299 (2022). [DOI] [PubMed] [Google Scholar]
- 60.Thorne CA et al. GSK-3 modulates cellular responses to a broad spectrum of kinase inhibitors. Nat Chem Biol 11, 58–63 (2015). [DOI] [PMC free article] [PubMed] [Google Scholar]
- 61.Agrawal S. et al. El-MAVEN: A Fast, Robust, and User-Friendly Mass Spectrometry Data Processing Engine for Metabolomics. Methods Mol Biol 1978, 301–321 (2019). [DOI] [PubMed] [Google Scholar]
- 62.Reiberger T. et al. An orthotopic mouse model of hepatocellular carcinoma with underlying liver cirrhosis. Nat Protoc 10, 1264–1274 (2015). [DOI] [PMC free article] [PubMed] [Google Scholar]
- 63.Subramanian A. et al. Gene set enrichment analysis: a knowledge-based approach for interpreting genome-wide expression profiles. Proc Natl Acad Sci U S A 102, 15545–15550 (2005). [DOI] [PMC free article] [PubMed] [Google Scholar]
- 64.Lu Y. et al. A single-cell atlas of the multicellular ecosystem of primary and metastatic hepatocellular carcinoma. Nat Commun 13, 4594 (2022). [DOI] [PMC free article] [PubMed] [Google Scholar]
- 65.Filliol A. et al. Opposing roles of hepatic stellate cell subpopulations in hepatocarcinogenesis. Nature 610, 356–365 (2022). [DOI] [PMC free article] [PubMed] [Google Scholar]
Associated Data
This section collects any data citations, data availability statements, or supplementary materials included in this article.
Supplementary Materials
Data Availability Statement
Human liver cancer data were derived from the TCGA Research Network: http://cancergenome.nih.gov/, and were downloaded and analyzed at the Molecular Profiling Facility at the University of Pennsylvania as previously12. For single cell RNA-seq data analysis, MAT2A transcript levels were compared between 1,497 non-malignant and 7,285 tumorigenic hepatocytes using published dataset under accession code GSE14961464. Expression and the percentage of cells in which gene expression was analyzed using the non-parametric Wilcoxon rank-sum test. Each point represents expression value of each single cell and the yellow dot represents the mean expression for each group. We further compared the mRNA levels of MAT2A in tumorigenic hepatocytes by integrating uninjured hepatocytes (4,800 cells) from a separate dataset under accession code GSE17474865. RNA–seq data that support the findings of this study have been deposited in the Gene Expression Omnibus (GEO) under accession code GSE184065, the analyzed data is deposited in figshare (https://doi.org/10.6084/m9.figshare.22215361), and raw inage data files are deposited in figshare (10.6084/m9.figshare.24225508). The software and algorithms for data analyses used in this study are all well-established from previous work and are referenced throughout the manuscript. Source data for Fig. 1a,1c,1i,1j, 2a, 2g, 2j, 2l, 2n, 3c, 3g, 4c, 4d, 6b, 6d, 6f-h, 6j, and Extended Data Fig. 1a,1b,1e,1f, 2a, 3b, 3c, 4a-d, 4f, 4h, 5a, 5d-f, 5i, 5j, 6b, 7a, 8b, 8f, 8g, 9b-d, 9f, and 9g have been provided as Source Data files. All other data supporting the findings of this study are available from the corresponding author upon reasonable requests.