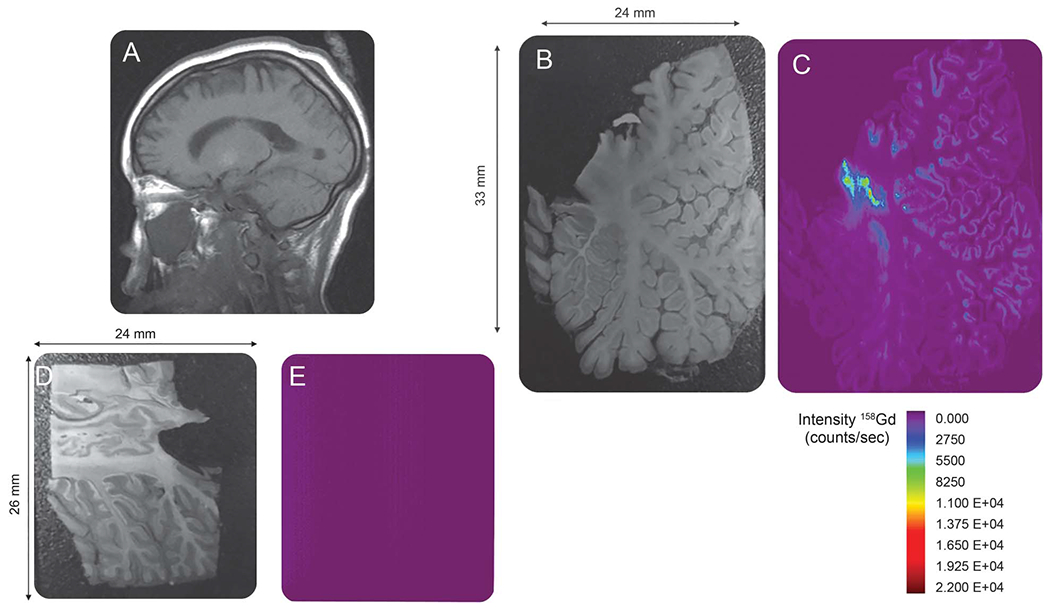
Figure. Distribution map of gadolinium deposition within the cerebellum.

(A) Sagittal image through the level of the dentate nucleus prior to the last dose of gadolinium-based contrast agent (GBCA). No hyperintense signal is demonstrated within the dentate nucleus. (Note that the globus pallidus demonstrates T1 shortening due to hypoxic ischemic injury.) (B) Autopsy section through the cerebellum. (C) Laser ablation inductively coupled plasma mass spectroscopy (LA-ICP-MS) gadolinium distribution map corresponding to the autopsy section in (B) demonstrates heavy deposition of gadolinium within the dentate nucleus. In addition, there is gadolinium deposition throughout the cerebellar cortex, particularly within the depths of the cerebellar folia. (D) Autopsy section through the cerebellum of the control patient not exposed to GBCA administration. (E) LA-ICP-MS gadolinium distribution map corresponding to the autopsy section in (D). The structure of the cerebellum is not seen and the signal intensity is equal to background as no gadolinium is detected in the control specimen.
