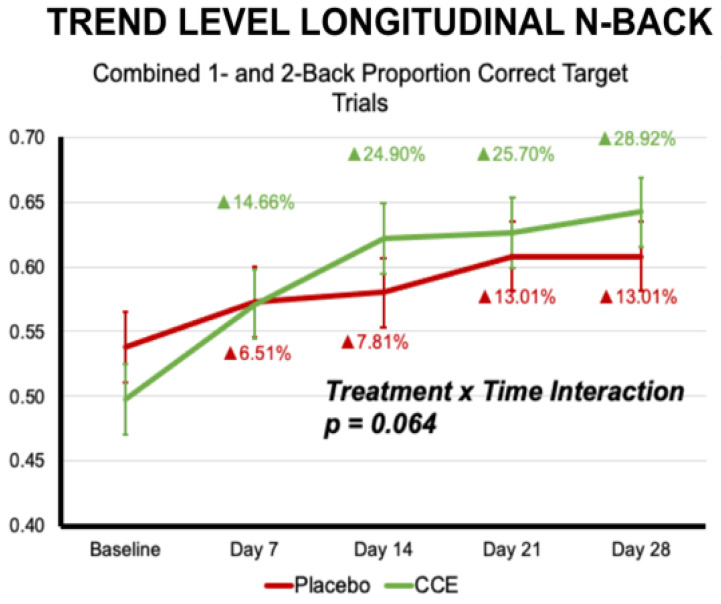
Figure 8.
Trend-level interaction effect from the longitudinal analysis of the n-back task suggesting that CCE and placebo groups demonstrated different trajectories over time. Specifically, CCE showed a more pronounced increase in proportion correct during the first two weeks and continued to improve, whereas placebo did not. Percentages indicated are calculated from baseline.

