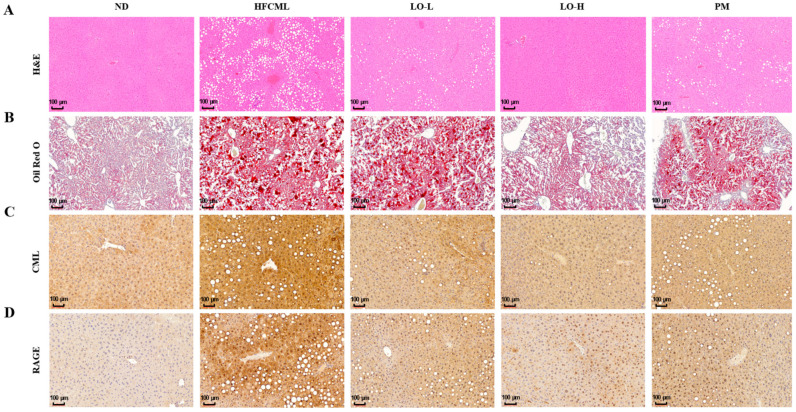
Figure 4.
Effect of LO on histological parameter in liver tissue of HFCML mice. Representative microscopic images of liver sections stained with hematoxylin and eosin ((A); magnification: 10×), ORO ((B); magnification: 10×), CML ((C); magnification: 10×) and RAGE ((D); magnification: 10×) in liver tissues. ND, normal diet; HFCML, high-fat diet and CML administration (10 mg/kg/p.o.); LO-L, HFCML + low dose of LO (100 mg/kg/p.o.); LO-H, HFCML + high dose of LO (200 mg/kg/p.o.); PM, HFCML + pyridoxamine (10 mg/kg/p.o.).

