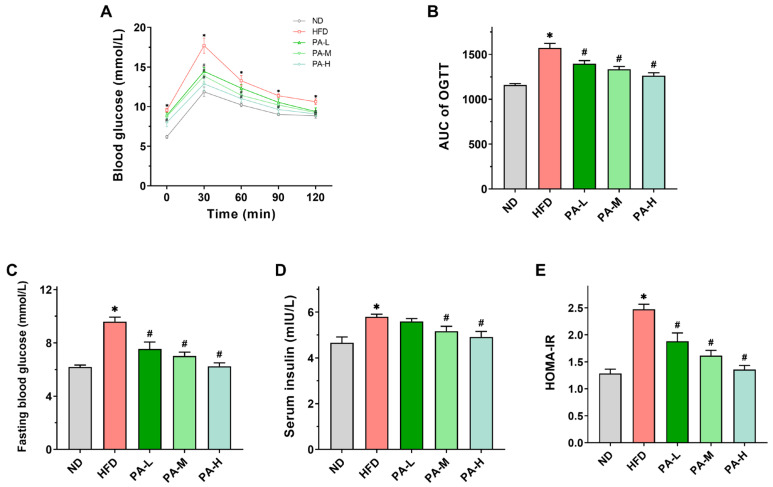
Figure 6.
Effects of PA on glucose metabolism in HFD-induced mice. (A) Blood glucose profile of OGTT at week 7. (B) AUC measured during OGTT. (C) Fasting blood glucose levels in mice. (D) Serum insulin levels in mice. (E) HOMA-IR index in mice. Results are expressed as mean ± SEM. n = 8 per group. * p < 0.05, HFD vs. ND; # p < 0.05, HFD vs. PA-L, PA-M, or PA-H.

