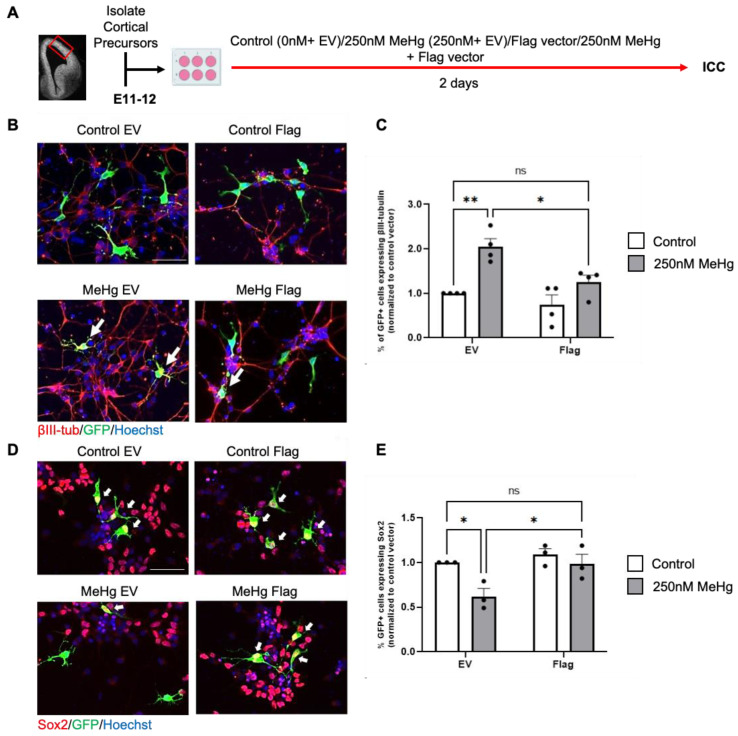
Figure 3.
Glo1 overexpression restores MeHg-induced premature neuronal differentiation. (A) Workflow for culturing E11–12 RGPs, created with BioRender.com. The red box indicates the region dissected to obtain RGPs. (B,D) Images of RGPs treated with (i) control (0 nM MeHg + GFP construct with EV plasmids), (ii) 250 nM MeHg + GFP construct with EV plasmids, (iii) 250 nM MeHg + GFP construct with Flag-Glo1 plasmids, and or iv) 250 nM MeHg + GFP construct with Flag-Glo1. GFP (green), βIII-tubulin (B, red) or Sox2 (D, red), and Hoechst (blue). White arrows indicated (B) βIII-tubulin+/GFP+ cells and (D) Sox2+/GFP+ cells. Scale bar: 50 μm. (C) Quantitative analysis of the percentage of GFP+/βIII-tubulin+ cells over total GFP+ cells, normalized to a control/EV, group, n = 4 independent experiments, Two-way ANOVA (transfection × Hg interaction F(1, 12) = 2.866, P = 0.1163, transfection F(1, 12) = 10.68, P = 0.0067, Hg F(1, 12) = 23.62, P = 0.0004). (E) Quantitative analysis of the percentage of GFP+/Sox2+ cells over total GFP+ cells, normalized to a control/EV group, n = 3 independent experiments, Two-way ANOVA (transfection × Hg interaction F(1, 8) = 3.147, P = 0.1140, transfection F(1, 8) = 9.605, P = 0.0147, Hg F(1, 8) = 8.326, P = 0.0203). post-hoc, * p < 0.05; ** p < 0.01. Error bars indicate the SEM.

