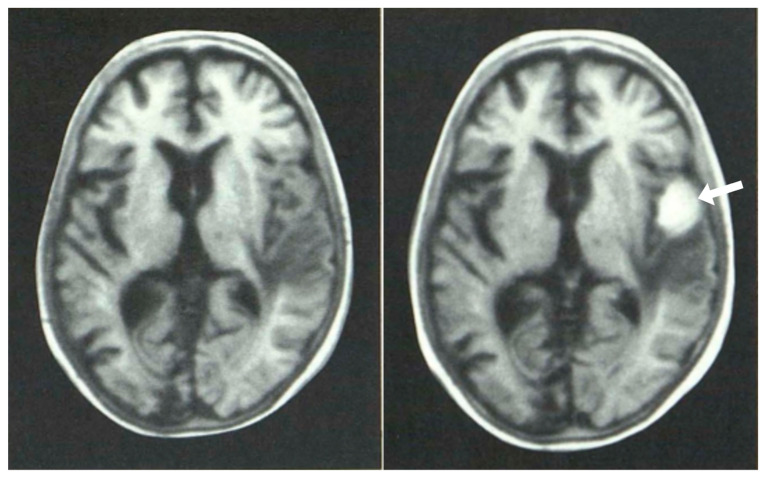
Figure 12.
Glioma: pre (left) and post (right) intravenous GBCA shown with inversion recovery (IR) images (March 1984) [14]. The glioma and edema have a low signal on pre-enhancement (left) images but the signal in the tumor is increased by the GBCA and is seen with high positive contrast (white arrow).

