Abstract
YEATS domain containing 2 (YEATS2), it may function as a proto-oncogene. This study aims to investigate if YEATS2 correlates with prognosis in hepatocellular carcinoma. The prognostic landscape of YEATS2 and its relationship with expression in hepatocellular carcinoma were deciphered with public databases, RT-qPCR and western-blot in tissue samples. The expression profiling and prognostic value of YEATS2 were explored using UALCAN, TIMER, OncoLnc database. Transcription and survival analyses of YEATS2 in hepatocellular carcinoma were investigated with cBioPortal database. The STRING database was explored to identify molecular functions and signaling pathways downstream of YEATS2. YEATS2 expression was significantly higher in hepatocellular carcinoma compared with adjacent non-malignant tissues. Promoter methylation of YEATS2 exhibited different patterns in hepatocellular carcinoma. High expression of YEATS2 was associated with poorer survival. Mechanistically, YEATS2 was involved in mediating multiple biological processes including morphogenesis and migration.
Keywords: YEATS2, Expression, Survival, Hub genes, Function
Subject terms: Computational biology and bioinformatics, Molecular biology, Biomarkers
Introduction
Hepatocellular carcinoma (HCC) is one of the most common malignancies and a leading cause of cancer-related mortality worldwide1. At present, the current situation is bleak for many patients with advanced HCC, as they often lack effective treatment options. The emergence of immune checkpoint inhibitors (ICIs) establishes immunotherapy as an effective treatment for hematological malignancies and solid tumors2. While generally safe, ICIs can cause immune-related adverse events (irAEs) that affect various organ systems3. Molecular classification based on oncogene mutation or abnormal expression provides new ideas for tumor research. This classification system has the potential to identify novel therapeutic targets, similar to the progress made in targeting EGFR or HER2 in lung and breast cancer4. Compared to traditional chemotherapy, it often leads to better survival rates and reduced side effects5. Successful targeted therapy largely depends on specific biomarkers, but there is still a lack of specific targets for targeted therapy of HCC6.
The human body harbors four major classes of YEATS domain-containing genes, namely YEATS4, MELL1, MELL3, and YEATS27,8. These genes encode proteins that are associated with complexes involved in chromosomal functions. For instance, they actively participate in the formation of histone acetyltransferase (HAT) complex and chromatin remodeling complex, thereby mediating epigenetic modification related signaling pathways9,10. YEATS2 was first identified as a clone from a fetal brain cDNA library by NAGASE et al. who initially named it KIAA1197. YEATS2 gene encodes the scaffold subunit of Ada-two-A-containing (ATAC) complex, which is an important component of HATs complex and plays an important role in histone acetylation recognition7. However, YEATS2 is rarely reported in tumors, and it is only reported that it may function as a proto-oncogene in non-small cell lung cancer. In non-small cell lung cancer, YEATS2 is highly amplified, and YEATS2 knockdown can inhibit tumor cell growth, proliferation and metastasis11. However, the expression of YEATS2 in HCC and its biological function remain largely unknown. The aim of this study is to detect the expression of YEATS2 in HCC tissues and analyze its relationship with prognosis, in order to find a new target for the treatment of HCC.
Materials and methods
Tissue samples
Patients admitted to the Liaocheng People’s hospital between January and September 2022, diagnosed with HCC and having complete follow-up data, were included in the study. All patients were excluded from having any prior or concurrent malignancies or a history of other liver diseases. Additionally, they had not undergone any anti-tumor treatments, including radiotherapy or chemotherapy, prior to their surgical procedure. A total of 16 tumor tissues, histologically confirmed as HCC, and matched normal tissues taken from areas more than 6 cm away from the tumor margin were collected from these patients. Tissues were preserved at − 80 °C. The study was conducted in accordance with the Declaration of Helsinki and was approved by The Ethical Committee of Liaocheng People’s Hospital and each patient provided informed consent.
Expression of YEATS2 in HCC by the database
The UALCAN database (http://ualcan.path.uab.edu)12, a reliable resource, provided detailed information on the expression level of YEATS2 and associated clinicopathological features in Hepatocellular Carcinoma (HCC). Additionally, the tumor immune estimation resource (TIMER) database (https://cistrome.shinyapps.io/timer/)13 was utilized to evaluate the expression level of YEATS2 in HCC, offering further insights into its role in the disease.
Quantitative real-time polymerase chain reaction (RT-qPCR)
Total RNA was extracted from HCC and adjacent tissues utilizing the FastPure Cell/Tissue Total RNA Isolation Kit, adhering strictly to the manufacturer’s protocol. The quality of RNA was confirmed by a ratio of A260/280 between 1.8 and 2.0. cDNA synthesis was then performed using the Superscript III RT kit, followed by qPCR analysis employing a RT-qPCR SYBR kit. Each experiment was replicated three times to ensure reproducibility. The specific primer sequences for YEAST2 were utilized as forward and reverse primers: forward primer, 5′-AGAACAGCGGAATGATCT-3′; reverse primer, 5′-CCATCCACTTATGAGTTGACTGC-3′. GAPDH served as the internal control gene for normalization. Finally, the relative expression levels of YEAST2 were calculated using the 2−ΔΔCT method.
Western blotting
Fresh tissue samples were collected and proteins were extracted in RIPA buffer (P0013B, Beyotime Biotechnology) containing 1 mM PMSF (ST506, Beyotime Biotechnology) and 1 X protease inhibitor mixture (P1010, Beyotime Biotechnology). Subsequently, the extracted protein content was accurately determined by the BCA (P0010, Beyotime Biotechnology) method. PVDF membranes were incubated with specific primary antibodies, anti-human YEATS2 (1:1000 dilution; PA5-36,939, Invitrogen) and anti-β-actin (1:2000 dilution; TA-09, ZSGB-BIO), overnight at 4 °C to ensure adequate binding. The next day, membranes were washed three times with 0.5% TBST for 5 min each to remove unbound primary antibodies. Immediately thereafter, the membrane was incubated with HRP-bound secondary antibody (1:5000 dilutions; ZB2305, CST) for 2 h at 25 °C to enhance the signal. Protein signals on the membrane were detected by chemiluminescence and images were analyzed using ImageJ software for subsequent statistical processing.
Survival analysis
The Database for OncoLnc database (http://www.oncolnc.org)14 included 364 samples was used to perform Kaplan plot for YEATS2 in HCC.
Methylation of YEATS2 promoter in clinicopathological context
Methylation levels of the YEATS2 gene in HCC samples were analyzed to assess its role in tumorigenesis and progression. Using the UALCAN database, we compared methylation status across sample types, cancer stages, tumor grades, and nodal metastasis status.
RNA-sequencing data
RNA-seq data encompassing 374 HCC cases were retrieved from the Cancer Genome Atlas (TCGA) databases (https://cancergenome.nih.gov/)15 For subsequent analysis, the level 3 HTSeq-FPKM formatted data were converted to TPM formats. The area under the curve AUC of YEATS2 was examined to assess its potential as a biomarker for distinguishing tumor from surrounding tissues. The analyses were performed using R software. Analyses were done using R software.
Screening co-expressed genes and identification of DEGs
Co-expressed genes of YEATS2 in HCC-tumor and HCC-normal were collected from cBioPortal (http://www.cbioportal.org)16, UALCAN and Coexpedia (https://www.coexpedia.org)17. Subsequently, GEPIA database (http://gepia.cancer-pku.cn)18 was utilized to screen differentially expressed genes (DEGs) between HCC and non-cancerous samples with | Log2FC (fold change) |> 1 and P-value < 0.01.
Enrichment analysis and pathway annotation
The enrichment of functions and signaling pathways of DEGs were analyzed using The Database for Annotation, Visualization and Integrated Discovery v6.8 (DAVID). The GO analysis, including biological process (BP), molecular function (MF), and cellular component (CC), was used to annotate genes and gene products, and also identify characteristic biological attributing to genomic or transcriptomic data.
Construct PPI network
The protein–protein interaction (PPI) network was predicted using STRING database (http://www.string-db.org)19. The PPI network was drawn using Cytoscape and the rank of the degree of gene connectivity using the cytohubba plugin molecular of Cytoscape. In addition, the Molecular Complex Detection (MCODE) app was utilized to screen modules of the PPI network in Cytoscape. The criteria for selection were as follows: MCODE scores > 5, degree cut-off = 2, node score cut-off = 0.2, Max depth = 100 and k-score = 2.
Obtain and analyze hub genes
The hub genes were selected with top nodes ranked by degree. Hierarchical clustering of hub genes was constructed using UCSC Cancer Genomics Browser (http://genome-cancer.ucsc.edu)20. The Database for OncoLnc database was used to draw Kaplan plot for hub genes in HCC, and P < 0.05 was considered statistically significant.
Statistical analysis
Wilcoxon test compared YEATS2 expression across cancers. Kaplan–Meier plotted survival curves, with log rank test for accuracy. Cox regression calculated HR, CI, and P values in PrognoScan. Spearman’s coefficient analyzed gene expression correlation. The paired T-test was utilized to detect significant differences within the paired data, ensuring a rigorous statistical comparison. ROC curve determined optimal YEATS2 expression cut-off for “high” vs. “low” expression using MedCalc in R 4.0.2(https://www.r-project.org/). P < 0.05 was considered statistically significant.
Results
Expression of YEATS2 in HCC by the database
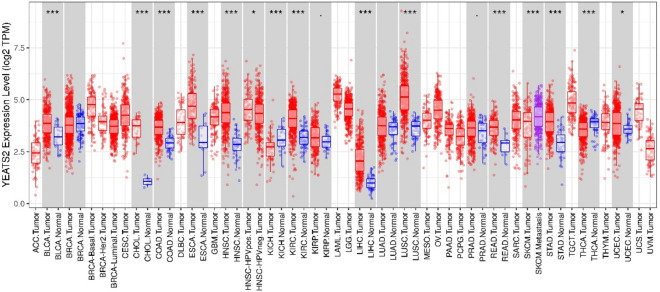
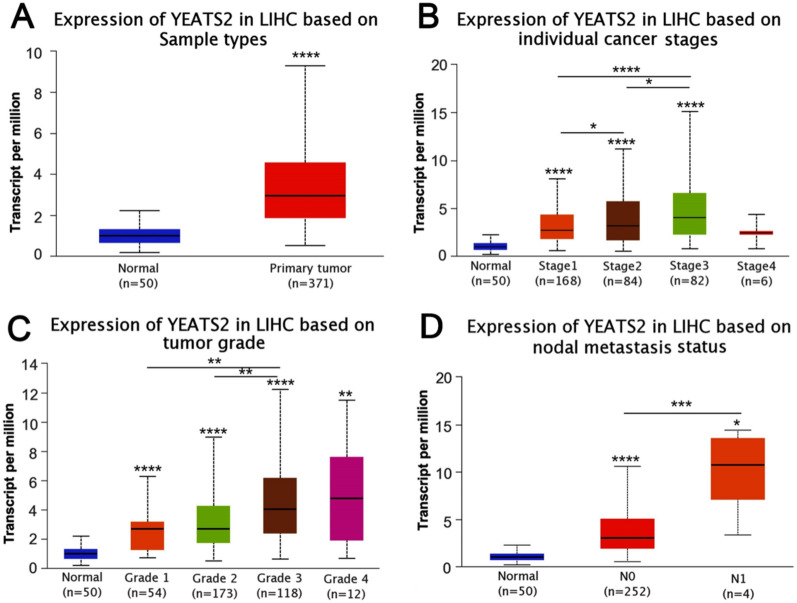
The obtained results of this study demonstrated that HCC tissues had an elevated level of YEATS2 expression compared with healthy tissues (Figs. 1, and 2A).
Figure 1.
YEATS2 expression levels in different tumor types. YEATS2 expression levels in different tumor types from TCGA database were determined by TIMER (*P < 0.05, **P < 0.01, ***P < 0.001).
Figure 2.
YEATS2 expression and clinicopathological features of Liver hepatocellular carcinoma. (A) sample types, (B) cancer stages, (C) tumor grades, (D) lymph node status (*P < 0.05, **P < 0.01, ***P < 0.001, ****P < 0.0001).
In HCC, the expression level of YEATS2 exhibits notable variations across different cancer stages. In comparison to healthy tissues, the expression of YEATS2 increases progressively throughout the first three stages, culminating in its peak expression level in the third stage (Fig. 2B). YEATS2 expression was consistently upregulated across all three grades, surpassing the levels found in healthy tissues. (Fig. 2C). Additionally, the stages of lymph node involvement displayed significantly elevated levels of YEATS2 expression compared to healthy tissues (Fig. 2D).
The characteristics of patients were shown in Table 1, in which 374 HCC with both clinical and gene expression data were collected from TCGA database. According to the mean value of relative YEATS2 expression, the patients with hepatocellular carcinoma were divided into low (n = 187) and high (n = 187) expression groups. The association between the expression level of YEATS2 and the clinicopathological characteristics of hepatocellular carcinoma patients was evaluated. Chi-square test revealed that YEATS2 expression was associated with T stage (P = 0.03), Histological grade (P < 0.001), Pathologic stage (P = 0.019), tumor status (P = 0.036) and age (P = 0.008). No significant correlation was found between YEATS2 expression and other clinicopathological factors, including N stage (P = 0.623), M stage (P = 0.622) and adjacent hepatic tissue inflammation (P = 0.737). The ROC curve was employed to assess the efficacy of YEATS2 mRNA expression level AUC in discriminating HCC tissues from non-tumor tissues. Notably, the AUC of YEATS2 attained a value of 0.927(Fig. 3), indicating its strong potential as a biomarker for distinguishing HCC from non-tumor tissue.
Table 1.
Correlation between YEATS2 expression and clinicopathological characteristics of HCC patients.
| Characteristic | Low expression of YEATS2 | High expression of YEATS2 | p |
|---|---|---|---|
| n | 187 | 187 | |
| T stage, n (%) | 0.032 | ||
| T1 | 105 (28.3%) | 78 (21%) | |
| T2 | 40 (10.8%) | 55 (14.8%) | |
| T3 | 34 (9.2%) | 46 (12.4%) | |
| T4 | 5 (1.3%) | 8 (2.2%) | |
| N stage, n (%) | 0.623 | ||
| N0 | 123 (47.7%) | 131 (50.8%) | |
| N1 | 1 (0.4%) | 3 (1.2%) | |
| M stage, n (%) | 0.622 | ||
| M0 | 134 (49.3%) | 134 (49.3%) | |
| M1 | 3 (1.1%) | 1 (0.4%) | |
| Pathologic stage, n (%) | 0.019 | ||
| Stage I | 98 (28%) | 75 (21.4%) | |
| Stage II | 38 (10.9%) | 49 (14%) | |
| Stage III | 34 (9.7%) | 51 (14.6%) | |
| Stage IV | 4 (1.1%) | 1 (0.3%) | |
| Tumor status, n (%) | 0.036 | ||
| Tumor free | 111 (31.3%) | 91 (25.6%) | |
| With tumor | 66 (18.6%) | 87 (24.5%) | |
| Histologic grade, n (%) | < 0.001 | ||
| G1 | 38 (10.3%) | 17 (4.6%) | |
| G2 | 104 (28.2%) | 74 (20.1%) | |
| G3 | 39 (10.6%) | 85 (23%) | |
| G4 | 4 (1.1%) | 8 (2.2%) | |
| Adjacent hepatic tissue inflammation, n (%) | 0.737 | ||
| None | 64 (27%) | 54 (22.8%) | |
| Mild | 52 (21.9%) | 49 (20.7%) | |
| Severe | 11 (4.6%) | 7 (3%) | |
| Age, meidan (IQR) | 64 (54.5, 69) | 59 (51, 67) | 0.008 |
Figure 3.
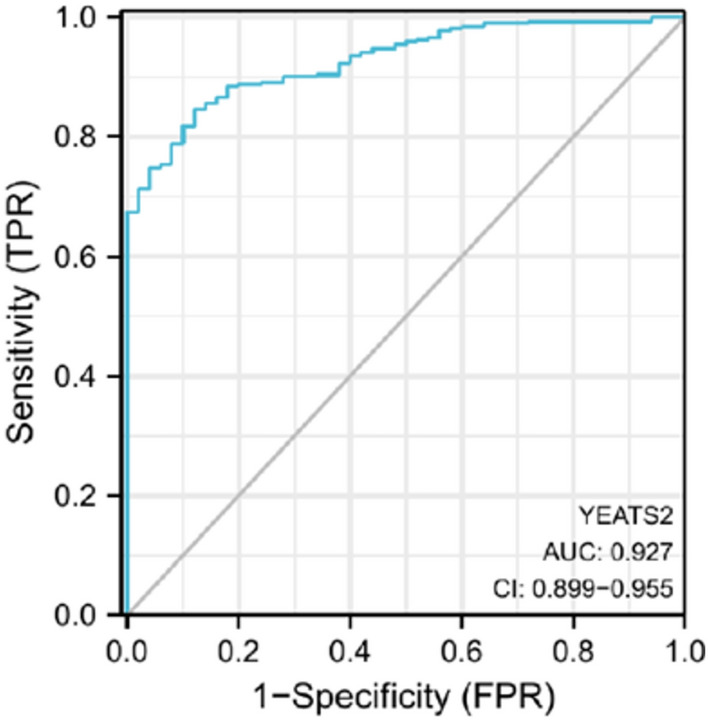
ROC curve established efficiency of YEATS2 mRNA expression level on distinguishing HCC tumor from non-tumor tissue. X-axis represents false positive rate, and Y-axis represents true positive rate.
Expression of YEATS2 in HCC by RT-qPCR and western blotting
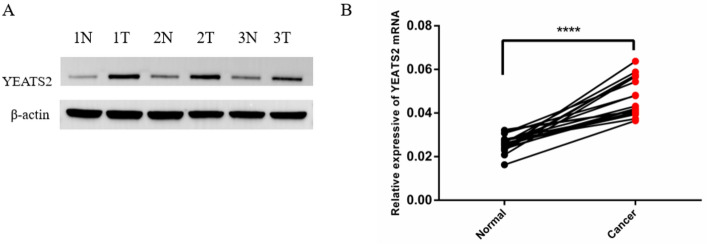
To comprehend the function of YEATS2 expression in HCC patients, 16 pairs of HCC tumor tissues and surrounding healthy tissues were examined by RT-qPCR. The expression of YEATS2 mRNA in tumor tissues was observed to be higher than in the adjacent healthy tissues (P < 0.0001) (Fig. 4B). Subsequently, YEATS2 protein expression was evaluated using western blotting (WB) in three random pairs of cancerous and healthy tissues. As presented in Fig. 4A and Figure S1 in supplementary file, YEATS2 protein expression was higher in YEATS2 tissues than in the surrounding healthy tissues.
Figure 4.
Expression of YEATS2 in HCC tissues. (A) The expression of YEATS2 in 3 paired HCC detected by Western blot, data was normalized by β-actin; (B) The expression of YEATS2 mRNA in 16 paired HCC detected by Real-time PCR.
Survival of patients with HCC based on YEATS2 expression
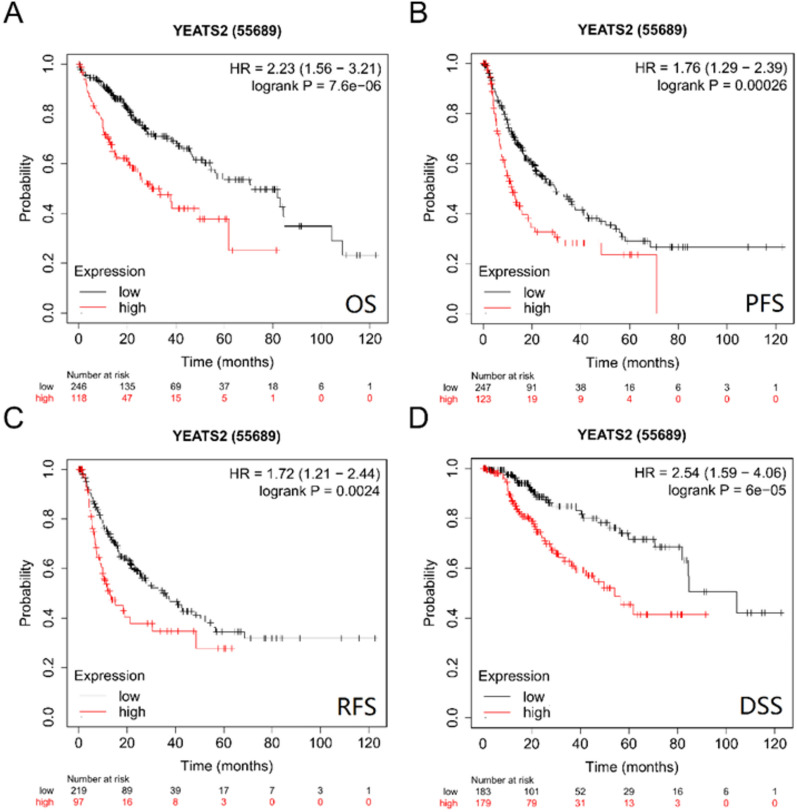
Subsequently, survival analysis based on YEATS2 expression was performed using the OncoLnc database. According to the obtained results, patients having an elevated expression of YEATS2 displayed poor overall survival. Notably, YEATS2 significantly correlates with clinical outcome of HCC patients, including overall survival (OS), relapse-free survival (RFS), Progression Free Survival (PFS) and Disease specific Survival (DSS) (Fig. 5A–D, OS: HR (95% CI) 2.23 (1.56–3.21), P = 7.6e−06; RFS: HR (95% CI) 1.72 (1.21–2.44), P = 0.0024.; PFS: HR (95% CI) 1.76 (1.29–2.39), P = 0.00026; DSS: HR (95% CI): 2.54(1.59–4.06), P = 6e−05 respectively). Therefore, it is conceivable that high YEATS2 expression might be a risk factor for a poor prognosis in HCC patients.
Figure 5.
Survival analysis for YEATS2 in HCC. (A) The OS curves of HCC patients with high and low expression of YEATS2; (B) The DFS curves of HCC patients with high and low expression of YEATS2; (C) The RFS curves of HCC patients with high and low expression of YEATS2; (D) The DSS curves of HCC patients with high and low expression of YEATS2.
Relationships between YEATS2 promoter methylation and clinicopathological characteristics
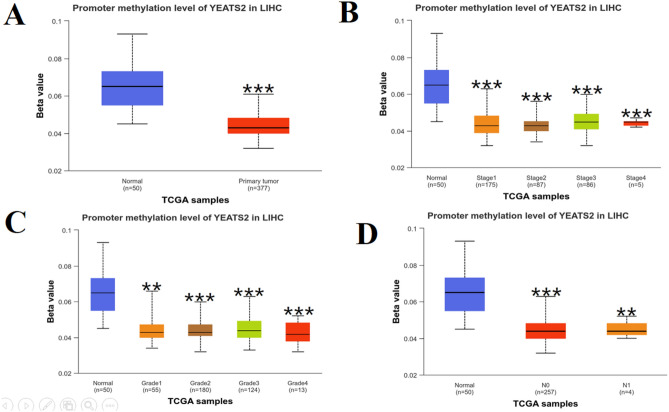
Using UALCAN database, we explored if promoter methylation of YEATS2 was related to clinicopathological characteristics of HCC patients. YEATS2 promoter methylation level was significantly lower in primary tumor than in normal tissue (P < 0.001, Fig. 6A). Based on clinical stages, stage 1, stage 2 and stage 3 had higher levels of YEATS2 promoter methylation than stage 4 (Fig. 6B). However, there were no significant differences in the levels of promoter methylation of YEATS2 between N0 and N1 stages, which was consistent across various tumor grades (Fig. 6C,D). This suggests that aberrant DNA methylation may play a role in the development and progression of HCC.
Figure 6.
UALCAN analysis of YEATS2 promoter methylation in HCC. The level of YEATS2 promoter methylation in HCC was compared based on different sample types (A), individual cancer stages (B), Tumor grade (C), nodal metastasis status (D).
Identification of DEGs in HCC
As shown in Venn (Fig. 7), 500 genes were obtained from cBioPortal, 522 from UALCAN, and 92 co-expressed genes from Coexpedia, respectively, and the overlapping genes were DVL3, ACTL6A, PLXNA1, ABCC5, and ILF3. A total of 83 co-expression of DEGs between HCC-normal and HCC-tumor were detected by GEPIA analysis, including 28 downregulated DEGs and 55 upregulated DEGs.
Figure 7.
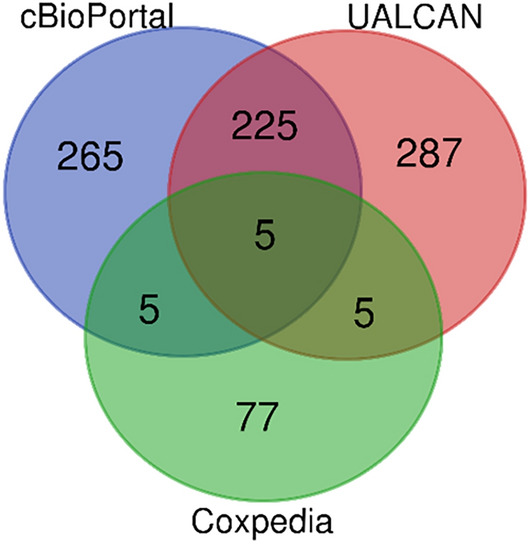
Venn of YEATS2 co-expressed genes.
GO function and KEGG pathway analysis of DEGs
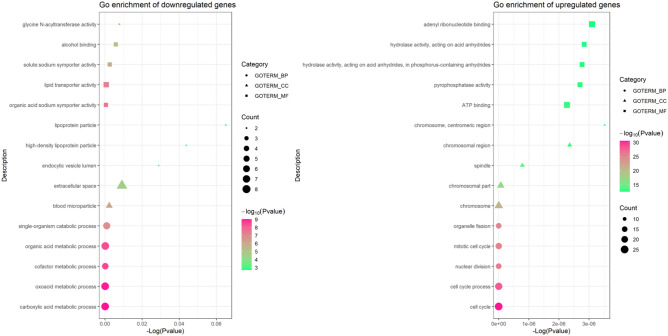
To analyze the biological classification of DEGs, functional and pathway enrichment analyses were performed using DAVID. The most enriched terms of downregulated and upregulated DEGs were selected in Table 2 (Fig. 8), according to the P-values. The DEGs were mainly enriched in BP, including carboxylic acid metabolic process, oxoacid metabolic process, cofactor metabolic process, organic acid metabolic process, and single-organism catabolic process for downregulated DEGs, and for upregulated DEGs including cell cycle, cell cycle process, nuclear division, mitotic cell cycle and organelle fission. In CC, the downregulated DEGs were particularly enriched in blood microparticle, extracellular space, endocytic vesicle lumen, high-density lipoprotein particle, and lipoprotein particle, and upregulated DEGs were mainly enriched in chromosome, chromosomal part, spindle, chromosomal region, and chromosome, centromeric region. In addition, the MF analysis also displayed that the downregulated DEGs were significantly enriched in organic acid, sodium symporter activity, lipid transporter activity, solute: sodium symporter activity, alcohol binding, and glycine N-acyltransferase activity, and the upregulated DEGs including ATP binding, pyrophosphatase activity, hydrolase activity, acting on acid anhydrides, in phosphorus-containing anhydrides, hydrolase activity, acting on acid anhydrides and adenyl ribonucleotide binding. KEGG pathway analysis revealed that the downregulated DEGs were mainly enriched in tyrosine metabolism, PPAR signaling pathway, metabolic pathways and primary bile acid biosynthesis, while the upregulated DEGs were mainly enriched in mismatch repair and cell cycle (Table 3).
Table 2.
GO analysis of DEGs in HCC samples.
| Expression | Category | Term | Pathway | Count | P-value |
|---|---|---|---|---|---|
| Downregulated | GOTERM_BP | GO:0,019,752 | Carboxylic acid metabolic process | 8 | 0.000119 |
| GOTERM_BP | GO:0,043,436 | Oxoacid metabolic process | 8 | 0.000123 | |
| GOTERM_BP | GO:0,051,186 | Cofactor metabolic process | 6 | 0.00019 | |
| GOTERM_BP | GO:0,006,082 | Organic acid metabolic process | 8 | 0.000213 | |
| GOTERM_BP | GO:0,044,712 | Single-organism catabolic process | 7 | 0.000978 | |
| GOTERM_CC | GO:0,072,562 | Blood microparticle | 4 | 0.002264 | |
| GOTERM_CC | GO:0,005,615 | Extracellular space | 8 | 0.009116 | |
| GOTERM_CC | GO:0,071,682 | Endocytic vesicle lumen | 2 | 0.028872 | |
| GOTERM_CC | GO:0,034,364 | High-density lipoprotein particle | 2 | 0.043832 | |
| GOTERM_CC | GO:1,990,777 | Lipoprotein particle | 2 | 0.06505 | |
| GOTERM_MF | GO:0,005,343 | Organic acid:sodium symporter activity | 3 | 0.000522 | |
| GOTERM_MF | GO:0,005,319 | Lipid transporter activity | 4 | 0.000668 | |
| GOTERM_MF | GO:0,015,370 | Solute:sodium symporter activity | 3 | 0.002592 | |
| GOTERM_MF | GO:0,043,178 | Alcohol binding | 3 | 0.005814 | |
| Upregulated | GOTERM_BP | GO:0,007,049 | Cell cycle | 27 | 5.46281E−14 |
| GOTERM_BP | GO:0,022,402 | Cell cycle process | 24 | 5.56823E−13 | |
| GOTERM_BP | GO:0,000,280 | Nuclear division | 17 | 4.77487E−12 | |
| GOTERM_BP | GO:0,000,278 | Mitotic cell cycle | 20 | 1.00515E−11 | |
| GOTERM_BP | GO:0,048,285 | Organelle fission | 17 | 1.26476E−11 | |
| GOTERM_CC | GO:0,005,694 | Chromosome | 19 | 8.00975E−10 | |
| GOTERM_CC | GO:0,044,427 | Chromosomal part | 16 | 6.50626E−08 | |
| GOTERM_CC | GO:0,005,819 | Spindle | 10 | 7.84562E−07 | |
| GOTERM_CC | GO:0,098,687 | Chromosomal region | 10 | 2.354E−06 | |
| GOTERM_CC | GO:0,000,775 | Chromosome, centromeric region | 8 | 3.51466E−06 | |
| GOTERM_MF | GO:0,005,524 | ATP binding | 17 | 2.26573E−06 | |
| GOTERM_MF | GO:0,016,462 | Pyrophosphatase activity | 13 | 2.70007E−06 | |
| GOTERM_MF | GO:0,016,818 | Hydrolase activity, acting on acid anhydrides, in phosphorus-containing anhydrides | 13 | 2.76894E−06 | |
| GOTERM_MF | GO:0,016,817 | Hydrolase activity, acting on acid anhydrides | 13 | 2.83937E−06 | |
| GOTERM_MF | GO:0,032,559 | Adenyl ribonucleotide binding | 17 | 3.09998E−06 |
GO gene ontology, BP biological process, CC cell component, MF molecular function.
Figure 8.
GO function analysis of DEGs.
Table 3.
KEGG analysis of DEGs in HCC samples.
| Expression | Category | Term | Pathway | Count | P-value |
|---|---|---|---|---|---|
| Downregulated | KEGG_PATHWAY | hsa00350 | Tyrosine metabolism | 3 | 0.001103 |
| KEGG_PATHWAY | hsa03320 | PPAR signaling pathway | 3 | 0.003999 | |
| KEGG_PATHWAY | hsa01100 | Metabolic pathways | 6 | 0.019902 | |
| KEGG_PATHWAY | hsa00120 | Primary bile acid biosynthesis | 2 | 0.024456 | |
| Upregulated | KEGG_PATHWAY | hsa03430 | Mismatch repair | 3 | 0.001959 |
| KEGG_PATHWAY | hsa04110 | Cell cycle | 4 | 0.005209 | |
| KEGG_PATHWAY | hsa03030 | DNA replication | 2 | 0.099754 |
KEGG Kyoto Encyclopedia of Genes and Genomes.
PPI network construction and hub gene selection
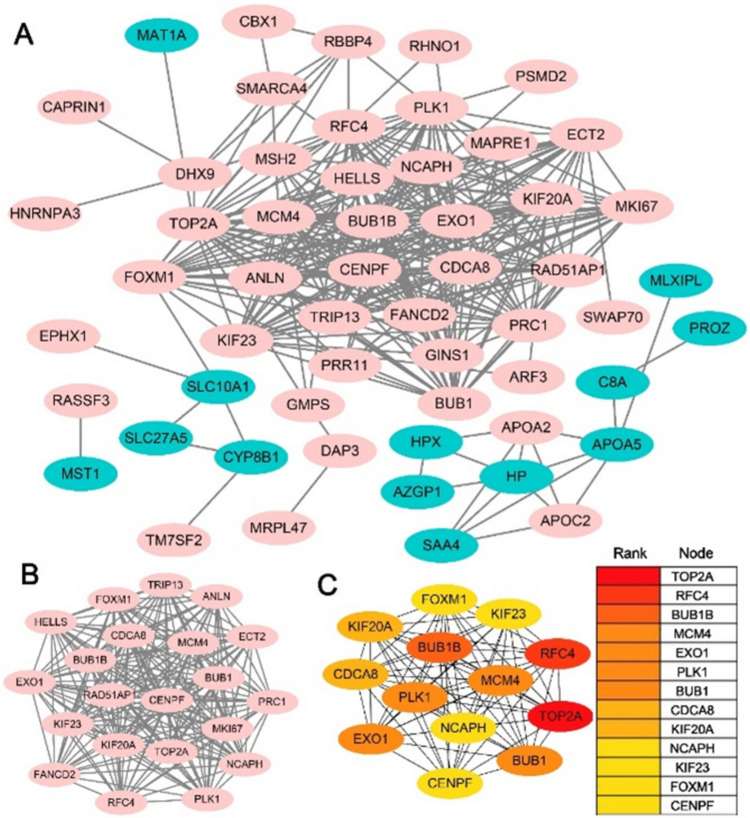
Based on the information in the STRING protein relationship, we made the PPI network of the co-expressed DEGs (Fig. 9A). The most module of DEGs was shown by using the MCODE plug-in (Fig. 9B). Top 13 nodes ranked by degree were identified as hub genes and shown by using the cytohubba plugin molecular (Fig. 9C).
Figure 9.
PPI network of the YEATS2-correlated genes. (A) PPI network of the co-expression DEGs. Upregulated genes are marked in light pink; downregulated genes are marked in light green. (B) The most module of DEGs. (C) Top 13 nodes ranked of degree represented by different degrees of color (from red to yellow).
Expression and correlation of hub genes with YEATS2
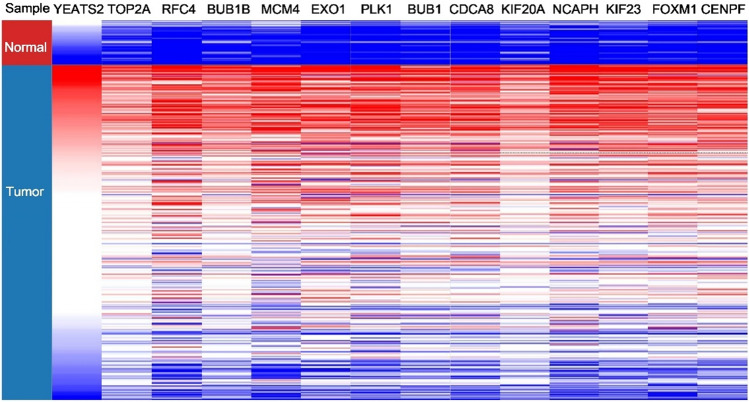
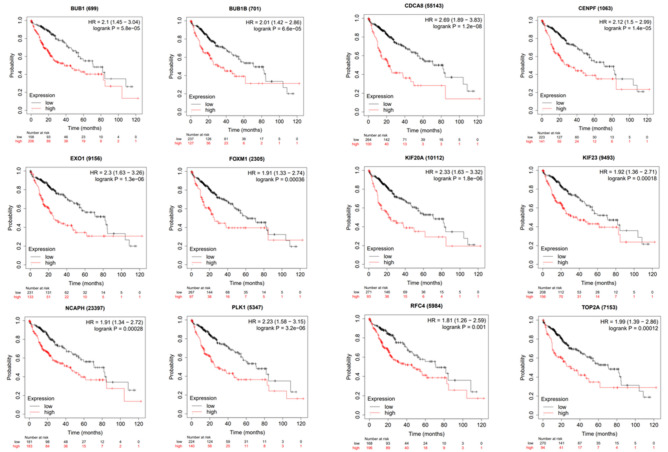
Hierarchical clustering effectively distinguished live carcinoma samples from non-cancerous specimens through the identification of hub genes (Fig. 10). Notably, these 13 hub genes exhibited a strong positive correlation with the expression of the YEATS2 gene, which was notably overexpressed in cancer tissues. Furthermore, the Kaplan–Meier analysis of these 13 hub genes revealed that those with higher expression levels were associated with poorer prognoses (Fig. 11).
Figure 10.
Hierarchical clustering of YEATS2 and hub genes.
Figure 11.
Kaplan–Meier curve of hub genes.
Discussion
In 2020, approximately 906,000 individuals worldwide were diagnosed with liver cancer, with hepatocellular carcinoma being the most prevalent subtype21. This condition ranks as the third leading cause of cancer-related deaths globally, exhibiting a relative 5-year survival rate of approximately 18%. Notably, the similarity between the annual incidence and mortality rates of hepatocellular carcinoma, which total 830,000 deaths per year, underscores the dire prognosis associated with this disease22. Despite the increasing availability of treatment options for liver cancer patients, the prognosis remains poor due to factors such as tumor heterogeneity and drug resistance. These factors contribute significantly to cancer treatment failure and account for a majority of cancer-related deaths. Therefore, the urgent need for the identification of new liver cancer biomarkers is paramount.
posttranslational modification (PTM) of histones is essential in the expression, maintenance, and replication of eukaryotic genomes23. Post-transcriptional modification of histones requires the recruitment of specific readers to chromosomes to trigger downstream signal transduction (e.g., gene transcription, DNA replication, and repair)24. YEATS domains have been identified as a novel class of histone modification readers25,26. It has been confirmed that human YEATS domain proteins play the role of proto-oncogenes in the occurrence and development of various cancers11,27–30. YOU et al. reported that the YEATS4/TCEA1/DDX3 axis plays an important role in the occurrence and development of HCC31. However, the sites at which YEATS domains recognize post-transcriptional histone modifications are different in different cancers. For instance, in non-small cell lung cancer, YEATS4 mainly recognizes histone H3K27ac or H3K14ac32, while YEATS2 combines with histone H3K27ac or H3K27cr to exert biological functions10,11. At present, according to the different characteristics of YEATS domain, different targeting inhibitors have been developed, such as XL-13 targeting MLLT1 and SGC-iMLLT, a small molecule inhibitor targeting both MLLT1 and MLLT333,34.
Human YEATS2 gene is located at 3q27.1, and its encoded protein contains 1422 amino acids with a molecular weight of about 150 kDa. The functional domain of YEATS is located between 220 amino acids and 325 amino acids, which mediates the recognition of specific modification sites by YEATS27. The C-terminus contains a folding domain of about 90 amino acids, which can recruit other ATAC complexes to locate the promoter region of target genes. MI et al.9 reported that after the YEATS domain of YEATS2 was mutated in H1299 and A549 cell lines, the overall acetylation level of the cell was down-regulated, and the proliferation, invasion and metastasis of cancer cells were down-regulated. Further analysis of TCGA database data showed that YEATS2 was amplified in lung squamous cell carcinoma (56%), ovarian serous cystadenocarcinoma (27%), head and neck squamous cell carcinoma (23%) and other cancers. This suggests that YEATS2 may play an important role in cancer.
In this study, we analyzed the expression of YEATS2 mRNA and protein in HCC and found that YEATS2 was significantly highly expressed in HCC cancer tissues compared with adjacent tissues and correlated with TNM stage. Furthermore, patients with high YEATS2 expression showed poor prognosis. Meanwhile, we found that promoter methylation of YEATS2 was related to clinicopathological characteristics of HCC patients. Our results indicate that YEATS2 gene could potentially serve as a biomarker for distinguishing tumor tissues from normal tissues in HCC patients. Through Gene Ontology (GO) analysis, we observed significant enrichments in the biological processes of co-expressed genes, particularly in carboxylic acid metabolic process, oxoacid metabolic process, cofactor metabolic process, organic acid metabolic process, single-organism catabolic process cell cycle, cell cycle process, nuclear division, mitotic cell cycle and organelle fission. The variation observed in the cellular components of co-expressed genes were primarily concentrated in blood microparticles, extracellular space, endocytic vesicle lumen, high-density lipoprotein particle, lipoprotein particle, chromosome, chromosomal part, spindle, chromosomal region, and chromosome, centromeric region. The variation observed in the molecular function of co-expressed genes were primarily concentrated in organic acid, sodium symporter activity, lipid transporter activity, solute: sodium symporter activity, alcohol binding, glycine N-acyltransferase activity ATP binding, pyrophosphatase activity, hydrolase activity, acting on acid anhydrides, in phosphorus-containing anhydrides, hydrolase activity, acting on acid anhydrides and adenyl ribonucleotide binding. The analysis of the KEGG pathway revealed a significant enrichment of co-expressed genes primarily in processes related to tyrosine metabolism, PPAR signaling pathway, metabolic pathways, primary bile acid biosynthesis, mismatch repair and cell cycle. It is well known that the occurrence and development of hepatocellular carcinoma is related to metabolic changes, proliferation and microenvironment disorders35. The above results are consistent with it. Therefore, YEATS2 and its co-expressed genes may play crucial roles in HCC development, driven by intricate molecular mechanisms. Finally, we constructed a PPI network to obtain and analyze hub genes. The results showed that these 13 hub genes were highly expressed in the tissues, and the genes with higher expression levels were associated with poor prognosis.
The present study’s exploration of YEATS2 is not without its limitations. Primarily, the quantitative analysis of YEATS2 was constrained by a relatively small sample size, which might have undermined the precision and broader application of our results. Additionally, the public database’s timeliness might have restricted access to the latest and most extensive data, potentially impeding the study’s comprehensiveness and topicality.
YEATS2, emerging as a promising biomarker for hepatocellular carcinoma, holds immense potential for further scientific exploration and advancement. By conducting a thorough analysis of its expression pattern and functional attributes in various diseases, it is anticipated to offer a novel and insightful perspective for enhancing the diagnosis and treatment of hepatocellular carcinoma. However, to become a true marker, it is still necessary to fully understand the differences in its expression in different types of hepatocellular carcinoma, and to deeply explore its biological functions and regulatory mechanisms. Furthermore, its sensitivity and specificity need to be verified by clinical samples. To achieve this objective, it is indispensable to forge stronger collaborations between basic and clinical research, leveraging cutting-edge technologies to unearth deeper insights, thereby propelling significant advancements in the realm of hepatocellular carcinoma.
Conclusions
YEATS2 is overexpressed in patients with hepatocellular carcinoma (HCC), strongly correlating with a poorer prognosis. This suggests that targeting YEATS2 could hold significant potential as a therapeutic strategy for liver cancer. Nevertheless, further investigations are imperative to elucidate the underlying mechanisms and expand its clinical utilization.
Supplementary Information
Author contributions
N.D. conceived this study and wrote the manuscript. L.Y. wrote the manuscript. J.W. and Y.L. analyzed the partial raw data. X.B. and F.G. proformed the experimental verification. R.W. processed the partial raw data. J.C. drafted the part of manuscript. G.L. provided the theoretical guidance and revised the manuscript.
Funding
The study was supported by Shandong Provincial Natural Science Foundation [ZR2017PH007].
Data availability
The datasets of the study have mainly been collected, obtained, and analyzed from corresponding online databases, and corresponding website links were showed in Materials and Methods. UALCAN: http://ualcan.path.uab.edu. TIMER: https://cistrome.shinyapps.io/timer/. OncoLnc database: http://www.oncolnc.org. CBioPortal: http://www.cbioportal.org. Coexpedia: https://www.coexpedia.org. GEPIA: http://gepia.cancer-pku.cn. STRING: http://www.string-db.org. UCSC Cancer Genomics Browser: http://genome-cancer.ucsc.edu. MedCalc: https://www.r-project.org/.
Competing interests
The authors declare no competing interests.
Footnotes
Publisher's note
Springer Nature remains neutral with regard to jurisdictional claims in published maps and institutional affiliations.
These authors contributed equally: Ning Du and Lili Yi.
Contributor Information
Jian Chai, Email: chaijian1989@126.com.
Guijie Liu, Email: zjulgj@163.com.
Supplementary Information
The online version contains supplementary material available at 10.1038/s41598-024-68348-0.
References
- 1.Vogel, A., Meyer, T., Sapisochin, G., Salem, R. & Saborowski, A. Hepatocellular carcinoma. Lancet400(10360), 1345–1362. 10.1016/S0140-6736(22)01200-4 (2022). 10.1016/S0140-6736(22)01200-4 [DOI] [PubMed] [Google Scholar]
- 2.Rizzo, A. et al. Hypertransaminasemia in cancer patients receiving immunotherapy and immune-based combinations: The MOUSEION-05 study. Cancer Immunol. Immun.72(6), 1381–1394. 10.1007/s00262-023-03366-x (2023). 10.1007/s00262-023-03366-x [DOI] [PMC free article] [PubMed] [Google Scholar]
- 3.Dall’Olio, F. G. et al. Immortal time bias in the association between toxicity and response for immune checkpoint inhibitors: A meta-analysis. Immunotherapy.13(3), 257–270. 10.2217/imt-2020-0179 (2021). 10.2217/imt-2020-0179 [DOI] [PubMed] [Google Scholar]
- 4.Weinstein, I. B. & Joe, A. K. Mechanisms of disease: Oncogene addiction–a rationale for molecular targeting in cancer therapy. Nat. Clin. Pract. Oncol.3(8), 448–457. 10.1038/ncponc0558 (2020). 10.1038/ncponc0558 [DOI] [PubMed] [Google Scholar]
- 5.Sridhar, S. et al. Targeted molecular therapeutic options for hepatocellular carcinoma. Crit. Rev. Oncog.25(1), 47–55. 10.1615/CritRevOncog.2020034985 (2020). 10.1615/CritRevOncog.2020034985 [DOI] [PMC free article] [PubMed] [Google Scholar]
- 6.Gerbes, A. et al. Gut roundtable meeting paper: Selected recent advances in hepatocellular carcinoma. Gut.67(2), 380–388. 10.1136/gutjnl-2017-315068 (2020). 10.1136/gutjnl-2017-315068 [DOI] [PMC free article] [PubMed] [Google Scholar]
- 7.Wang, Y. L., Faiola, F., Xu, M., Pan, S. & Martinez, E. Human ATAC Is a GCN5/PCAF-containing acetylase complex with a novel NC2-like histone fold module that interacts with the TATA-binding protein. J. Biol. Chem.283(49), 33808–33815. 10.1074/jbc.M806936200 (2008). 10.1074/jbc.M806936200 [DOI] [PMC free article] [PubMed] [Google Scholar]
- 8.Orpinell, M. et al. The ATAC acetyl transferase complex controls mitotic progression by targeting non-histone substrates. EMBO J.29(14), 2381–2394. 10.1038/emboj.2010.125 (2008). 10.1038/emboj.2010.125 [DOI] [PMC free article] [PubMed] [Google Scholar]
- 9.Nagase, T. et al. Prediction of the coding sequences of unidentified human genes. XV. The complete sequences of 100 new cDNA clones from brain which code for large proteins in vitro. DNA Res.6(5), 337–345. 10.1093/dnares/6.5.337 (1999). 10.1093/dnares/6.5.337 [DOI] [PubMed] [Google Scholar]
- 10.Zhao, D. et al. YEATS2 is a selective histone crotonylation reader. Cell Res.26(5), 629–632. 10.1038/cr.2016.49 (2016). 10.1038/cr.2016.49 [DOI] [PMC free article] [PubMed] [Google Scholar]
- 11.Mi, W. et al. YEATS2 links histone acetylation to tumorigenesis of non-small cell lung cancer. Nat. Commun.8(1), 1088. 10.1038/s41467-017-01173-4 (2017). 10.1038/s41467-017-01173-4 [DOI] [PMC free article] [PubMed] [Google Scholar]
- 12.Chandrashekar, D. S. et al. UALCAN: A portal for facilitating tumor subgroup gene expression and survival analyses. Neoplasia.19(8), 649–658. 10.1016/j.neo.2017.05.002 (2017). 10.1016/j.neo.2017.05.002 [DOI] [PMC free article] [PubMed] [Google Scholar]
- 13.Li, T. et al. TIMER: A web server for comprehensive analysis of tumor-infiltrating immune cells. Cancer Res.77(21), e108–e110. 10.1158/0008-5472.CAN-17-0307 (2017). 10.1158/0008-5472.CAN-17-0307 [DOI] [PMC free article] [PubMed] [Google Scholar]
- 14.Zhang, K. et al. Clinicopathological significances of cancer stem cell-associated HHEX expression in breast cancer. Front. Cell Dev. Biol.8, 605744. 10.3389/fcell.2020.605744 (2020). 10.3389/fcell.2020.605744 [DOI] [PMC free article] [PubMed] [Google Scholar]
- 15.Wang, Z., Jensen, M. A. & Zenklusen, J. C. A practical guide to the cancer genome atlas (TCGA). Methods Mol. Biol.1418, 111–141. 10.1007/978-1-4939-3578-9_6 (2016). 10.1007/978-1-4939-3578-9_6 [DOI] [PubMed] [Google Scholar]
- 16.Gao, J. et al. Integrative analysis of complex cancer genomics and clinical profiles using the cBioPortal. Sci. Signal.6(269), pl1. 10.1126/scisignal.2004088 (2013). 10.1126/scisignal.2004088 [DOI] [PMC free article] [PubMed] [Google Scholar]
- 17.Yang, S. et al. COEXPEDIA: Exploring biomedical hypotheses via co-expressions associated with medical subject headings (MeSH). Nucleic Acids Res.45(D1), D389–D396. 10.1093/nar/gkw868 (2017). 10.1093/nar/gkw868 [DOI] [PMC free article] [PubMed] [Google Scholar]
- 18.Tang, Z. et al. GEPIA: A web server for cancer and normal gene expression profiling and interactive analyses. Nucleic Acids Res.45(W1), W98–W102. 10.1093/nar/gkx247 (2017). 10.1093/nar/gkx247 [DOI] [PMC free article] [PubMed] [Google Scholar]
- 19.Szklarczyk, D. et al. STRING v11: Protein-protein association networks with increased coverage, supporting functional discovery in genome-wide experimental datasets. Nucleic Acids Res.47(D1), D607–D613. 10.1093/nar/gky1131 (2019). 10.1093/nar/gky1131 [DOI] [PMC free article] [PubMed] [Google Scholar]
- 20.Nassar, L. R. et al. The UCSC genome browser database: 2023 update. Nucleic Acids Res.51(D1), D1188–D1195. 10.1093/nar/gkac1072 (2023). 10.1093/nar/gkac1072 [DOI] [PMC free article] [PubMed] [Google Scholar]
- 21.Sung, H. et al. Global cancer statistics 2020: GLOBOCAN estimates of incidence and mortality worldwide for 36 cancers in 185 countries. CA Cancer J. Clin.71(3), 209–249. 10.3322/caac.21660 (2021). 10.3322/caac.21660 [DOI] [PubMed] [Google Scholar]
- 22.Siegel, R. L., Miller, K. D., Fuchs, H. E. & Jemal, A. Cancer statistics, 2022. CA Cancer J. Clin.72(1), 7–33. 10.3322/caac.21708 (2022). 10.3322/caac.21708 [DOI] [PubMed] [Google Scholar]
- 23.Lawrence, M., Daujat, S. & Schneider, R. Lateral thinking: How histone modifications regulate gene expression. Trends Genet.32(1), 42–56. 10.1016/j.tig.2015.10.007 (2016). 10.1016/j.tig.2015.10.007 [DOI] [PubMed] [Google Scholar]
- 24.Suganuma, T. & Workman, J. L. Signals and combinatorial functions of histone modifications. Annu. Rev Biochem.80, 473–499. 10.1146/annurev-biochem-061809-175347 (2011). 10.1146/annurev-biochem-061809-175347 [DOI] [PubMed] [Google Scholar]
- 25.Zhao, D., Li, Y., Xiong, X., Chen, Z. & Li, H. YEATS domain-a histone acylation reader in health and disease. J. Mol. Biol.429(13), 1994–2002. 10.1016/j.jmb.2017.03.010 (2017). 10.1016/j.jmb.2017.03.010 [DOI] [PubMed] [Google Scholar]
- 26.Li, Y. et al. AF9 YEATS domain links histone acetylation to DOT1L-mediated H3K79 methylation. Cell.159(3), 558–571. 10.1016/j.cell.2014.09.049 (2014). 10.1016/j.cell.2014.09.049 [DOI] [PMC free article] [PubMed] [Google Scholar]
- 27.Kiuchi, J. et al. Overexpression of YEATS4 contributes to malignant outcomes in gastric carcinoma. Am. J. Cancer Res.8(12), 2436–2452 (2018). [PMC free article] [PubMed] [Google Scholar]
- 28.Yokoyama, A., Lin, M., Naresh, A., Kitabayashi, I. & Cleary, M. L. A higher-order complex containing AF4 and ENL family proteins with P-TEFb facilitates oncogenic and physiologic MLL-dependent transcription. Cancer Cell.17(2), 198–212. 10.1016/j.ccr.2009.12.040 (2010). 10.1016/j.ccr.2009.12.040 [DOI] [PMC free article] [PubMed] [Google Scholar]
- 29.Wan, L. et al. ENL links histone acetylation to oncogenic gene expression in acute myeloid leukaemia. Nature.543(7644), 265–269. 10.1038/nature21687 (2017). 10.1038/nature21687 [DOI] [PMC free article] [PubMed] [Google Scholar]
- 30.Erb, M. A. et al. Transcription control by the ENL YEATS domain in acute leukaemia. Nature.543(7644), 270–274. 10.1038/nature21688 (2017). 10.1038/nature21688 [DOI] [PMC free article] [PubMed] [Google Scholar]
- 31.You, S. et al. Abnormal expression of YEATS4 associates with poor prognosis and promotes cell proliferation of hepatic carcinoma cell by regulation the TCEA1/DDX3 axis. Am. J. Cancer Res.8(10), 2076–2087 (2018). [PMC free article] [PubMed] [Google Scholar]
- 32.Hsu, C. C. et al. Recognition of histone acetylation by the GAS41 YEATS domain promotes H2A.Z deposition in non-small cell lung cancer. Genes Dev.32(1), 58–69. 10.1101/gad.303784.117 (2018). 10.1101/gad.303784.117 [DOI] [PMC free article] [PubMed] [Google Scholar]
- 33.Li, X. et al. Structure-guided development of YEATS domain inhibitors by targeting π-π-π stacking. Nat. Chem. Biol.14(12), 1140–1149. 10.1038/s41589-018-0144-y (2018). 10.1038/s41589-018-0144-y [DOI] [PMC free article] [PubMed] [Google Scholar]
- 34.Moustakim, M. et al. Discovery of an MLLT1/3 YEATS domain chemical probe. Angew. Chem. Int. Ed. Engl.57(50), 16302–16307. 10.1002/anie.201810617 (2018). 10.1002/anie.201810617 [DOI] [PMC free article] [PubMed] [Google Scholar]
- 35.Gao, Q. et al. Integrated proteogenomic characterization of HBV-related hepatocellular carcinoma. Cell.179(2), 561-577.e22. 10.1016/j.cell.2019.08.052 (2019). 10.1016/j.cell.2019.08.052 [DOI] [PubMed] [Google Scholar]
Associated Data
This section collects any data citations, data availability statements, or supplementary materials included in this article.
Supplementary Materials
Data Availability Statement
The datasets of the study have mainly been collected, obtained, and analyzed from corresponding online databases, and corresponding website links were showed in Materials and Methods. UALCAN: http://ualcan.path.uab.edu. TIMER: https://cistrome.shinyapps.io/timer/. OncoLnc database: http://www.oncolnc.org. CBioPortal: http://www.cbioportal.org. Coexpedia: https://www.coexpedia.org. GEPIA: http://gepia.cancer-pku.cn. STRING: http://www.string-db.org. UCSC Cancer Genomics Browser: http://genome-cancer.ucsc.edu. MedCalc: https://www.r-project.org/.


