

SUMMARY
Tumor MYCN amplification is seen in high-risk neuroblastoma, yet direct targeting of this oncogenic transcription factor has been challenging. Here, we take advantage of the dependence of MYCN-amplified neuroblastoma cells on increased protein synthesis to inhibit the activity of eukaryotic translation initiation factor 4A1 (eIF4A1) using an amidino-rocaglate, CMLD012824. Consistent with the role of this RNA helicase in resolving structural barriers in 5′ untranslated regions (UTRs), CMLD012824 increased eIF4A1 affinity for polypurine-rich 5′ UTRs, including that of the MYCN and associated transcripts with critical roles in cell proliferation. CMLD012824-mediated clamping of eIF4A1 spanned the full lengths of mRNAs, while translational inhibition was mediated through 5′ UTR binding in a cap-dependent and -independent manner. Finally, CMLD012824 led to growth inhibition in MYCN-amplified neuroblastoma models without generalized toxicity. Our studies highlight the key role of eIF4A1 in MYCN-amplified neuroblastoma and demonstrate the therapeutic potential of disrupting its function.
In brief
MYCN amplification is a key driver of high-risk neuroblastoma. Volegova et al. capitalize on the dependence of MYCN-amplified neuroblastoma cells on increased protein synthesis by using amidino-rocaglates to inhibit translation initiation factor eIF4A1, resulting in direct targeting of the MYCN mRNA and selective cytotoxicity in animal models.
Graphical Abstract
INTRODUCTION
Neuroblastoma is a tumor of the sympathetic nervous system, accounting for ~10% of childhood cancers, with a survival rate of <50% in patients with high-risk disease.1 Nearly half of high-risk tumors harbor oncogenic amplification of MYCN, which is associated with aggressive disease and fatal relapse.2 As with other MYC family proteins, MYCN is considered “undruggable” due to the lack of drug binding surfaces on its helix-loop-helix structure,3,4 prompting investigations into alternate means of disrupting its expression therapeutically.5–8 Recent studies in MYC-driven cancers have identified components of the mRNA translation machinery as major drivers of oncogenesis.9 While protein synthesis is universally required, cancers driven by oncogenic transcription factors have a correspondingly high cellular demand for mRNA translation to meet their overwhelming transcriptional burden.10 Indeed, MYCN-amplified neuroblastoma cells exhibit significant dependence on protein synthesis11 suggesting that this process could be disrupted for therapeutic benefit.
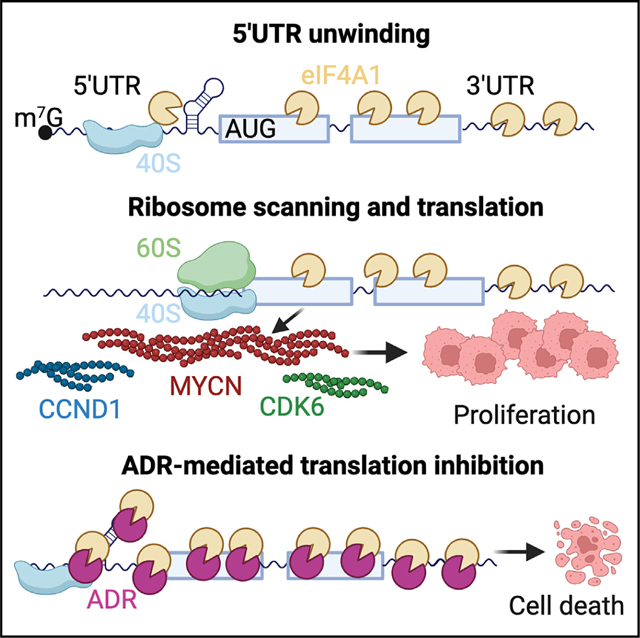
Translation regulation in eukaryotic cells begins at initiation, a process mediated by the eukaryotic initiation factor 4F (eIF4F) complex, composed of eIF4A, an ATP-dependent DEAD-box RNA helicase that is crucial for unwinding 5′ untranslated region (5′ UTR) secondary structures and facilitating ribosome scanning, the cap-binding protein eIF4E, and the scaffolding protein eIF4G.12 Upon binding to the mRNA cap, the eIF4F complex remodels the 5′ UTR and recruits the 43S ribosome pre-initiation complex (PIC).12,13 The PIC then scans the 5′ UTR for an initiation codon to start translation. Hence, mRNAs must compete for access to eIF4F, and structural barriers within their 5′ UTRs affect their ability to recruit or alter the scanning efficiency of the PIC.14,15 This is especially true of oncogenic mRNAs whose complex 5′ UTR structures render them heavily dependent on the eIF4A helicase for translation.16 The ribonucleotide composition of 5′ UTRs is primarily responsible for this effect, where stem loop formation, polypurine content ([AG]n), and G-quadruplexes can all negatively impact the speed of translation initiation.9,17–19
Due to its critical role in gene expression, translation initiation is frequently commandeered by oncogenic drivers to regulate the expression of growth-promoting genes and thus has emerged as an attractive therapeutic target.13,20–22 However, although numerous compounds capable of disrupting translation exist,23–26 only one member of the rocaglate family, zotatifin (eFT226),27,28 has entered clinical trials to date. Rocaglates are naturally occurring compounds containing a common cyclopenta[b]benzofuran core and, together with their synthetic analogs, are highly potent protein synthesis inhibitors. Rocaglates repress translation by causing eIF4A1 (the primary eIF4A homolog) to preferentially clamp onto polypurine-rich sequences in the 5′ UTRs of mRNAs, blocking ribosome scanning.29,30 Such activity provides a selective therapeutic advantage in cancer cells due to the polypurine-rich 5′ leaders of oncogenic and cell-cycle-regulating mRNAs.26 The synthetic rocaglate CR-1–31-B has been tested in several cancers including neuroblastoma,16,24,31 although whether it exhibits transcript-specific effects without inducing systemic toxicity is unknown. Here, we employ amidino-rocaglates (ADRs),32,33 a class of synthetic rocaglate analogs that target eIF4A1 with higher specificity and selectivity, to investigate translation factor dependence in MYCN-amplified neuroblastoma.
RESULTS
eIF4A1 expression is enriched in MYCN-amplified neuroblastoma
To determine the therapeutic potential of inhibiting protein translation in neuroblastoma, we first analyzed translation initiation factor expression in RNA-seq data from 498 primary human tumors (MYCN amplified = 92; GSE62564). Higher expression of several factors was observed in MYCN-amplified tumors, most significantly of mRNAs that comprise the eIF4F complex (eIF4A1, eIF4E, eIF4G1), both based on MYCN annotation status (Figures S1A and S1B) and ranked expression levels (Figure 1A). The strongest correlation was noted between the MYCN transcript and that of eIF4A1 and, to a lesser extent, with that of eIF4E and eIF4G1 (Figure 1B). Interestingly, eIF4F complex expression was not significantly associated with c-MYC overexpression, which has been reported in a subset (~10%) of MYCN-nonamplified neuroblastomas34 (Figures 1C and 1D). Pairwise correlation analysis of the MYCN-amplified tumor subset (n = 92) confirmed the positive correlation between higher MYCN and eIF4A1 and eIF4G1 transcript levels (Figure 1E). Contrastingly, there was no correlation between c-MYC and eIF4A1 expression in the MYCN-nonamplified tumor subset (Figure S1C). In addition, analysis of our published chromatin immunoprecipitation and high-throughput sequencing (ChIP-seq) data in MYCN-amplified neuroblastoma cells35 (GSE103084) revealed MYCN binding to eIF4F complex gene promoters but at much higher levels for EIF4A1 compared to EIF4E or EIF4G1 (Figure 1F). These results suggest that eIF4A1 may play a prominent role in MYCN-driven translation and that its inhibition may be deleterious to MYCN-amplified neuroblastoma cells.
Figure 1. MYCN-amplified neuroblastomas exhibit translation initiation factor upregulation and are enriched for polypurine-rich 5′ UTR mRNAs.

(A) Hierarchical clustering of translation initiation factor gene expression in primary neuroblastoma tumors (n = 498, GSE62564), ranked by MYCN expression. Z score = mean ± SD.
(B) Violin plots showing expression of the indicated initiation factors in tumors with lowest and highest MYCN expression levels, as depicted in (A) (n = 30 each) (P, Student’s t test).
(C) Hierarchical clustering of the tumors in (A) ranked by c-MYC expression.
(D) Violin plots depicting the expression of the indicated initiation factors in primary tumors in (C) with the highest and lowest c-MYC (n = 30) expression levels.
(E) Correlogram of MYCN and translation initiation factor gene expression in MYCN-amplified primary tumors (n = 92, GSE62564). Circles represent Spearman’s correlation coefficients, p < 0.01.
(F) ChIP-seq profiles of MYCN binding at the indicated gene loci in Kelly neuroblastoma cells. X axis, genomic position; y axis, MYCN binding in units of reads per million (rpm).
(G) Polypurine ranking of mRNAs expressed in primary neuroblastomas. Blue, bottom 25%; red, top 25%.
(H) Fold change (FC) distributions of highly variable genes in tumors with the highest and lowest (top and bottom 10%) MYCN expression levels (n = 30 each) (p < 0.01, Student’s t test).
(I) Polypurine rank distribution of the highly variable upregulated genes (high, FC > 5; low, FC < 2) (p < 0.01, Student’s t test).
(J) Volcano plot of genes correlated with eIF4A1 in primary tumors (n = 498, FDR < 0.05). See also Figure S1 and Table S1.
To assess the targetability of MYCN-amplified neuroblastoma with rocaglates, we analyzed the 5′ UTR polypurine content of the transcripts expressed in the 498 primary tumor dataset (GSE62564) by quantifying sequential polypurines in the corresponding 5′ UTR regions of all expressed mRNAs and ranking these from lowest (polypurine-poor, rank = 1) to highest (polypurine-rich, rank = 10,570) after normalizing to 5′ UTR length (Figure 1G). The MYCN 5′ UTR ranked highly (rank = 9,689, 93rd percentile); by contrast, the c-MYC 5′ UTR had a relatively lower polypurine content (rank = 8,552, 80th percentile), in keeping with the lack of sequence homology between the two 5′ UTRs.36 Transcripts encoding genes with major roles in cell proliferation (CCND1, CCNE1, and CDK4/6) were also represented among the top polypurine-rich group (Figure 1G). Next, we sought to understand the extent of 5′ UTR polypurine content of transcripts that were differentially expressed between MYCN-amplified and -nonamplified tumors on the premise that these mRNAs would be the most biologically relevant. We first identified the highly variably expressed genes in all the tumors by arraying and binning all transcripts by expression level and calculating the variance coefficient as previously described37 (n = 524) (Figure S1D). Among the transcripts expressed in the top and bottom 30 tumors ranked by MYCN expression level, 30% were upregulated (n = 162/524) and 60% were downregulated (n = 317/524) in the top MYCN-expressing (MYCN-amplified) compared with the bottom (MYCN-nonamplified) tumors, with, unsurprisingly, MYCN emerging as the most significantly upregulated transcript (Figure S1E). Those with the highest expression were upregulated in MYCN-amplified vs. -nonamplified tumors (Figures 1H and S1F). We next analyzed the most differentially expressed genes at the extreme ends of the dataset based on polypurine ranking and observed that the most upregulated genes were enriched for higher polypurine content (Figures 1I and S1H). The highly expressed polypurine-rich mRNAs specific to MYCN-amplified neuroblastomas were functionally enriched in key cellular processes, such as the G2/M checkpoint and RNA processing, as well as MYC targets (Figure S1I) suggesting that their inhibition would negatively impact cell proliferation. Finally, transcripts with polypurine-rich 5′ UTRs, including that of MYCN, were significantly overrepresented within the subset of transcripts that were positively correlated with eIF4A1 overexpression, compared to those that were negatively correlated (Figure 1J). Together, these analyses demonstrate that MYCN-amplified tumors are enriched in transcripts with polypurine-rich 5′ UTRs that are highly correlated with eIF4A1 expression and suggest that they could be amenable to rocaglate-mediated inhibition.
eIF4A1 inhibition is selectively cytotoxic to MYCN-amplified neuroblastoma
To identify a rocaglate derivative with high specificity and selectivity for eIF4A1, we screened a library (n = 42) of synthetic rocaglate analogs against a panel of established and patient-derived xenograft (PDX) human neuroblastoma cell lines and identified compound CMLD012824 (hereafter referred to as “ADR-824” in the figures) as highly potent (Figures 2A and S2A). CMLD012824 is a member of the ADR series of compounds, which differ structurally from other rocaglates by the addition of a 2-imidazoline ring. The chiral, racemic version of this compound (CMLD012612), which includes the non-bioactive enantiomer, was previously found to inhibit lymphoma growth in mice in combination with doxorubicin, but as a single agent, it had no effect on tumor-free survival.38 CMLD012824, the pure form of the bioactive enantiomer, had previously been found to be cytotoxic in one breast cancer cell line.32 CMLD012824 exhibited relatively higher potency against MYCN-amplified neuroblastoma cells, with a half maximal inhibitory concentration (IC50) in the sub-nM range compared to MYCN-nonamplified or non-transformed cells (Figure 2A). MYCN-amplified cells underwent dose-independent apoptosis and loss of membrane integrity within an hour of treatment, while nonamplified cells reached peak apoptotic response only at 24 h (Figure 2B and S2B). CMLD012824 led to both G1 and G2 cell-cycle arrest in MYCN-amplified cells but primarily G2 arrest in MYCN-nonamplified cells (Figures 2C and S2C). Importantly, HEK293 non-transformed cells showed no cycling defects at similar treatment conditions, suggesting that the cytotoxic effects of the CMLD012824 ADR derivative may be selective for cancer cells (Figures 2C and S2C). Consistent with the differential cell cycle effects, the decreased expression of regulatory proteins was observed at lower doses in MYCN-amplified versus nonamplified cells (Figure 2D). In keeping with its putative mode of action, CMLD012824 did not affect total eIF4A1 protein levels (Figure 2D). Finally, to assess the global impact of CMLD012824 on protein synthesis, we performed metabolic labeling of nascent proteins in MYCN-amplified, nonamplified, and non-transformed cells. In comparison with the promiscuous protein synthesis inhibitor cycloheximide (CHX), which abrogated protein synthesis in all three cell types, CMLD012824 preferentially inhibited protein synthesis in MYCN-amplified neuroblastoma cells and less so in MYCN-nonamplified and non-transformed cells (Figure 2E). Together, these results illustrate the divergent cellular responses elicited by CMLD012824 and suggest that this ADR analog may be selectively toxic to malignant cells and, in particular, to MYCN-amplified neuroblastoma cells.
Figure 2. CMLD012824 exhibits differential cytotoxicity in neuroblastoma cells.

(A) Cell viability of MYCN-amplified (red), nonamplified (blue) human neuroblastoma, and non-transformed (gray) cells, treated with varying concentrations of CMLD012824 (ADR-824) for 72 h. Data = mean ± SD, n = 3 replicates. Inset: chemical structure of ADR-824.
(B) Upper, western blot (WB) analysis of PARP cleavage. GAPDH, loading control; middle, annexin V; lower, membrane integrity analyses in MYCN-amplified (Kelly) and nonamplified (SK-N-AS) cells exposed to ADR-824 at the indicated doses. Data = mean ± SD, n = 3.
(C) Flow cytometry analysis of propidium iodide and EdU incorporation in the indicated neuroblastoma and non-transformed (HEK293) cells 24 h post exposure to ADR-824 (10 nM). Bottom, quantification of mean ± SD, n = 3 biological replicates.
(D) WB analysis of cell cycle markers in the indicated cells 24 h after varying doses of ADR-824. eIF4A1, loading control.
(E) Metabolic labeling of nascent protein synthesis in the indicated cells exposed to ADR-824, CHX, or DMSO for 1 h. Bottom, quantification of mean ± SD, n = 2. See also Figure S2.
ADR-mediated eIF4A1 inhibition selectively decreases MYCN translation
Given the high polypurine content of its 5′ UTR (Figure 1G), we predicted that the MYCN transcript would be especially sensitive to CMLD012824-mediated translation inhibition. Indeed, treatment of MYCN-amplified neuroblastoma cells led to a complete loss of MYCN protein signal on compared to that of PTBP1, a 5′ UTR polypurine-poor control (Figures 3A and 1G). Concomitantly, a dose-dependent decrease in MYCN protein levels was seen in MYCN-amplified neuroblastoma cells (Figure 3B). Meanwhile c-MYC protein levels in MYCN-nonamplified neuroblastoma cells were less affected, consistent with the lower polypurine content ranking of the c-MYC 5′ UTR (Figure 3B). Neither the MYCN-amplified nor nonamplified cells showed a compensatory increase in eIF4A1 protein levels (Figure 3C). To confirm whether the sensitivity of specific proteins to ADR inhibition could be predicted based on the polypurine content of their respective mRNAs, we assessed the effect of CMLD012824 on the translation of the polypurine-rich MYCN and the polypurine-poor XRN2 proteins (Figure 1G), in comparison to the global protein synthesis inhibition induced by CHX. While CHX led to reduced levels of both proteins, CMLD012824 caused loss only of MYCN and not XRN2 levels (Figure 3D). MYCN protein loss was sustained despite compensatory transcriptional upregulation of the mRNA (Figure 3E). Next, we determined whether transcription or protein degradation contributed to the effects of CMLD012824. The general transcription inhibitor actinomycin D alone did not substantially affect MYCN levels, but the addition of CMLD012824 led to a striking reduction (Figure 3F). The proteasomal inhibitor, MG132, led to a slight increase in MYCN protein levels, which did not decrease with CMLD012824. Moreover, the downregulated MYCN levels observed with actinomycin D and CMLD012824 were rescued by MG132, indicating that CMLD012824 itself does not independently induce MYCN degradation. Finally, we determined whether the loss of MYCN with CMLD012824 also affected its function as a DNA-binding transcription factor. Chromatin IP followed by RT-qPCR (ChIP-qPCR) showed a decrease in MYCN occupancy at the promoters of known target genes, including MYCN itself, EIF4A1, TP53, and AURKA39,40 (Figure 3G). By contrast, the polypurine-poor PHOX2B transcription factor (Figure 1G) showed no change in occupancy at its target promoters following CMLD012824 treatment (Figure 3G). These findings allow us to conclude that impaired translation of MYCN is one of the main mechanisms through which CMLD012824 exerts its cytotoxic effects in MYCN-amplified neuroblastoma cells.
Figure 3. ADR-mediated inhibition of eIF4A1 impairs MYCN translation.

(A) Immunofluorescence images of the MYCN protein in MYCN-amplified (Kelly) cells at 1 h post ADR-824 (10 nM) treatment. PTBP1, polypurine-poor control. Blue, DAPI nuclear stain. Scale bar, 10 μm.
(B) WB analysis of MYCN/c-MYC expression at 4 h post ADR-824 treatment at the indicated doses in MYCN-amplified (+) and nonamplified (−) cell lines.
(C) WB analysis of eIF4A1 protein levels after treatment as in (B).
(D) WB analysis of MYCN expression in MYCN-amplified (Kelly) cells treated with CHX (10 μg/mL) or ADR-824 (10 nM) for the indicated times. XRN2, polypurine-poor control.
(E) RT-qPCR analysis of MYCN mRNA in cells treated with CHX or ADR-824 as in (D). Data represent mean ± SD, n = 2.
(F) WB analysis of MYCN expression in MYCN-amplified neuroblastoma cells treated with actinomycin D (1 μg/mL) with or without MG132 (100 mM) or ADR-824 (10 nM). GAPDH, loading control for (B), (C), (D), and (E).
(G) ChIP-PCR analysis of MYCN and PHOX2B at the promoters of the indicated genes in MYCN-amplified neuroblastoma cells under DMSO- and ADR-824- (10 nM) treated conditions. Percent binding relative to input signal and IgG control is shown. Data = mean ± SD, n = 3.
CMLD012824 disrupts the translation of long and polypurine-rich 5′ UTRs
We next sought to understand whether the cytotoxicity of CMLD012824 in neuroblastoma cells was due to the purported effect of rocaglates to inhibit active translation by decreasing mRNA translation efficiency.41 We therefore analyzed the changes in ribosome occupancy on mRNA transcripts through ribosome profiling (Ribo-seq)42 of MYCN-amplified (Kelly) and nonamplified (SK-N-AS) neuroblastoma cells following a 1-h exposure to CMLD012824. Sequencing reads of ribosome-protected fragments normalized to total RNA sequences were used to define translational efficiency as previously described.43 Rather than a global downregulation of protein synthesis, CMLD012824 led to differential translation in both cell types compared to DMSO-treated cells. While significant decreases in translational efficiencies (33%; 1,841/5,621) were observed in MYCN-amplified cells, an increase in translation efficiencies was also noted (26%; 1451/5,621) (>1.5-fold change [FC] in either direction) (Figure 4A). Similar, but more modest, numbers of differentially translated mRNAs were seen in MYCN-nonamplified cells (downregulated, 25%, 1,535/6,053; upregulated, 16%, 950/6,053) (Figure S3A). Downregulated mRNAs that overlapped between MYCN-amplified and nonamplified cells (n = 994) were enriched for major proliferative and signaling processes such as WNT and Notch pathways, while upregulated mRNAs mostly involved translation elongation and termination (Figures S3B and S3C). The uniquely downregulated transcripts in MYCN-amplified cells (46%, 847/1,841) were enriched for RNA polymerase II sequence-specific DNA binding and transcription regulation (Figure 4B). Those similarly affected in MYCN-nonamplified cells (36%, 541/1,535) also involved the same processes (with non-overlapping mRNAs), although the extent of differential expression varied, with effects being more significant in MYCN-amplified cells (Figure S3D). The uniquely upregulated mRNAs in MYCN-amplified cells were enriched for RNA-binding factors, such as the RNA helicase DDX52, nuclear RNA-binding protein TDP43, and initiation factor eIF1 (Figures 4B and S3E), likely as a compensatory response to translation inhibition.
Figure 4. ADR-824 causes selective translation repression of long, polypurine-rich mRNAs.

(A) Scatterplot of total vs. ribosome-associated mRNA changes in DMSO- vs. ADR-824-treated (10 nM × 1 h) MYCN-amplified Kelly neuroblastoma cells (n =3 biological replicates each). p < 0.1, Anota2seq analysis (see STAR Methods). Dotted black lines indicate 1.5 FC in total mRNA (x axis) and ribosome occupancies (y axis).
(B) Functional enrichment of unique differentially regulated transcripts (FC > 1.5, p < 0.1, Fisher’s exact test in Enrichr).
(C) Volcano plot of translationally regulated mRNAs in DMSO- vs. ADR-824-treated cells (FC > 1.5, p < 0.1, Anota2seq).
(D) Motif enrichment analysis of the top motifs in the downregulated mRNA subset, trained against a background list of unregulated transcripts. E-values determined by MEME (see STAR Methods).
(E and F) 5′ UTR length distribution (E) and polypurine rank distribution (F) of translationally regulated transcripts (p < 2.2e–16; Student’s t test each).
(G and H) Scatterplots of polypurine (G) and GC content (H) changes by 5′ UTR length in upregulated versus downregulated mRNAs (Loess regression analysis, shaded regions, 95% confidence intervals).
(I) Heatmaps of translational efficiency (TE) changes (n = 76; p < 0.1) and polypurine ranking of MYCN-regulated target genes in ADR-824 vs. DMSO-treated cells (Z score = mean ± SD; p values, Student’s t test).
(J) Ribosome occupancy profiles of the polypurine-rich MYCN-regulated genes. GAPDH, polypurine-poor control.
(K) RT-qPCR analysis of the indicated mRNA distributions in polysome fractions pooled according to polysome occupancy. Light: 1–3 polysomes; heavy: 4+ polysomes. Signal was calculated by 2^-ΔΔCt method, normalized to total RNA in gradient and GAPDH controls. Data = mean ± SD, n = 3. See also Figures S3 and S4.
Consistent with the affinity of ADRs for polypurine sequences, 34% (622/1,841) of the translationally downregulated mRNAs in MYCN-amplified cells possessed 5′ UTRs ranking in the top quartile of polypurine content, compared with 17% (248/1,451) of upregulated mRNAs (Figure 4C). Comparable percentages of polypurine-rich 5′ UTRs were observed in MYCN-nonamplified cells (33% of downregulated, 19% of upregulated) (Figure S3F). Among the downregulated mRNAs in both cell types, the most significantly enriched motifs included short polypurine sequences (4–6 nucleotides) interspersed with CT nucleotides [GGGAGGCTGAGG], although also observed were highly significant motifs containing pyrimidine pairs and triplets (CC, CT, CCC, CCT) (Figures 4D and S3G), suggesting that the mRNA transcript specificity of CMLD012824 is not exclusive to purely polypurine-rich motifs. Therefore, we questioned whether polypurine content alone was the defining characteristic of ADR-sensitive mRNAs or whether 5′ UTR length also contributed to CMLD012824-mediated inhibition. Notably, downregulated mRNAs tended to have significantly longer 5′ UTRs (nt > 500) compared with upregulated mRNAs, which were enriched in shorter 5′ UTRs (nt < 200) (Figures 4E and S4A) and were among the lowest-ranking in polypurine content (Figures 4F and S4B). Among the downregulated mRNAs, even those with short 5′ UTRs were polypurine-rich, whereas the upregulated mRNAs had a preponderance of 5′ UTRs that were both short and polypurine-poor (Figures 4G and S4C). In contrast to polypurine content, there was no significant difference in pyrimidine content in the differentially translated genes in either cell type (Figures 4H and S4D), further demonstrating that polypurine content and 5′ UTR length together are the main determinants of mRNA sensitivity to CMLD012824.
Neuroblastoma cell state is driven by a unique landscape of super-enhancers (SEs), with the top SE being associated with MYCN itself.5 We analyzed the impact of CMLD012824 on the translational efficiencies of SE-associated genes in MYCN-amplified cells. Among the transcripts that were downregulated, 7% were associated with SEs (127/1,841), 43% of which were enriched for polypurine-rich 5′ UTRs (55/127), including MYCN (Figure S4E). We also examined the effect of CMLD012824 on a 157-gene MYCN target signature previously defined from 88 primary neuroblastoma tumors.44 Translationally downregulated MYCN target genes were significantly enriched for high 5′ UTR polypurine content compared to those that were upregulated (Figure 4I). CMLD012824 led to significant decreases in ribosome occupancies at MYCN and other polypurine-rich MYCN target mRNAs in this dataset, including PRMT1 and POLA2 (Figure 4J). To support our ribo-seq findings, we used polysome gradient fractionation to directly examine the changes that occur in ribosome occupancy upon CMLD012824 treatment. In MYCN-amplified neuroblastoma cells, we observed a shift from heavy (4+ ribosomes) to light (1–3 ribosomes) polysomes on polypurine-rich mRNAs, confirming their decreased translational efficiencies by CMLD012824 compared to polypurine-poor, upregulated mRNAs that were unaffected (Figures 4K, S4F, and S4G). Thus, a significant proportion of genes that are associated with the deregulated MYCN cell state are impacted by CMLD012824, thereby severely crippling the proliferative feedback loops in MYCN-amplified neuroblastoma.
CMLD012824 results in promiscuous eIF4A1 clamping along sensitive mRNAs
The rocaglate series of compounds exert their effects on translation primarily by causing eIF4A1 to clamp onto the 5′ UTRs of polypurine-rich mRNAs, thereby preventing ribosome scanning.41 Thus, CMLD012824 would be expected to selectively increase the association of eIF4A1 with sensitive endogenous mRNAs. Indeed, RNA immunoprecipitation and qPCR (RIP-qPCR) analysis of CMLD012824-treated MYCN-amplified neuroblastoma cells revealed enrichment of eIF4A1 binding to several candidate polypurine-rich mRNAs, including MYCN relative to polypurine-poor mRNAs (Figures 5A and S5A). A similar enrichment pattern was observed in MYCN-nonamplified neuroblastoma cells in keeping with the predicted mode of action of CMLD012824 (Figure S5B).
Figure 5. ADR-824 augments mRNA binding of eIF4A1 along the full lengths of mRNAs.

(A) RT-qPCR analysis of 5′ UTR polypurine-rich and -poor mRNAs bound to endogenous eIF4A1 protein immunoprecipitated in lysates from DMSO- or ADR-824-treated (10 nM × 1 h) MYCN-amplified cells. Data = mean ± SD, n = 3. ***p < 0.0001, Student’s t test.
(B) Frequency distribution of eIF4A1-bound clusters by nucleotide cluster length in naive- and ADR-824-treated conditions. Data represent consensus clusters,n = 2 biological replicates per condition. The inset zooms into the range of cluster length with highest frequencies in both conditions.
(C) Volcano plot of the relative changes in binding (FC > 1.5) of eIF4A1-bound mRNAs in DMSO- or ADR-824-treated cells as in (A) (p < 0.1, Anota2seq).
(D) Metagene analysis of eIF4A1-bound clusters along the indicated mRNA regions in DMSO- and ADR-824-treated cells. Data represent mean coverage (RPM), n = 2 biological replicates.
(E) Top motifs identified in eIF4A1 clusters that map to the indicated mRNA regions in DMSO- and ADR-824-treated cells. E-values adjusted to motif frequency are shown.
(F) Representative tracks of eIF4A1 binding to the MYCN mRNA. Signal in units of reads per kilobase per million (RPKM).
(G) Representative tracks of eIF4A1 binding (PAR-CLIP) and ribosome occupancy (RIBO-SEQ) profiles of polypurine-rich and -poor mRNAs. Black boxes, 5′ UTR regions. See also Figures S5 and S6.
To gain a better understanding of eIF4A1 binding across the transcriptome of MYCN-amplified neuroblastoma cells, we isolated transcripts that co-purified with endogenous eIF4A1 via photo-activatable ribonucleoside-enhanced crosslinking and immunoprecipitation (PAR-CLIP)45 in COG-N-415x MYCN-amplified PDX neuroblastoma cells exposed to CMLD012824 (Figure S5C). Sequencing reads of cDNA libraries generated from eIF4A1-associated RNAs were mapped to the human genome (GRCh37) and grouped to identify read clusters defining eIF4A1-bound regions.46 In DMSO-treated cells, binding was detected in 3,082 and 9,560 clusters per replicate (false discovery rate [FDR] = 0% and 0.42% respectively) with multiple clusters mapping to a single RNA (Figure 5B). Following CMLD012824 treatment, there was a significant increase in eIF4A1-bound clusters (161,568 and 158,503 per replicate; FDR 0.46% and 0.01% respectively), indicative of the magnitude of increased eIF4A1 association with RNA. The median cluster length in both DMSO- and CMLD012824-treated cells was ≤ 150 nucleotides (Figure 5B). While these short clusters formed the majority (85% ± 8%) of eIF4A1-bound RNAs in DMSO-treated cells, they accounted for only half of the clusters in CMLD012824-treated cells (51% ± 6%). In these latter cells, the other 50% were up to 1,000 nt long, demonstrating the spread of eIF4A1 binding along longer mRNA regions. A total of 826 and 1,833 eIF4A1-bound RNAs per replicate was observed in DMSO-treated cells (165 consensus RNAs, FDR = 0%). Following CMLD012824 treatment, the number of eIF4A1-bound RNAs was substantially higher (13,128 and 12,593 transcripts per replicate), with 9,269 consensus RNAs (FDR = 0.2%). The majority (~80%) of eIF4A1 binding occurred at protein coding gene mRNAs in both conditions, although approximately 20% also occupied long intergenic non-coding RNAs (Figure S5D). We next investigated whether CMLD012824 treatment had any effect on the mRNA binding efficiencies of eIF4A1 by measuring the number of reads per transcript relative to total RNA.43 Most mRNAs (~90%, 1,978/2,212, p < 0.1) became more strongly associated with eIF4A1 following CMLD012824 treatment (FC > 1.5) (Figure 5C). The CMLD012824-sensitive mRNAs were enriched for cell cycle and proliferation factors (G2/M transition, mitotic markers, and mTORC1 signaling) as well as RNA regulation (RNA degradation and RNA binding), consistent with the functional enrichment of polypurine-rich genes in MYCN-amplified primary neuroblastomas (Figures S5E and S1E).
We next determined whether eIF4A1 binding was influenced by 5′ UTR composition. Contrary to the well-known mechanism of action of rocaglates of disrupting translation initiation by clamping eIF4A1 to polypurine-rich 5′ UTRs,30 surprisingly, only 27% of the CMLD012824-sensitive mRNAs were ranked as having polypurine-rich 5′ UTRs, suggesting a degree of stochastic binding (Figure 5C). Alternatively, it also raised the possibility that polypurine content outside the 5′ UTR may account for the enhanced eIF4A1 binding. As such, we first queried eIF4A1-mRNA interactions along entire transcript lengths and whether these were altered following ADR treatment. Under DMSO-treated conditions, as expected, eIF4A1 binding was seen along 5′ UTRs (~15%), but greater numbers of clusters were found in coding sequences (CDSs; ~50%) and 3′ UTRs (~25%) (Figure S5F). Only 1% of the eIF4A1-bound mRNAs showed binding throughout the entire lengths of the transcripts, and the 5′ UTR clusters were either unique (11% ± 3%) or overlapped with the CDS (7.5% ± 1%) but not the 3′ UTR (Figure S5G). These binding patterns were similar in CMLD012824-treated cells, suggesting that naive eIF4A1 cluster distributions along mRNAs are largely retained upon ADR-mediated clamping, with a modest increase observed when binding included 5′ UTRs or CDS together with the 3′ UTRs (Figures S5F and S5G). As in the control cells, a large proportion of eIF4A1 binding was observed at the CDS (DMSO, 43% ± 1%; ADR-treated, 39%), suggesting that the recent observation of eIF4A1 binding to polypurine sequences in the CDS following RocA treatment47 may be due to naive eIF4A1 distribution on mRNAs. Aggregate read distribution analysis of eIF4A1 binding within the 5′ UTRs themselves showed that with DMSO-treatment, binding gradually increased in the 3′ direction toward the start codons, whereas following CMLD012824, eIF4A1 binding was more pronounced at the 5′ end of 5′ UTRs (Figure 5D), further demonstrating the sustained clamping ability of the compound. These 5′ UTR-specific clusters in CMLD012824-treated cells were enriched for positive regulation of translation in response to stress, likely indicative of a compensatory response to translation inhibition (Figures S5H).
Next, we determined whether ADRs mimicked the rocaglate predilection for polypurine-rich sequences by analyzing eIF4A1-bound mRNA sequences using de novo motif enrichment analysis.48 Interestingly, under DMSO-treatment conditions, a highly significant enrichment was observed for the [GA-GA]n and [AGG]n polypurine motifs of eIF4A1-bound RNAs not only at the 5′ UTRs but also along the entire length of the transcripts, pointing to the strong preference of eIF4A1 for polypurine sequences even in the absence of an inhibitor (Figures 5E and S6A). On the other hand, in CMLD012824-treated cells, the significantly enriched motifs were [GAG]n and [AAAA]n, suggesting that the inhibitor selectively enhances eIF4A1 preference for polypurine sequences with a higher adenosine content (Figure S6A). This was especially true for the subset of clusters that mapped to the 5′ UTRs (Figure 5E). At the same time, the CDS- and 3′ UTR-specific binding clusters showed lower enrichment for polypurine motifs and, in addition, demonstrated higher affinities for entirely novel cytosine-containing motifs (Figures 5E and S6B). Comparison of relative motif enrichment between the two datasets further supported the selective preference for adenosine content in the 5′ UTRs of ADR-treated cells (Figure S6C). Thus, the polypurine specificity of CMLD012824-mediated eIF4A1 clamping arises primarily at the 5′ UTR region and is enriched for poly-(A) sequences. These findings suggest that eIF4A1 has an innate polypurine preference and may function at multiple locations along the mRNA sequence and not only at the 5′ leaders, and while ADR treatment augments eIF4A1 binding and retains polypurine specificity in the 5′ UTR, it also exhibits variable specificity at other mRNA regions.
Given the striking sensitivity of MYCN-amplified neuroblastoma cells to CMLD012824, we further analyzed eIF4A1 binding to the MYCN transcript. The eIF4A1 binding sites along the MYCN mRNA followed the overall binding pattern, with reproducible peaks appearing at the 5′ UTR, CDS, and the stop codon in both DMSO- and CMLD012824-treated cells (Figure 5F). However, the binding efficiency of eIF4A1 was significantly augmented with CMLD012824, with an ~50-fold increase in binding peaks observed across the full-length transcript in comparison to control cells (Figure 5F). On the other hand, in contrast to MYCN and other polypurine-rich mRNAs, eIF4A1 binding along the 5′ UTRs of polypurine-poor transcripts such as PHOX2B was virtually absent even in CMLD012824-treated cells (Figure 5G), indicating that ADRs also retain polypurine specificity.
We next determined whether the sustained clamping of eIF4A1 following ADR treatment as determined by PAR-CLIP analysis correlated with the translation efficiency changes noted on ribosome profiling. Of the 9,269 eIF4A1-bound consensus RNAs in CMLD12824-treated cells, 30% (n = 2,789) met statistical significance in the ribosome profiling results, of which 37% (n = 1,037) were translationally downregulated (FC > 1.5). Interestingly, a number of eIF4A1-bound mRNAs were also translationally upregulated (n = 621, 22%, FC > 1.5) (Figure S6D). The eIF4A1-bound RNAs that corresponded to downregulated mRNAs were enriched for polypurine-rich 5′ UTRs (29%; n = 297) compared to those associated with upregulated mRNAs (14%; n = 88) (Figure S6D), consistent with observations in the total group of translationally regulated mRNAs (Figure 4C). Comparison of differential translational efficiencies (Figure 4C) and eIF4A1 clamping (Figure 5C) between DMSO-treated and CMLD012824-treated cells revealed that 18% (326/1,841) of translationally downregulated mRNAs exhibited increased eIF4A1 binding upon treatment (Figure S6E). Here again, intriguingly, we noted that a similar proportion of translationally upregulated mRNAs had increased eIF4A1 binding (16%, 234/1,451) (Figure S6E). Taken together, these findings delineate the features of CMLD012824-sensitive and insensitive mRNAs and suggest parameters for predicting whether select mRNAs are inhibited, remain unaffected, or even achieve upregulation.
CMLD012824 clamps eIF4A1 onto select polypurine-rich cellular mRNAs in a 5′ UTR-dependent manner
Although eIF4A1 exhibited surprisingly promiscuous mRNA clamping beyond the 5′ UTRs, which was augmented along full-length transcripts following CMLD012824 treatment, we questioned whether the 5′ UTR region alone was sufficient to confer the observed effects on translation. We therefore overexpressed human MYCN driven by a mammalian promoter and lacking the 5′ UTR in MYCN-nonamplified neuroblastoma cells and tested the effects on MYCN protein expression (Figure 6A). Without the endogenous MYCN 5′ UTR, CMLD012824 had no activity against MYCN protein levels, indicating that this region was necessary for the translation-inhibition effect of the ADR (Figure 6A). Next, we questioned whether an endogenous polypurine-rich 5′ UTR would be sufficient for CMLD012824-mediated translation inhibition through an in vitro translation assay. In agreement with the ribosome profiling results (Figure 4C), CMLD012824 inhibited the translation of a luciferase reporter downstream of not only the MYCN 5′ UTR but also of JUN and CCND1, two polypurine-rich 5′ UTRs (Figure 6B). By contrast, translation from polypurine-poor controls (CKS2 and XRN2) was not affected by CMLD012824, as was an eIF4A scanning-independent control, the hepatitis C viral internal ribosome entry site RNA (HCV IRES)49 (Figure 6B).
Figure 6. ADR-824 clamps eIF4A1 onto select polypurine-rich cellular mRNAs in a 5′ UTR-dependent and cap-independent manner.

(A) WB analysis of exogenously expressed 5′ UTR-depleted MYCN in MYCN-nonamplified SK-N-AS neuroblastoma cells, treated with the indicated doses of ADR-824 (1 h). GAPDH, loading control. Schematic depicts MYCN 5′ UTR-deleted construct.
(B) Renilla luciferase activity of in-vitro-translated endogenous 5′ UTR sequences cloned upstream of luciferase in the presence of DMSO or ADR-824 (25 nM). Signal is normalized to internal globin-firefly luciferase control. CKS2 and XRN2 RNAs, polypurine-poor controls; HCV IRES RNA, eIF4A-independent control. Data = mean ± SD, n = 3. ***p < 0.0001, Student’s t test.
(C) Top: schematic representation of the WT MYCN 5′ UTR, 5′ deletion mutant (MYCN 5′ DEL), and 3′ deletion mutant (MYCN 3′ DEL). Bottom left (three panels), luciferase activity of in-vitro-translated RNAs generated with the canonical MYCN m7G-cap or nonfunctional ApppG analog (A-cap). Bottom right, percent suppression of translation. Data = mean ± SD, n = 2, representative of 3 independent experiments. ***p < 0.0001, Student’s t test.
(D) Renilla luciferase activity from in vitro translation of indicated RNAs at the indicated concentrations in the presence of globin-firefly RNA (200 ng per reaction). Data = mean ± SD, n = 3.
Although canonical cap-dependent translation is by far the most prevalent mechanism of translation initiation in mammalian cells, non-canonical modes such as IRESs can be utilized by cancer cells exposed to hypoxia or cytotoxic stress.50 Indeed, translation of several oncogenic transcription factors, including MYCN, is initiated via IRES elements within their 5′ UTRs.36 We therefore determined whether the observed effect of CMLD012824 was primarily through disruption of cap-dependent translation initiation or whether IRES-driven activity was also affected. We first analyzed the effects of CMLD012824 on luciferase reporter activity from the wild-type (WT) MYCN 5′ UTR in the presence of a canonical m7G-cap or a nonfunctional A-cap. Treatment with the ADR caused a decrease in luciferase activity from the canonical MYCN G-cap. The A-capped WT MYCN 5′ UTR retained ~20% activity relative to the m7G-capped UTR, indicative of IRES activity, which was inhibited by a further 10% with CMLD012824 (Figure 6C). Next, we determined the effects of two IRES mutants (with deletions of either 80 nt at the 5′ end [5′ DEL] or 142 nt at the 3′ end [3′ DEL] of the 5′ UTR), both of which have been suggested to confer IRES activity in bicistronic assays.36 Compared to WT MYCN, the 5′ DEL mutant significantly de-repressed translation from the 5′ UTRs of both m7G- and A-capped mRNAs, suggesting that this region serves an inhibitory function (Figure 6C). The 3′ DEL mutant led to decreased translation of the m7G-capped RNA but increased A-capped mRNA translation (Figure 6C), suggesting that IRES activity is retained.36 Treatment with CMLD012824 inhibited the translation of not only the WT MYCN 5′ UTR but also both the 5′ and 3′ deletion mutants (Figure 6C), suggesting that the entire MYCN 5′ UTR contains ADR-sensitive sequences. Importantly, CMLD012824 inhibited the translation of all the A-capped mRNAs, indicating that ADR-mediated inhibition also extends to non-canonical translation (Figure 6C).
To prove whether the relative upregulation of mRNAs following translation inhibition as observed in our ribo-seq and PAR-CLIP analyses could be explained by 5′ UTR length and polypurine composition, we performed in vitro translation competition assays against the short polypurine-poor globin 5′ UTR in the presence of CMLD012824 or DMSO control. The short, polypurine-poor 5′ UTR of the XRN2 gene was able to compete efficiently against the globin 5′ UTR under both conditions (Figure 6D). By contrast, the MYCN 5′ UTR was consistently inhibited by CMLD012824 and could not be overcome even at higher RNA concentrations (Figure 6D). Competition against the MYCN 5′ DEL and 3′ DEL mutant mRNAs, however, resulted in a near-total rescue of the effect of CMLD012824, with the deletion mutants competing against the globin 5′ UTR at higher concentrations (Figure 6D). Rescue with the 3′ DEL was more effective than with 5′ DEL RNA, consistent with the removal of a larger number of polypurine nucleotides at the 3′ end of the 5′ UTR (Figure 6D). These results are in line with our ribo-seq and PAR-CLIP findings that suggest a dynamic aspect to ADR-mediated inhibition, where 5′ UTR content as well as competition between variable lengths and nucleotide compositions determine the outcome.
CMLD012824 slows tumor growth in vivo and improves survival
To investigate whether ADR inhibitors could be a viable therapeutic option in neuroblastoma, we tested the effects of CMLD012824 in several mouse models. As CMLD012824 has not previously been tested in vivo in enantiomerically pure form, we first established the maximum tolerated dose in non-tumor bearing C57BL/6J mice (Figure S7A). We determined that a 0.1 mg/kg daily dose was well tolerated and was sufficient to induce a decrease in target protein levels (CCND1, CCNE1, and CDK4) in liver tissue from treated animals, while eIF4A1 levels were unchanged, as observed in our in vitro studies (Figures S7B, 1G, and 2D). We next tested the compound in murine xenograft models of NB-9464 cells derived from the TH-MYCN transgenic mouse model of MYCN-driven neuroblastoma.51 Cells were inoculated subcutaneously into the flanks of syngeneic C57BL/6J mice, and upon tumor formation, the animals were treated with vehicle or CMLD012824 (two doses, 0.1 and 0.2 mg/kg) three times weekly by intraperitoneal injection for 30 days (Figure 7A). While animals treated with both doses of CMLD012824 exhibited no toxicities, a reduction in tumor burden was observed for those treated with the higher dose, although the study was not adequately powered to establish significance (Figure 7A). Nevertheless, we still observed loss of MYCN protein, as well as decreased levels of another polypurine-rich 5′ UTR target (DDX1) at both doses, while the polypurine-poor control (CKS2) was upregulated in tumors from CMLD012824-treated mice (Figure S7C). Finally, we tested the in vivo effects of CMLD012824 in a PDX model of MYCN-amplified neuroblastoma (COG-N-415x) generated in nude mice. Vehicle or 0.2 mg/kg CMLD012824 was administered three times weekly by intraperitoneal injection until endpoint tumor volume was reached (>1,000 mm3) or completion of the study (50 days). A significant decrease in tumor size was observed in mice treated with CMLD012824 (Figure 7B), with an improvement in overall survival (Figure 7C). Decreased tumor proliferation and increased apoptosis as well as a clear downregulation of MYCN protein levels were observed in CMLD012824-treated mice (Figures 7D and S7D). Western blot analysis confirmed loss of tumor MYCN and other polypurine-rich 5′ UTR targets (Figure 1G), while polypurine-poor controls and initiation factors remained unaffected (Figures 7E and S7E). These studies demonstrate that the ADR derivative CMLD012824 causes inhibition of tumor growth in MYCN-driven neuroblastoma models with tolerable toxicity.
Figure 7. ADR-824 inhibits tumor growth and improves survival in neuroblastoma.

(A) Tumor volumes of NB-9464 xenograft tumors in C57BL/6J mice (n = 10) treated 3 times weekly with the indicated doses of ADR-824. Dashed lines indicate beginning and end of treatment. Each curve corresponds to a separate animal (vehicle vs. 0.1 mg/kg, p < 0.25; vs. 0.2 mg/kg, p < 0.006, Welch’s test).
(B) Tumor volumes of MYCN-amplified PDX models (COG-N-415x) treated 3 times weekly with vehicle (n = 7) or ADR-824 (n = 10). Data = mean ± SD. Statistically significant differences between treatment groups were observed on days 21, 23, and 25 (**p < 0.001, ***p < 0.0001, Student’s t test) after which no vehicle-treated animals survived.
(C) Kaplan-Meier analysis of COG-N-415x PDX-bearing mice in (B) (p < 0.02, Mantel-Cox t test).
(D) Representative images of hematoxylin and eosin (H&E) and immunohistochemistry analyses (IHC) of the indicated tumor markers (Ki67 (proliferation), CC3, cleaved caspase 3 [apoptosis]) in vehicle- (top) and ADR-824-treated (bottom) mice. Scale bar, 100 μm.
(E) WB analysis of the indicated polypurine-rich, -poor, translation factor, and control proteins in COG-N-415x PDX tumors (t) in (D). See also Figure S7.
DISCUSSION
Direct targeting of amplified MYCN has proven to be challenging. Here, we demonstrate that targeting the complex 5′ UTR regulatory elements of the MYCN mRNA using ADRs offers an alternative route for disrupting the aberrant proliferative activities of this oncogene. ADR-mediated translation inhibition also provides an avenue for inhibiting a subset of cellular mRNAs critical to malignant proliferation, many of which are enriched in ADR-sensitive polypurine-rich motifs. Such selective suppression of protein synthesis is enabled by the unique transcriptional landscape and gene dependencies of MYCN-amplified neuroblastoma, where the extreme reliance of dysregulated MYCN on protein synthesis creates a vulnerability that when targeted, leads to selective cytotoxicity while sparing normal tissue.
The synthetic rocaglate CR-1–31-B has previously been shown to be cytotoxic in two neuroblastoma cell lines31; however, its impact on amplified MYCN and the mechanisms underlying such a response are unclear. We show that the ADR CMLD012824 is not only highly potent against multiple MYCN-amplified neuroblastoma cell lines but also demonstrate its tolerability and efficacy in animal models, thereby providing preclinical validation for further development of this class of inhibitors. We interrogate the effects of CMLD012824 on MYCN-driven protein synthesis and demonstrate that the long, polypurine-rich MYCN 5′ UTR predicted to contain a complex secondary structure that requires unwinding by eIF4A117 renders this oncogenic RNA an ideal ADR target. ADR-driven decreases in translation efficiencies of mRNAs corresponding to MYCN and other DNA-binding transcription factors in neuroblastoma led to a feedforward deregulatory loop as the translation of these drivers of proliferation was blocked and their effects on transcription lost. Additionally, super-enhancer-associated5 and MYCN target44 mRNAs, which are central to driving oncogenic transcription, were sensitized according to the polypurine content of their 5′ UTRs, suggesting that polypurine ranking of key oncogenic targets can be predictive of the downstream magnitude of ADR-mediated inhibition. This predictive power is exemplified by the comparison of MYCN and c-MYC mRNAs, where the higher polypurine content of the MYCN 5′ UTR results in stronger ADR-mediated inhibition and greater loss of the protein. The lesser effect on c-MYC protein levels was also recently reported in cancer models that were sensitive to CR-1–31-B.24 Moreover, the significant correlation of amplified MYCN with eIF4F complex expression in primary neuroblastomas indicates the selective advantage ADRs would have in cells in which MYCN is the driver. The concomitant decreases in corresponding protein levels of the genes that regulate the proliferative network reasonably account for the cellular cytotoxicity and effects on tumor burden in animal models.
We describe the characteristics of both ADR-sensitive and -insensitive mRNAs, highlighting the importance of interrogating the mRNA sequence, length, binding motifs, and additional features such as cap dependence to delineate the target preferences of rocaglate analogs. The CMLD012824-sensitive mRNAs were characterized by long, polypurine-rich 5′ UTRs without cap dependence, whereas CMLD012824-insensitive mRNAs contained short, polypurine-poor 5′ UTRs that are likely to be less dependent on eIF4A1 activity.52,53 This finding further illustrates the variable specificity of rocaglate compounds, as prior studies have identified G-quadruplexes,16 low GC content (silvestrol),26 high GC content (hippuristanol),19 short 5′ UTRs,24 or capdependent polypurine targeting (CR-1–31-B)30 as various determinants of inhibitory activity. While analysis of the ADR effect on protein translation confirmed the decrease in translation efficiencies of polypurine-rich mRNAs and demonstrated a stronger inhibitory effect on longer 5′ UTRs, PAR-CLIP analysis generated a comprehensive map of the distribution of naive and ADR-bound eIF4A1 protein on cellular mRNAs. We observed that naive eIF4A1 associates promiscuously with cellular mRNA sequences outside of 5′ UTR regions, suggesting that it may associate with proteins other than the eIF4F complex or that it is capable of loading independently onto mRNAs, as has been recently shown.14,41 While affinity along the full mRNA lengths was highly augmented by the ADR, the greatest increase in clamping was observed at the 5′ termini of the 5′ UTRs, indicating that blocks to PIC scanning accounted for the effect on translation inhibition. Importantly eIF4A1 exhibits preferential polypurine binding even in the absence of the inhibitor, implying that eIF4A1 spends more time sampling polypurine-rich rather than pyrimidine-rich sequences under normal conditions. Contrastingly, eIF4A1 binding upon ADR inhibition was accompanied by a surprising preference of eIF4A1 toward poly-adenosine sequence motifs in the 5′ UTRs of bound mRNAs, while CT-containing motifs were enriched in the CDS or 3′ UTRs. One explanation for this observation is that high-affinity polypurine sites become saturated, and excess eIF4A1 is being bound to lower affinity (CT-containing) sequences. Alternatively, interference with other RNA-binding proteins could contribute to the differing sequence specificity of ADRs between mRNA regions.
Overall, mRNAs that exhibited increased eIF4A1 binding upon ADR treatment were more likely to be translationally downregulated. However, as previously observed,33 ADR-mediated clamping of eIF4A1 did not fully correlate with loss of translation efficiency, potentially due to the eIF4A1 clamping observed in the 3′ UTR regions, which may not contribute to decreases in translation but rather interfere with microRNA mediated inhibition, such as in the case of MYCN.54 Binding of eIF4A1 in the CDS may also modulate translation elongation as described,47 thereby accounting for the lack of correlation between 5′ UTR binding and translation efficiency. The significant degree of clamping we observed in the CDS and 3′ UTRs may also result in sequestration of eIF4A1, causing the cytotoxic effect of the ADR to be compounded by reducing the amount of total available eIF4A1.30,55 These results, backed by the in vitro demonstration of the 5′ UTR requirement for translation inhibition, suggest that inhibition of eIF4A1 at 5′ UTRs, and not the CDS or 3′UTRs, primarily confers ADR-inhibitory activity. Meanwhile, the association of eIF4A1 with the CDS and 3′ UTRs, as well as other types of RNAs, suggests the possibility of complex secondary effects that warrant further study.
While the identification and classification of sensitive mRNAs is critical to identifying the direct targets of CMLD012824, characterization of insensitive mRNAs is vital to deciphering the global effects of ADRs in vivo. Previous models of rocaglate-mediated inhibition proposed a multi-modal effect in which the dominant-negative clamping of the rocaglate on target mRNAs is coupled with a bystander effect where off-target mRNAs are inhibited due to a decrease in available translation machinery.30,41 Our results expand this model by demonstrating that transcripts with short, unstructured 5′ UTRs can not only escape inhibition but also more effectively compete for the remaining translation initiation complexes, consequently becoming translationally upregulated. The competition of variable 5′ UTR compositions is revealed by selective ADR inhibition and is suggestive of the competition between cellular mRNAs for translation machinery under normal conditions.
Our study describes a strategy for overcoming the oncogenic effects of amplified MYCN at the level of translation. The dependence of MYCN-amplified neuroblastoma cells on increased protein synthesis together with the unique mRNA selectivity of ADRs results in preferential targeting of neuroblastoma cells versus normal tissues. Our results provide a preclinical rationale for further development of ADRs for the treatment of MYCN-amplified neuroblastoma and other transcriptionally driven cancers.
Limitations of the study
The interpretation of the combinatorial analysis of ribosome profiling and PAR-CLIP data is limited by the distinct cell line models employed for library construction (long-established vs. PDX). Although decreased tumor burden and increased survival were observed in our study, we acknowledge that testing in additional animal models would be necessary for rigorous preclinical testing of CMLD012824.
STAR★METHODS
RESOURCE AVAILABILITY
Lead contact
Further information and requests for reagents and resources should be directed to and will be fulfilled by the lead contact, Rani E. George (rani_george@dfci.harvard.edu).
Materials availability
All unique/stable reagents generated in this study are available from the lead contact with a completed Materials Transfer Agreement.
Date and code availability
Ribosome profiling data can be found in the NCBI Gene Expression Omnibus under the accession code GSE261760. PAR-CLIP data can be found under the accession code GSE261761.
R code used to perform polypurine ranking is available from the lead contact upon request.
Any additional information required to reanalyze the data reported in this paper is available from the lead contact upon request.
EXPERIMENTAL MODEL AND STUDY PARTICIPANT DETAILS
Cell lines
Human neuroblastoma (NB) cells (Kelly, IMR-32, CHP-134, NGP, LAN-6, SK-N-SH, SH-SY5Y, COG323, COG327, COG346, COG415, COG476, COG504, COG514) were obtained from the Children’s Oncology Group cell line bank and genotyped at the Dana-Farber Cancer Institute (DFCI) Core Facility. NB cells were grown in RPMI (Invitrogen) supplemented with 10% FBS and 1% penicillin/streptomycin (Invitrogen). Human lung (IMR-90) and skin fibroblasts (BJ) were kindly provided by Dr. Richard Gregory (Boston Children’s Hospital), and HEK293 cells were obtained from American Type Culture Collection. NB-9464 mouse cells were kindly obtained from Dr. To-Ha Thai at Beth Israel Deaconcess Medical Center. IMR-90, BJ and HEK293, cells were grown in DMEM (Invitrogen) supplemented with 10% FBS and 1% penicillin/streptomycin. COG cells were grown in IMEM (Invitrogen) supplemented with 1x Insulin-Transferrin-Selenium (ITS-G) (Gibco), 20% FBS and 1% penicillin/streptomycin. All cell lines were routinely tested for mycoplasma.
Mouse models
All procedures involving mice were guided by the DFCI Animal Care and Use Committee and performed under an IRB-approved protocol. All mouse experiments were performed using subcutaneous injections of 1×10⁶ cells into 4–6-week-old recipient female mice, with littermates randomly assigned to experimental groups. NB-9464 TH-MYCN murine neuroblastoma xenografts were generated in syngeneic C57BL/6J mice, while human neuroblastoma patient-derived (COG-N-415x) xenografts were generated in nude mice (NU/J). For the first MTD study, C57BL/6J mice were treated with CMLD012824 (0.1, 0.2, 0.4 mg/kg) diluted in solvent (5.2% PEG300, 5.2% Tween-80) daily for 7 days by intraperitoneal injection. After reaching assay endpoint of 12 days, livers were excised from vehicle-treated and CMLD012824 -treated (1 mg/kg) animals for WB analysis. For the second MTD study, C57BL/6J mice bearing NB-9464 tumors were randomly assigned into groups upon tumor volume reaching 100–200 mm3, with the volume being approximately equal between groups and treated with CMLD012824 (0.1, 0.2 mg/kg) diluted in solvent (5.2% PEG300, 5.2% Tween-80) three times per week for 30 days by intraperitoneal injection. For the efficacy study, nude mice bearing COG-N-415x tumors were randomly assigned to treatment groups upon tumor volume reaching 100–200 mm3 and treated with 0.2 mg/kg CMLD012824 (diluted in 5.2% PEG300, 5.2% Tween-80) or vehicle control (DMSO in 5.2% PEG300, 5.2% Tween-80) three times per week for 40 days by intraperitoneal injection. Tumor size and body weight were monitored three times per week and tumor volume was calculated using the ellipsoid formula 1/2(max diameter x min diameter2). Once tumors reached 1000 mm3, the mice were euthanized according to approved animal protocols. Tumors were either fixed in 10% neutral buffered formalin, or snap frozen and stored at −80°C until further analysis. All animal experiments were conducted according to approved protocols by IACUC.
METHOD DETAILS
Transfection
Plasmid DNA transfection was performed using Mirus Trans-IT LT1 (MIR2300) according to manufacturer’s protocol.
Compounds
Rocaglate analog compounds, including CMLD012824 (ADR-824), were provided by Dr John Porco’s laboratory at Boston University (BU). The amidino-rocaglate (ADR) CMLD012824 was synthesized at the BU-CMD according to the reported literature procedure.32
Cell viability analysis
Cells were plated in 96-well plates at a seeding density of 4 × 10³ cells/well. After 24 h, cells were treated with increasing concentrations of CMLD012824 (10 nM–10 μM). DMSO without compound served as a negative control. After 72 h incubation, cell viability was analyzed using the CellTiter-Glo Luminescent Cell Viability Assay (Promega), according to the manufacturer’s instructions. All proliferation assays were performed in biological triplicates. Drug concentrations that inhibited 50% of cell growth (IC50) were determined using a nonlinear regression curve fit using GraphPad Prism 6 software.
Fluorescence-activated cell sorting analysis (FACS)
For cell cycle analysis, cells were treated with DMSO or CMLD012824 (1 nM or 5 nM). After 72 h cells were scraped and fixed in ice-cold 70% ethanol for 1 h at −20°C. After washing with ice-cold phosphate-buffered saline (PBS), cells were treated with 100 μg/mL RNase A (Sigma-Aldrich) in combination with 50 μg/mL propidium iodide (PI, BD Biosciences) for 30 min at room temperature (RT) and then kept on ice until FACS. For EdU analysis, cells were treated with DMSO or CMLD012824 (5 nM or 10 nM) for 24 h. Cells were pulsed with 10 μM of 5-ethynyl-2′-deoxyuridine (EdU) for 2 h and subsequently collected by scraping, and stained for EdU incorporation using the Click-iT EdU Alexa Fluor 647 Flow Cytometry Assay Kit (Thermo Fisher) according to manufacturer’s protocol. After EdU staining, cells were resuspended in Click-iT saponin-based permeabilization and wash reagent (Thermo Fisher) with 50 μg/mL propidium iodide (PI, BD Biosciences) and 100 μg/mL RNase A (Sigma-Aldrich) for 30 min at room temperature (RT) and then kept on ice until FACS. All samples were analyzed on an LSR Fortessa (Becton Dickinson) using FACSDiva software (Becton Dickinson). A minimum of 50,000 events was counted per sample and used for further analysis. Data were analyzed using FlowJo software.
Apoptosis analysis
Cells were plated in 96-well plates at a seeding density of 4 × 10³ cells/well. After 24 h, cells were treated with increasing concentrations of CMLD012824 and analyzed using a RealTime-Glo Annexin V Apoptosis and Necrosis Assay kit (Promega JA1011) at 1 to 72 h. Annexin V binding and the loss of membrane integrity were monitored in real-time by luminescence and fluorescence respectively, according to the manufacturer’s protocol.
Western blotting
Cells were collected by scraping in cold PBS and lysed on ice in NP40 buffer (Invitrogen) supplemented with complete protease inhibitor cocktail (Roche), PhosSTOP phosphatase inhibitor cocktail (Roche) and PMSF (1 mM). Tumor and liver samples were prepared by washing in cold PBS, homogenizing in supplemented NP40 buffer (8k rpm, 3 s pulses, 3–5x), and incubating on ice for 30 min. All lysates were cleared by centrifugation at 13.2k rpm for 20 min at 4°C. Protein concentrations were determined with the Biorad DC protein assay kit (Bio-Rad). Whole-cell protein lysates were resolved on 4%–12% Bis-Tris gels (Invitrogen) and transferred to nitrocellulose membranes (Bio-Rad). After blocking nonspecific binding sites for 1 h using 5% dry milk (Sigma-Aldrich) in Tris-buffered saline (TBS) supplemented with 0.2% Tween 20 (TBS-T), membranes were incubated overnight with primary antibody at 4°C. Chemiluminescent detection was performed with the appropriate secondary antibodies. Protein levels in western blots were quantified using ImageJ.56
Metabolic labeling
Cells were incubated in L-methionine-free RPMI (A1451701) for 1 h prior to start of experiment. After methionine-free incubation, L-azidohomoalanine (Life Technologies C10102) was added according to the manufacturer’s instructions, and cells were treated with vehicle (DMSO) or CMLD012824 (1 nM, 5 nM) for 1 h. Cells were harvested by scraping in cold PBS and prepared for 1-D gel analysis using Click-IT L-azidohomoalanine protein labeling reagents (Life Technologies C10102, C10276, B10185) according to manufacturer’s instructions. Following SDS-PAGE electrophoresis and electrotransfer to nitrocellose membranes, membranes were blocked for 1 h in 5% dry milk in TBS-T (Tris-buffered saline (TBS) supplemented with 0.2% Tween 20). Biotinylated protein was visualized with NeutrAvidin Protein HRP (Thermo 31001) and chemiluminescent detection. Signal was quantified using ImageJ.56
Immunofluorescence
Cells were washed with cold PBS and fixed in 4% paraformaldehyde for 5 min, then incubated in cold 100% methanol for 5 min, and washed with cold PBS for 5 min. Cells were permeabilized with Triton X-100 0.1% for 5 min, washed 3x with cold PBS for x mins, and blocked for 1 h in 1% bovine serum albumin (BSA), 0.3M glycine, and 0.1% Tween 20 in PBS. Cells were incubated overnight with primary antibodies in blocking buffer, washed 3x with blocking buffer, incubated 1 h with secondary fluor-conjugated antibodies, washed 3 x with blocking buffer, and mounted on slides (25 × 75 × 1.0 mm) using Dapi Fluoromount G (OB010020). Slides were dried overnight and imaged on a Zeiss Imager Z1 Microscope.
RT-qPCR
Total RNA was isolated with the RNAeasy Mini kit (QIAGEN) or Trizol (Thermo 15596–026) according to manufacturer’s protocol. 200 ng of purified RNA was reverse transcribed using SuperScript IV VILO master mix (Invitrogen) following the manufacturer’s protocol. Quantitative PCR was carried out using the QuantiFast SYBR Green PCR kit (Qiagen) and analyzed on an Applied Biosystems StepOne Real-Time PCR System (Life Technologies). Each individual biological sample was qPCR-amplified in technical triplicate and normalized to an internal control (input, GAPDH or other according to individual assay). Relative quantification was calculated according to the -ΔΔCt relative quantification method. Error bars indicate ±SD of three replicates. Primer sequences are available on request.
Chromatin immunoprecipitation (ChIP)
Dynabeads were prepared 24 h in advance by washing 50 μL beads per sample in 500 μL blocking buffer (PBS with 0.5% BSA) and incubating overnight at 4°C in 250 μL blocking buffer with 5 μg of antibody of interest or normal rabbit IgG. Bound beads were washed 3x with blocking buffer and resuspended in 100 μL blocking buffer. Cells were grown on 15 cm plates, collected by scraping in 10 mL cold PBS (1×10⁸ cells), crosslinked with 1% formaldehyde for 10 min at RT, quenched with 0.125 M glycine, washed 2x in cold PBS and flash frozen in liquid nitrogen. Cell pellets were thawed, resuspended in 5 mL LB1 (50mM HEPES-KOH pH7.5, 140mM NaCl, 1mM EDTA, 10% glycerol, 0.5% NP-40, 0.25% Triton X-100, protease inhibitor cocktail (1 tablet per 10mL)), and incubated with rotation at 4°C for 10 min. Cells were pelleted at 4k rpm for 3 min at 4°C, resuspended in LB2 (10mM Tris-HCl, pH8.0, 200mM NaCl, 1mM EDTA, 0.5mM EGTA, protease inhibitor cocktail (1 tablet per 10mL)), and incubated with rotation at 4°C for 10 min. Cells were pelleted at 4k rpm for 3 min at 4°C, resuspended in 2 mL sonication buffer (50mM HEPES pH7.5, 140mM NaCl, 1mM EDTA, 1mM EGTA, 1% Triton X-100, 0.1% Na-deoxycholate, 0.2% SDS, protease inhibitor cocktail (1 tablet per 10mL)). Cells were sonicated on ice for 30 min total time (pulse on: 30 s, pulse off: 1 min, level 5). Sonicated samples were centrifuged at 4k rpm for 10 min at 4°C, supernatant collected and diluted with equal volume sonication buffer 2 (50mM HEPES pH7.5, 140mM NaCl, 1mM EDTA, 1mM EGTA, 1% Triton X-100, 0.1% Na-deoxycholate, protease inhibitor cocktail (1 tablet per 10mL)). 50 μL of each sample was retained for input control. 1 mL of sheared chromatin was mixed with 100 μL prepared antibody-bound beads and incubated at 4°C overnight with rotation. Beads were collected on a magnetic rack and washed 2× with sonication buffer 2 for 5 min at 4°C, 1x with sonication buffer 2 with high salt (500mM NaCl), 1x with LiCl buffer (20mM Tris pH8.0, 1mM EDTA, 250mM LiCl, 0.5% NP-40, 0.5% Na-deoxycholate), 1x with Tris-EDTA pH 8.0, and resuspended in 200 μL elution buffer (50mM Tris-HCl pH8.0, 10mM EDTA pH8.0, 1% SDS). Chromatin was eluted from beads at 65°C for 40 min with shaking, cleared on a magnetic rack, 12 μL 5M NaCl was added per sample, and samples were incubated at 65°C overnight to reverse crosslinks. The samples were then diluted 1:1 with Tris-EDTA pH 8.0, incubated with 100 μg/mL RNAse A at 37°C for 1 h, then incubated with 50 μg/mL proteinase K, 5 mM CaCl2 at 55°C for 30 min. DNA was extracted with 500 μL phenol:chloroform:isoamyl alcohol (EMD 516726–1SET), precipitated with 1.5 μL of GlycoBlue (Thermo AM9515), 16 μL 5M NaCl, and 1 mL 100% ice-cold ethanol at −20°C, centrifuged at 13k rpm for 20 min at 4°C, washed with 75% ethanol, and resuspended in water.
ChIP-seq
ChIP was carried out as previously described.5 Purified ChIP DNA was used to prepare Illumina multiplexed sequencing libraries using the NEBNext Ultra II DNA Library Prep kit and the NEBNext Multiplex Oligos for Illumina (New England Biolabs) according to the manufacturer’s protocol. Libraries were multiplexed and sequenced using an Illumina NS500 Single-End 75bp SE75 sequencer.
RNA immunoprecipitation
MYCN-amplified (Kelly) and non-amplified (SK-N-AS) neuroblastoma cells were grown to 80% confluency and treated with DMSO or CMLD012824 (10 nM) for 1 h. harvested by scraping in ice-cold PBS followed by centrifugation at 500 x g for 5 min at 4°C. Cell pellets were resuspended in 1x PLB (10x PLB: 1 M KCl, 50 mM MgCl2, 100 mM HEPES-NaOH pH 7.5, 5% NP-40, Roche protease and phosphatase inhibitors (1 tab each per 10 mL)) with 200U/mL RNAsin (Promega) (3x pellet volume) and incubated on ice for 30 min. Cell lysates were centrifuged at 13k rpm for 10 min at 4°C and supernatants transferred to low-binding nuclease-free tubes. DynaBeads Protein G magnetic beads (Invitrogen 10004D) were prepared 24 h in advance by washing 2x in NT-2 buffer (5x NT-2: 250 mM Tris-HCl pH 7.4, 750 mM NaCl, 5 mM MgCl2, 0.25% NP-40) and incubating overnight with 5 μg antibody of interest or IgG control per 50 μL of beads per sample. Bound beads were washed 4x with NT-2 buffer on a magnetic rack, resuspended with 500 μL of NET-2 buffer (1x NT2 buffer supplemented with 20mM EDTA pH 8, 200U/mL Superase-In (AM2696)) plus lysate sample, and incubated overnight at 4°C with rotation. Bound samples were washed 4x with 500 μL NT-2 buffer, resuspended in 100 μL NT-2 Buffer and divided for RNA and protein isolation. RNA samples were extracted using Trizol (Thermo 15596–026) according to manufacturer’s protocol. RT-qPCR was performed as described above. Protein samples were mixed with NuPAGE LDS Sample Buffer (Thermo NP0007) according to manufacturer’s protocol, boiled for 10 min at 95°C, resolved on SDS-PAGE gels and analyzed by western blotting.
Ribosome profiling
Cells were treated with DMSO or CMLD012824 (10 nM) for 1 h. Ribosome profiling libraries were prepared from three biological replicates per cell line according to previously described methods.42 Total RNA was extracted from matched samples using miRNeasy RNA Extraction kit (QIAGEN) and ERCC RNA Spike-In (Life Technologies 4456740) was added according to manufacturer’s instructions. RNA sequencing libraries prepared with the Illumina TruSeq stranded mRNA kit (Illumina) following the manufacturers’ instructions at the DFCI core facility. All samples were analyzed for nucleotide length and concentration (Bioanalyzer) and sequenced using an Illumina NS500 Single-End 75bp SE75 sequencer.
PAR-CLIP
COG-N-415x PDX-derived MYCN-amplified neuroblastoma cells were grown to 80% confluency in biological triplicate on 15 cm plates, with 4-thiouridine (200 μM) (Sigma Aldrich T4509) added directly to the cell culture medium 16 h before crosslinking. Cells were treated with DMSO or CMLD012824 (10 nM) for 1 h, washed with ice-cold PBS, and irradiated uncovered with 0.4 J/cm2 of 365nm UV light using Alpha Innotech AIML-26 Transilluminator. Cells were harvested by scraping and centrifugation at 2.5k rpm for 5 min at 4°C. Cell pellets were resuspended in 1x PLB (10x PLB: 1 M KCl, 50 mM MgCl2, 100 mM HEPES-NaOH pH 7.5, 5% NP-40, Roche protease and phosphatase inhibitors (1 tab each per 10 mL)) with 200U/mL RNAsin (Promega) (3x pellet volume) and incubated on ice for 30 min. Lysates were cleared by centrifugation at 12k x g for 10 min at 4°C and 10% input was saved for total mRNA sequencing library preparation. Samples were treated with RNase T1 (1 U/μl) in a water bath for 15 min at 22°C, cooled 5 min on ice, and >1 U/ul Superase-In (AM2696) was added to quench RNAse T1. DynaBeads Protein G magnetic beads (Life Technologies 10004D) were prepared 24 h in advance by washing 2x in NT-2 buffer (5x NT-2: 250 mM Tris-HCl pH 7.4, 750 mM NaCl, 5 mM MgCl2, 0.25% NP-40) and incubating overnight with 10 μg antibody (eIF4A1 ab31217) or IgG control per 100 μL of beads per sample. Samples were incubated with beads in 500 μL total volume, overnight at 4°C with rotation. Samples were washed 4x by resuspending the beads in NT-2 buffer and incubating for 5 min with rotation at 4°C, and resuspended in 250uL NT2 buffer, with 10 μL reserved to check IP efficiency. Samples were treated a second time with RNaseT1 (10 U/μl) at 22°C for 20min with shaking, cooled on ice for 5 min, and washed 3x with NT-2 buffer. Bound beads were resuspended in 1 volume of dephosphorylation buffer (50 mM Tris-HCl, pH 7.9, 100 mM NaCl, 10 mM MgCl2, 1 mM DTT) with Calf-intestinal phosphatase (CIP) (0.5 U/μl) and incubated for 10 min at 37°C with shaking. Beads were washed twice in 1 mL of phosphatase wash buffer (50 mM Tris-HCl, pH 7.5, 20 mM EGTA, 0.5% (v/v) NP-40), 2x in polynucleotide kinase (PNK) buffer without DTT (50 mM Tris-HCl, pH 7.5, 50 mM NaCl, 10 mM MgCl2), and resuspended in 50 μL of PNK buffer (50 mM Tris-HCl, pH 7.5, 50 mM NaCl, 10 mM MgCl2, 5 mM DTT). Samples were treated with ATP (1mM) and T4 PNK (1 U/μl) and incubated for 60 min at 37°C with shaking, washed 5x with 800 μL of PNK buffer without DTT and resuspended in 100 μL of PNK buffer without DTT. 10 μL of sample was saved for 3′ -biotin labeling for visualization using Pierce RNA 3′ End Biotinylation Kit (Life Technologies 20160) according to manufacturer’s protocol. Samples were collected on a magnetic rack, washed 3× with NT-2 buffer, resuspended in 70 μL of DEPC-treated SDS-PAGE loading buffer (NP0007) and heated for 5 min at 95°C with shaking. Beads were collected on a magnetic rack, the supernatants transferred to new tubes, resolved on a Bis-Tris 4–12% PAGE gel, and transferred to a nitrocellulose membrane (60V, 2h or 85V, 1h15min). The membrane was cut at the region determined by the 3′-biotin signal in corresponding samples using a Chemiluminescent Nucleic Acid Detection Module (Thermo 89880) according to manufacturer’s protocol. Membrane slices were treated with DNase I (5 U) in 1X DNase I buffer at 37°C for 10 min, followed by proteinase K (4 μg/μL) digestion in PK buffer (100mM Tris-HCl pH 7.4, 50mM NaCl, 10mM EDTA) for 20 min at 37°C with shaking, and incubated in 200 μL of PK-urea buffer (PK buffer with 7M urea) for 20 min at 37°C with shaking. RNA was extracted with 400 μL Acid Phenol:ChCl3 (pH4.3~4.7) and precipitated with 1.5 μL of GlycoBlue (Thermo AM9515), 40 μL NaAcO3 (pH 5.5), and 1 mL 100% ice-cold ethanol at −80°C. Samples were centrifuged at 12k x g for 60 min, washed 2x with 75% EtOH, resuspended in DEPC water, and submitted for small RNA library construction at the DFCI core facility. Total RNA was extracted from matched samples using miR-Neasy RNA Extraction kit (QIAGEN). RNA sequencing libraries were processed for rRNA removal (QiaSelect) and prepared with the Illumina TruSeq stranded mRNA kit (Illumina) following the manufacturers’ instructions at DFCI core facility. All samples were analyzed for nucleotide length and concentration (Bioanalyzer) and sequenced on a NovaSeq 6000 sequencer. Two replicates per condition passed quality control (Bioanalyzer) and were used for downstream analysis.
Sucrose gradient fractionation
MYCN-amplified (Kelly) neuroblastoma cells were grown to 80% confluency and treated with DMSO or CMLD012824 (10 nM) for 1 h. Cells were harvested by scraping in ice-cold PBS and centrifugation at 500 x g for 5 min at 4°C. Cell pellets were resuspended in 1x PLB (10x PLB: 1 M KCl, 50 mM MgCl2, 100 mM HEPES-NaOH pH 7.5, 5% NP-40, Roche protease and phosphatase inhibitors (1 tab each per 10 mL)) with 200U/mL RNAsin (Promega) (3x pellet volume) and incubated on ice for 30 min. Cell lysates were centrifuged at 13k rpm for 10 min at 4°C and supernatants transferred to low-binding nuclease-free tubes. Cellular lysates were sedimented on 10–50% sucrose gradients (containing 20 mM HEPES pH 7.5, 150 mM KOAc, 2.5 mM MgOAc, 1 mM DTT, 0.2 mM spermidine, 100 μg/mL cycloheximide) for 2 h at 40,000 g at 4°C using an SW41 rotor (Beckman Coulter). Gradients were fractionated using Teledyne Isco Tris Peristaltic Pump and fractions were collected and pooled according to the UV trace. RNA was extracted using an equal volume of phenol:chloroform pH 6, precipitated at −20°C overnight in 2x volume 100% EtOH, 2.7 M NaOAc, and 10 μg/mL GlycoBlue (Thermo AM9515), washed 2x in 70% EtOH and resuspended in RNase free water.
In vitro transcription
RNAs were transcribed from 1 μg of PCR-amplified templates using T7 RNA polymerase (NEB M0251S) for 2 h at 37°C according to manufacturer’s protocol. Reactions were treated with RQ1 DNAse (Promega M6101) for 20 min at 37°C, precipitated using 2x volume 7.5 M LiCl/50 mM EDTA at −20°C for 1 h, washed 2x in 70% EtOH, and resuspended in RNase free water. RNAs were capped using the Vaccinia capping system (NEB M2080S) according to manufacturer’s protocol, in the presence of 20 U Superase-In (AM2696), extracted with an equal volume of phenol:chloroform pH 6, precipitated at −20°C overnight in 2x volume 100% EtOH, 2.7 M NaOAc, and 10 μg/mL GlycoBlue Coprecipitant (Thermo AM9515), washed 2x in 70% EtOH and resuspended in RNase-free water. RNAs were capped co-transcriptionally during the T7 RNA polymerase reaction by decreasing GTP to 0.125 mM with addition of 2.5 mM cap analog (G-cap, NEB S1407S; A-cap, NEB S1406S).
In vitro translation
Rabbit reticulocyte lysates (RRL) (Promega L4960) were treated with micrococcal nuclease (NEB M0247S) and 0.8 mM CaCl2 for 10 min at 25°C. Treatment was stopped with 3.2 mM EGTA. Treated RRL was incubated with 400 ng (or as indicated) T7-transcribed RNAs (5′UTR fused to luciferase) in the presence of DMSO or CMLD012824 at the indicated concentrations, according to manufacturer’s instructions on supplemental amino acids and reaction buffer. Reactions were incubated for 1.5 h at 30°C and luciferase signal was measured using the Dual-Glo Luciferase Assay System (Promega E2920).
Cloning
Endogenous 5′UTR sequences were identified from Ensembl and RefSeq and cloned into the pcDNA4 vector backbone with Renilla or Firefly luciferase using restriction cloning. MYCN 5′ DEL and 3′ DEL deletion mutants were generated by restriction-free cloning using plasmid PCR amplification and overhang ligation using the In-Fusion Cloning Kit (Takara Bio 638910) according to manufacturer’s protocol. All 5′UTR sequences are available in Table S2. Primer sequences are available upon request. MYCN coding sequence was inserted in frame into the pEF1a-puro vector for mammalian expression.
Immunohistochemistry (IHC)
Staining was performed by Applied Pathology Systems (APS) (Shrewsbury, MA). Formalin-fixed paraffin-embedded (FFPE) tumors were stained with H&E, Cleaved Caspase 3, Ki67, or MYCN. For H&E staining, fixed tissues were dehydrated by passing through a series of ethanol solutions of increasing concentration (70–100%). Following dehydration, the tissues were cleared with xylene prior to paraffin embedding to form paraffin tissue blocks. Each FFPE block was sectioned with the thickness of 5 μm and one section was loaded to a histology glass slide. The slides were heated at 60°C for 1 h in an oven before H&E staining in the autostainer (Leica Autostainer XL). IHC was performed using a detection kit (Vector Laboratories, MP-7601) on a Dako autostainer. Paraffin sections were dewaxed, rehydrated, and subjected to antigen retrieval in Tris base buffer, pH 9.0, in a pressure cooker. Slides were blocked with BloxAll blocking buffer and 2.5% horse serum respectively prior to a 1-h incubation with anti-Ki67 antibody (Abcam, ab16667) at 1:100 dilution, anti-cleaved caspase 3 antibody (Biocare CP229A) at 1:250 dilution, or anti-MYCN antibody (Cell Signaling Technology, D4B2Y) at 1:500 dilution. Subsequently, the sections were incubated with anti-rabbit Amplifier antibody and ImmPress Excel polymer reagent sequentially before applying DAB chromogen. The slides were then counterstained with hematoxylin, followed by dehydration. Slides were scanned at APS and resulting images were analyzed with QuPath.57
QUANTIFICATION AND STATISTICAL ANALYSIS
Computational analysis
Polypurine ranking analysis
Highly variable genes were identified by arraying and binning all transcripts from GSE62564 by expression level and calculating the variance coefficient using Giotto in R, as previously described.37 Polypurine ranking was performed in R using RefSeq sequences to extract 5′UTR sequences and rank by [AG]n motifs normalized to 5′UTR length. 5′UTR polypurine rank, GC rank, and additional information is available in Table S1. Code available upon request.
Gene expression analysis of primary tumor dataset
RNA sequencing data in reads per million (RPM) was downloaded from Gene Expression Omnibus (GEO), accession GSE62564. Hierarchical clustering was performed in R on data pre-ranked by MYCN or c-MYC expression. Heatmap visualization of hierarchical clustering with Z-scores representing standard deviation from the mean were calculated using R package heatmap.2. The pairwise correlation matrix was generated using R package corrplot (v0.92).58 Gene expression data (GSE62564) for highly variable genes from Giotto analysis was used to calculate fold changes per gene between the top and bottom 30 MYCN expressing tumors, ranked by MYCN expression. Data was divided into 10 equally sized bins based on expression (bin 1 – lowest, bin 10 – highest) or fold change (bin 1 [low] – no change, bin 10 [high] – highest positive change). Analysis of the entire dataset revealed that the majority of the genes that fell within the average range of values for expression and fold-change exhibited average polypurine content and therefore were omitted from the Figure 1 (Figures 1H and 1I) plots for visual clarity, with the full dataset plots included in Figure S1 (Figures S1F, and S1H). Analysis of genes correlated with eIF4A1 expression in primary tumors (GSE62564) was performed using R2 Genomics Analysis and Visualization Platform (http://r2.amc.nl).
ChIP-seq analysis
All ChIP-seq data were aligned using the short-read aligner Bowtie (v0.12.7)59 to build version GRCh37 of the human genome. To visualize ChIP-seq tracks, reads were extended by 160 bases, converted into tdf files using igvtools (v 2.2.1)60 and visualized in IGV.61 ChIP-seq peaks were detected using a peak-finding algorithm, MACS (v1.4.2)62 using the default P-value threshold of enrichment of 1 × 10⁻⁵ for all datasets. Active enhancers, ranked according to the magnitude of the H3K27ac signal, were defined as regions of ChIP-seq enrichment for H3K27ac and H3K4me1 outside of promoters. The ROSE algorithm (https://bitbucket.org/young_computation/rose)63,64 was used to identify super-enhancers. Enhancers containing peaks within 12.5kb of one another were stitched together and ranked by their difference in H3K27ac signal vs. input signal.
Ribosome profiling analysis
Raw Illumina reads from ribosome profiling and matched total RNA sequencing libraries were collapsed and adapters were trimmed using fastx_collapser from the FASTX Toolkit. Bowtie265 was used to remove rRNA reads, TopHat266 to align reads to the human genomes (GRCh37, GRCh38), Cufflinks v2.2.1 and Cuffdiff v2.2.167 to extract and merge raw read counts of the biological replicates (N = 3). Samtools68 was used to prepare data for genome browser visualization in IGV.61 Anota2seq in R was used for differential translation efficiency calculation.43 The Anota2seq package is designed to analyze transcriptome-wide translation data (including ribosome profiling) and combines analysis of partial variance and the random variance model to normalize the input data, analyze changes in translational efficiency, and account for translational “buffering” (i.e., translational efficiency changes as a function of changes in mRNA levels). The ribo-seq data was normalized against total RNA reads, which are not affected by a 1-h ADR treatment as evident from the Anota2seq differential analysis of total RNA reads in the control-treated samples, as well as External RNA Controls Consortium (ERCC) ERCC92 synthetic RNA spike-in control sequences. A transcript with an absolute log2 fold-change ≥1 and a P-value ≤0.1 was considered significant.
PAR-CLIP analysis
The raw PAR-CLIP and matched total RNA sequencing reads were first processed for adapter trimming and rRNA removal as described for ribosome profiling. The data analysis was performed following the pipeline described by Jens.46 Identical read copies were collapsed into distinct reads and aligned to the human genome (GRCh37) with Burrows-Wheeler Alignment (BWA) v0.7.1769 allowing for up to one edit distance (mismatch, insertion or deletion). The unaligned reads were removed and aligned reads were sorted into a BAM formatted file with Samtools v1.13.68 The clusters on the reference genome that eIF4A1 bound to were then identified with the pipeline-provided script that collects reads contiguously covering a section of the reference genome while screening for cross-link conversions. The identified clusters involve at least two distinct read sequences and at least one cross-link conversion. The cluster identification analysis was performed for each individual sample; also replicate consensus was taken into account, such that a cluster is reported only if it is called in both replicates. The false discovery rates (FDRs) of mapping for each sample and replicate consensus were assessed as per the pipeline by aligning the sequence reads to a decoy genome. A filter was applied to retain only those clusters between the length of 20–1000 nucleotides. This resulted in FDR ≤0.05 in every case. Clusters were annotated from Gencode (v19 annotation) and Ensembl (GRCh37.87 annotation) with genomic features (mRNA, exon, CDS, 5′ -UTR, 3′ -UTR, start codon and stop codon) and types of RNA (mRNA, lincRNA, miRNA, snoRNA, snRNA and rRNA) with intersect function in BEDTools v2.30.0.70 Mapping of gene and transcript IDs of the clusters to gene symbols was carried out with biomaRt package in Bioconductor.71 Metagene2 in R was used to prepare metagene plots of 5′UTR, CDS, and 3′ UTR consensus distribution of PAR-CLIP aligned reads per million (RPM) for two biological replicates per condition. For differential binding analysis, trimmed reads were aligned to human genome (GRCh37) using Bowtie v1.0.065 and Cuffdiff v2.2.167 was used to extract and merge raw read counts of the biological replicates (N = 2). Cuffdiff results were then used in the Anota2seq pipeline43 to normalize against total RNA to quantify changes in eIF4A1 binding by mRNA between vehicle and CMLD012824-treated replicates (N = 2).
Enrichment analysis
GSEA analysis was performed on pre-ranked gene lists (polypurine analyses) and enriched pathway terms meeting a false discovery rate cutoff (FDR ≤0.1) were considered significant. Functional enrichment for gene sets derived from PAR-CLIP and ribosome profiling differential binding and translation regulation analyses was performed by Enrichr. All Gene ontology, Hallmarks pathway, KEGG pathway, Elsevier collection terms were ranked based on the Enrichr combined score. Enrichment of gene sets was considered significant for an adjusted P-value ≤0.01.
Motif enrichment analysis
Sequence motif enrichment analysis was performed using MEME Suite.48 BEDTools70 getfasta function was used to extract fasta sequences from 5′UTR, CDS, and 3′ UTR regions corresponding to RNA sets of interest and Meme Motif discovery tool in MEME Suite was used to identify enriched motifs (Parameters: classic mode, site distribution = “any number of repetitions”, 0-order background model, minimum width = 4, maximum width = 16). Significant motifs were considered having E-value (P-values adjusted to motif frequency) < 0.01.
Integrated analysis of ribosome profiling and PAR-CLIP
COG-N-415x and Kelly cells were chosen for the comparison due to both having amplification of MYCN. The first integrative analysis identified the set of mRNAs with eIF4A1 binding clusters in ADR-824-treated PDX COG-N-415x cells (identified through PAR-CLIP) that exhibited changes in translational efficiency in ADR-824-treated Kelly cells (identified through ribo-seq). The second analysis integrated ribosome-associated mRNA changes with eIF4A1 PAR-CLIP binding changes from ADR-824-treated cells (both derived from respective Anota2Seq analyses in R).
Statistical analysis
Statistical methods are listed in the figure legend and/or in the corresponding STAR Methods. All quantitative analyses are expressed as the mean ± S.D. of three biological replicates, unless stated otherwise. Boxplots within the violin plots defined by center lines (medians), box limits (the interquartile range between 25th and 75th percentiles), whiskers (minima and maxima). Significance determined by Student’s t-test. Statistical significance for pairwise comparisons was determined using two-sided unpaired Student’s t-test, unless stated otherwise. Survival analysis was performed using the Kaplan–Meier method and differences between groups calculated by the two-sided log rank test and the Bonferroni correction method. Tumor volume comparisons for the xenograft studies were analyzed by Welch’s test for overall efficacy analysis and Student’s t-test for individual days. Statistical comparisons of distributions of fold changes for the ribosome profiling and PAR-CLIP data were derived from Anota2Seq analysis in R, and for the ChIP-seq data from MACS. Ribosome profiling data are based on three biological replicates per condition; PAR-CLIP data based on two biological replicates per condition. ChIP–seq data are based on at least two independent experiments. GO enrichment was calculated using Fisher exact test in Enrichr.
Supplementary Material
KEY RESOURCES TABLE
| REAGENT or RESOURCE | SOURCE | IDENTIFIER |
|---|---|---|
| Antibodies | ||
|
| ||
| Mouse monoclonal anti-CCNA2 | Cell Signaling Technology | Cat#4656 RRID:AB_2071958 |
| Mouse monoclonal anti-CCNE1 | Cell Signaling Technology | Cat#4129 RRID:AB_2071200 |
| Rabbit polyclonal anti-CCND1 | Cell Signaling Technology | Cat#2922 RRID:AB_2228523 |
| Rabbit monoclonal anti-CDK4 | Cell Signaling Technology | Cat#12790 RRID:AB_2631166 |
| Rabbit monoclonal anti-CDK6 | Cell Signaling Technology | Cat#13331 RRID:AB_2721897 |
| Rabbit monoclonal anti-eIF4A | Cell Signaling Technology | Cat#2013 RRID:AB_2097363 |
| Rabbit polyclonal anti-eIF4E | Cell Signaling Technology | Cat#9742 RRID:AB_823488 |
| Rabbit polyclonal anti-eIF4G | Cell Signaling Technology | Cat#2498 RRID:AB_2096025 |
| Rabbit monoclonal anti-4E-BP1 | Cell Signaling Technology | Cat#9644 RRID:AB_2097841 |
| Rabbit monoclonal anti-GAPDH | Cell Signaling Technology | Cat#2118 RRID:AB_561053 |
| Rabbit monoclonal anti-c-Jun | Cell Signaling Technology | Cat#9165 RRID:AB_2130165 |
| Rabbit monoclonal anti-N-Myc | Cell Signaling Technology | Cat#51705 RRID:AB_2799400 |
| Rabbit monoclonal anti-c-Myc | Cell Signaling Technology | Cat#13987 RRID:AB_2631168 |
| Rabbit monoclonal anti-cleaved-PARP | Cell Signaling Technology | Cat#5625 RRID:AB_10699459 |
| Rabbit monoclonal anti-PTBP1 | Cell Signaling Technology | Cat#57246 RRID:AB_2799528 |
| Mouse monoclonal anti-CKS2 | Thermo Fisher | Cat#37–0300 RRID:AB_2533291 |
| Rabbit polyclonal anti-RPS19 | Thermo Fisher | Cat#A304–002A RRID:AB_2620351 |
| Rabbit polyclonal anti-XRN2 | Thermo Fisher | Cat#A301–103A RRID:AB_2218876 |
| Rabbit polyclonal anti-eIF3B | Thermo Fisher | Cat#A301–761A RRID:AB_1210995 |
| Rabbit polyclonal anti-eIF4A1 | Abcam | Cat#ab31217 RRID:AB_732122 |
| Rabbit polyclonal anti-PHOX2B | Abcam | Cat#ab227719 |
| Goat anti-Rabbit IgG Cross-Adsorbed Secondary Antibody, Alexa Fluor 488 |
Invitrogen | Cat#A11008 RRID:AB_143165 |
|
| ||
| Bacterial and virus strains | ||
|
| ||
| Stbl3 E. coli | Life Technologies | Cat# C7373–03 |
| DH5α E. coli | Thermo Fisher | Cat# 18265017 |
|
| ||
| Chemicals, peptides, and recombinant proteins | ||
|
| ||
| CMLD012824 | Center for Molecular Discovery, Boston University | N/A |
| RNase A | Roche | Cat#10109142001 |
| Propidium Iodide Solution | BD Biosciences | Cat#556463 |
| PhosSTOP phosphatase inhibitor cocktail | Roche | Cat#4906845001 |
| cOmplete protease inhibitor cocktail | Roche | Cat#11697498001 |
| L-azidohomoalanine | Invitrogen | Cat#C10102 |
| NeutrAvidin Protein HRP | Thermo Fisher | Cat#31001 |
| Superase-In | Thermo Fisher | Cat# AM2696 |
| ERCC RNA Spike-In Mix | Life Technologies | Cat#4456740 |
| Cycloheximide | Sigma Aldrich | Cat#01810 |
| Turbo DNAse | Invitrogen | Cat#AM2238 |
| SYBR Gold | Invitrogen | Cat#S11494 |
| T4 polynucleotide kinase | New England Biolabs | Cat# M0201S |
| T4 RNA ligase 2, truncated | New England Biolabs | Cat# M0242S |
| SuperScript III | Invitrogen | Cat# 18080–093 |
| Phusion polymerase | New England Biolabs | Cat# M0530S |
| Ficoll 400, BioXtra for molecular biology | Sigma Aldrich | Cat#F2637 |
| CircLigase | Epicentre | Cat#CL4111K |
| 4-Thiouridine | Sigma Aldrich | Cat# T4509 |
| RNAsin | Promega | Cat#N2111 |
| RNAse T1 | Invitrogen | Cat# AM2283 |
| Calf-intestinal alkaline phosphatase | New England Biolabs | Cat# M0290S |
| DNase I | New England Biolabs | Cat# M0303S |
| Proteinase K | Roche | Cat# 03115879001 |
| GlycoBlue | Invitrogen | Cat# AM9515 |
| T7 RNA polymerase | New England Biolabs | Cat# M0251S |
| RQ1 DNAse | Promega | Cat# M6101 |
| Vaccinia capping system | New England Biolabs | Cat# M2080S |
| G(5′)ppp(5′)G RNA Cap Structure Analog | New England Biolabs | Cat# S1407S |
| G(5′)ppp(5′)A RNA Cap Structure Analog | New England Biolabs | Cat# S1406S |
| Micrococcal nuclease | New England Biolabs | Cat# M0247S |
|
| ||
| Critical commercial assays | ||
|
| ||
| CellTiter-Glo Luminescent Cell Viability Assay | Promega | Cat#G7573 |
| QIAamp DNA mini Kit | Qiagen | Cat#51304 |
| Trans-IT LT1 Transfection Reagent | Mirus | Cat#MIR2300 |
| Click-iT EdU Alexa Fluor 647 Flow Cytometry Assay Kit | Invitrogen | Cat#C10424 |
| RealTime-Glo Annexin V Apoptosis and Necrosis Assay kit | Promega | Cat#JA1011 |
| Click-IT L-azidohomoalanine protein labeling kit | Invitrogen | Cat#C10276 |
| RNAeasy Mini kit | Qiagen | Cat#74104 |
| SuperScript IV VILO master mix | Invitrogen | Cat# 11756050 |
| QuantiFast SYBR Green PCR kit | Qiagen | Cat# 204156 |
| Dynabeads Protein G | Invitrogen | Cat# 10004D |
| miRNeasy RNA Extraction kit | Qiagen | Cat# 217084 |
| Illumina TruSeq stranded mRNA kit | Illumina | Cat# 20020595 |
| DC protein assay kit | Bio-Rad | Cat# 500–0111 |
| Pierce RNA 3′ End Biotinylation Kit | Thermo Scientific | Cat# 20160 |
| Chemiluminescent Nucleic Acid Detection Module | Thermo Scientific | Cat#89880 |
| Rabbit reticulocyte lysate kit | Promega | Cat# L4960 |
| Dual-Glo Luciferase Assay System | Promega | Cat# E2920 |
| In-Fusion Cloning Kit | Takara Bio | Cat#638910 |
|
| ||
| Deposited data | ||
|
| ||
| Ribosome profiling dataset | This paper | GSE261760 |
| PAR-CLIP dataset | This paper | GSE261761 |
|
| ||
| Experimental models: Cell lines | ||
|
| ||
| Human: Kelly | Children’s Oncology Group | RRID:CVCL_2092 |
| Human: CHP-134 | Children’s Oncology Group | RRID:CVCL_1124 |
| Human: IMR-32 | Children’s Oncology Group | RRID:CVCL_0346 |
| Human: NGP | Children’s Oncology Group | RRID:CVCL_214 |
| Human: SH-SY5Y | Children’s Oncology Group | RRID:CVCL_0019 |
| Human: SK-N-AS | Children’s Oncology Group | RRID:CVCL_1700 |
| Human: SK-N-SH | Children’s Oncology Group | RRID:CVCL_0531 |
| Human: CHLA-20 | Children’s Oncology Group | RRID:CVCL_6602 |
| Human: LAN-6 | Children’s Oncology Group | RRID:CVCL_1363 |
| Human: BJ-2 | Boston Children’s Hospital | N/A |
| Human: IMR-90 | Boston Children’s Hospital | RRID:CVCL_0347 |
| Human: HEK293 | American Type Culture Collection | RRID:CVCL_0045 |
| Human: COG-N-323 | Children’s Oncology Group | N/A |
| Human: COG-N-327 | Children’s Oncology Group | N/A |
| Human: COG-N-346 | Children’s Oncology Group | N/A |
| Human: COG-N-415 | Children’s Oncology Group | RRID:CVCL_AQ23 |
| Human: COG-N-415x | Children’s Oncology Group | N/A |
| Human: COG-N-453 | Children’s Oncology Group | RRID:CVCL_LF59 |
| Human: COG-N-476 | Children’s Oncology Group | N/A |
| Human: COG-N-504 | Children’s Oncology Group | N/A |
| Human: COG-N-514 | Children’s Oncology Group | N/A |
| Mouse: NB-9464 | Beth Israel Deaconess Medical Center | N/A |
|
| ||
| Experimental models: Organisms/strains | ||
|
| ||
| C57BL/6J mice | The Jackson Laboratory | RRID:IMSR_JAX:000664 |
| Nude mice (NU/J) | The Jackson Laboratory | RRID:IMSR_JAX:002019 |
|
| ||
| Oligonucleotides | ||
|
| ||
| Please see Table S2 for 5′UTR sequences cloned into pcDNA4 | N/A | |
|
| ||
| Recombinant DNA | ||
|
| ||
| pcDNA4-Renilla-(X)5UTR (see Table S2) | This paper | N/A |
| pcDNA4-Firefly-globin | This paper | N/A |
| pEF1a-puro-MYCN5UTR | This paper | N/A |
|
| ||
| Software and algorithms | ||
|
| ||
| GSEA | Broad Institute | http://software.broadinstitute.org/gsea/index.jsp |
| GraphPad Prism 10 | GraphPad | https://www.graphpad.com/scientific-software/prism/ |
| FACSDiva | Becton Dickinson | N/A |
| FlowJo | FlowJo LLC | https://www.flowjo.com/ |
| ImageJ | Schneider et al.56 | https://imagej.nih.gov/ij/download.html |
| QuPath | Bankhead et al.57 | https://qupath.github.io |
Highlights.
MYCN-amplified neuroblastomas have preferentially increased expression of eIF4A1
Amidino-rocaglates augment eIF4A1 binding across the full length of cellular mRNAs
MYCN mRNA is directly inhibited by amidino-rocaglates
Polypurine ranking of mRNA 5′ UTRs predicts amidinorocaglate sensitivity in neuroblastoma
ACKNOWLEDGMENTS
The results shown here are in part based on data curated by the R2: Genomics Analysis and Visualization Platform: http://r2.amc.nl/. We thank members of the George lab for helpful discussions, Sanjukta Das for initial analysis of ChIP-seq data, and Akiko Shimamura for the use of sucrose gradient fractionation equipment. We thank the late Jerry Pelletier for advice and reagents. This work was supported by a Friends for Life Neuroblastoma Foundation grant (R.E.G.), NIH grants R35GM118173, U01TR002625R21 (J.A.P. and L.E.B.), R21CA267621 (R.E.G.), and an Alex’s Lemonade Stand Foundation Innovation grant 21-24757 (R.E.G.).
Footnotes
DECLARATION OF INTERESTS
The authors declare no competing interests.
SUPPLEMENTAL INFORMATION
Supplemental information can be found online at https://doi.org/10.1016/j.celrep.2024.114134.
REFERENCES
- 1.Irwin MS, Naranjo A, Zhang FF, Cohn SL, London WB, Gastier-Foster JM, Ramirez NC, Pfau R, Reshmi S, Wagner E, et al. (2021). Revised Neuroblastoma Risk Classification System: A Report From the Children’s Oncology Group. J. Clin. Oncol. 39, 3229–3241. [DOI] [PMC free article] [PubMed] [Google Scholar]
- 2.Brodeur GM, Seeger RC, Schwab M, Varmus HE, and Bishop JM (1984). Amplification of N-myc in untreated human neuroblastomas correlates with advanced disease stage. Science 224, 1121–1124. [DOI] [PubMed] [Google Scholar]
- 3.Carabet LA, Rennie PS, and Cherkasov A. (2018). Therapeutic Inhibition of Myc in Cancer. Structural Bases and Computer-Aided Drug Discovery Approaches. Int. J. Mol. Sci. 20, 120. [DOI] [PMC free article] [PubMed] [Google Scholar]
- 4.McKeown MR, and Bradner JE (2014). Therapeutic strategies to inhibit MYC. Cold Spring Harb. Perspect. Med. 4, a014266. [DOI] [PMC free article] [PubMed] [Google Scholar]
- 5.Chipumuro E, Marco E, Christensen CL, Kwiatkowski N, Zhang T, Hatheway CM, Abraham BJ, Sharma B, Yeung C, Altabef A, et al. (2014). CDK7 inhibition suppresses super-enhancer-linked oncogenic transcription in MYCN-driven cancer. Cell 159, 1126–1139. [DOI] [PMC free article] [PubMed] [Google Scholar]
- 6.Krajewska M, Dries R, Grassetti AV, Dust S, Gao Y, Huang H, Sharma B, Day DS, Kwiatkowski N, Pomaville M, et al. (2019). CDK12 loss in cancer cells affects DNA damage response genes through premature cleavage and polyadenylation. Nat. Commun. 10, 1757. [DOI] [PMC free article] [PubMed] [Google Scholar]
- 7.Poon E, Liang T, Jamin Y, Walz S, Kwok C, Hakkert A, Barker K, Urban Z, Thway K, Zeid R, et al. (2020). Orally bioavailable CDK9/2 inhibitor shows mechanism-based therapeutic potential in MYCN-driven neuroblastoma. J. Clin. Invest. 130, 5875–5892. [DOI] [PMC free article] [PubMed] [Google Scholar]
- 8.Roeschert I, Poon E, Henssen AG, Garcia HD, Gatti M, Giansanti C, Jamin Y, Ade CP, Gallant P, Schülein-Völk C, et al. (2021). Combined inhibition of Aurora-A and ATR kinase results in regression of MYCN-amplified neuroblastoma. Nat. Cancer 2, 312–326. [DOI] [PMC free article] [PubMed] [Google Scholar]
- 9.Kovalski JR, Kuzuoglu-Ozturk D, and Ruggero D. (2022). Protein synthesis control in cancer: selectivity and therapeutic targeting. EMBO J. 41, e109823. [DOI] [PMC free article] [PubMed] [Google Scholar]
- 10.Grandori C, Gomez-Roman N, Felton-Edkins ZA, Ngouenet C, Galloway DA, Eisenman RN, and White RJ (2005). c-Myc binds to human ribosomal DNA and stimulates transcription of rRNA genes by RNA polymerase I. Nat. Cell Biol. 7, 311–318. [DOI] [PubMed] [Google Scholar]
- 11.Boon K, Caron HN, van Asperen R, Valentijn L, Hermus MC, van Sluis P, Roobeek I, Weis I, Voûte PA, Schwab M, and Versteeg R. (2001). N-myc enhances the expression of a large set of genes functioning in ribosome biogenesis and protein synthesis. EMBO J. 20, 1383–1393. [DOI] [PMC free article] [PubMed] [Google Scholar]
- 12.Hinnebusch AG, and Lorsch JR (2012). The mechanism of eukaryotic translation initiation: new insights and challenges. Cold Spring Harb. Perspect. Biol. 4, a011544. [DOI] [PMC free article] [PubMed] [Google Scholar]
- 13.Pelletier J, Graff J, Ruggero D, and Sonenberg N. (2015). Targeting the eIF4F translation initiation complex: a critical nexus for cancer development. Cancer Res. 75, 250–263. [DOI] [PMC free article] [PubMed] [Google Scholar]
- 14.Wang J, Shin BS, Alvarado C, Kim JR, Bohlen J, Dever TE, and Puglisi JD (2022). Rapid 40S scanning and its regulation by mRNA structure during eukaryotic translation initiation. Cell 185, 4474–4487.e17. [DOI] [PMC free article] [PubMed] [Google Scholar]
- 15.Pelletier J, and Sonenberg N. (2019). The Organizing Principles of Eukaryotic Ribosome Recruitment. Annu. Rev. Biochem. 88, 307–335. [DOI] [PubMed] [Google Scholar]
- 16.Wolfe AL, Singh K, Zhong Y, Drewe P, Rajasekhar VK, Sanghvi VR, Mavrakis KJ, Jiang M, Roderick JE, Van der Meulen J, et al. (2014). RNA G-quadruplexes cause eIF4A-dependent oncogene translation in cancer. Nature 513, 65–70. [DOI] [PMC free article] [PubMed] [Google Scholar]
- 17.Leppek K, Das R, and Barna M. (2018). Functional 5’ UTR mRNA structures in eukaryotic translation regulation and how to find them. Nat. Rev. Mol. Cell Biol. 19, 158–174. [DOI] [PMC free article] [PubMed] [Google Scholar]
- 18.Waldron JA, Raza F, and Le Quesne J. (2018). eIF4A alleviates the translational repression mediated by classical secondary structures more than by G-quadruplexes. Nucleic Acids Res. 46, 3075–3087. [DOI] [PMC free article] [PubMed] [Google Scholar]
- 19.Waldron JA, Tack DC, Ritchey LE, Gillen SL, Wilczynska A, Turro E, Bevilacqua PC, Assmann SM, Bushell M, and Le Quesne J. (2019). mRNA structural elements immediately upstream of the start codon dictate dependence upon eIF4A helicase activity. Genome Biol. 20, 300. [DOI] [PMC free article] [PubMed] [Google Scholar]
- 20.Lee ASY, Kranzusch PJ, and Cate JHD (2015). eIF3 targets cell-proliferation messenger RNAs for translational activation or repression. Nature 522, 111–114. [DOI] [PMC free article] [PubMed] [Google Scholar]
- 21.Xu Y, Poggio M, Jin HY, Shi Z, Forester CM, Wang Y, Stumpf CR, Xue L, Devericks E, So L, et al. (2019). Translation control of the immune checkpoint in cancer and its therapeutic targeting. Nat. Med. 25, 301–311. [DOI] [PMC free article] [PubMed] [Google Scholar]
- 22.Cerezo M, Guemiri R, Druillennec S, Girault I, Malka-Mahieu H, Shen S, Allard D, Martineau S, Welsch C, Agoussi S, et al. (2018). Translational control of tumor immune escape via the eIF4F-STAT1-PD-L1 axis in melanoma. Nat. Med. 24, 1877–1886. [DOI] [PubMed] [Google Scholar]
- 23.Naineni SK, Itoua Maïga R, Cencic R, Putnam AA, Amador LA, Rodriguez AD, Jankowsky E, and Pelletier J. (2020). A comparative study of small molecules targeting eIF4A. RNA 26, 541–549. [DOI] [PMC free article] [PubMed] [Google Scholar]
- 24.Chan K, Robert F, Oertlin C, Kapeller-Libermann D, Avizonis D, Gutierrez J, Handly-Santana A, Doubrovin M, Park J, Schoepfer C, et al. (2019). eIF4A supports an oncogenic translation program in pancreatic ductal adenocarcinoma. Nat. Commun. 10, 5151. [DOI] [PMC free article] [PubMed] [Google Scholar]
- 25.Sanghvi VR, Mohan P, Singh K, Cao L, Berishaj M, Wolfe AL, Schatz JH, Lailler N, de Stanchina E, Viale A, and Wendel HG (2021). NRF2 Activation Confers Resistance to eIF4A Inhibitors in Cancer Therapy. Cancers 13, 639. [DOI] [PMC free article] [PubMed] [Google Scholar]
- 26.Rubio CA, Weisburd B, Holderfield M, Arias C, Fang E, DeRisi JL, and Fanidi A. (2014). Transcriptome-wide characterization of the eIF4A signature highlights plasticity in translation regulation. Genome Biol. 15, 476. [DOI] [PMC free article] [PubMed] [Google Scholar]
- 27.Cunningham TA, Chapman E, and Schatz JH (2018). eIF4A inhibition: ready for primetime? Oncotarget 9, 35515–35516. [DOI] [PMC free article] [PubMed] [Google Scholar]
- 28.Ernst JT, Thompson PA, Nilewski C, Sprengeler PA, Sperry S, Packard G, Michels T, Xiang A, Tran C, Wegerski CJ, et al. (2020). Design of Development Candidate eFT226, a First in Class Inhibitor of Eukaryotic Initiation Factor 4A RNA Helicase. J. Med. Chem. 63, 5879–5955. [DOI] [PubMed] [Google Scholar]
- 29.Iwasaki S, Iwasaki W, Takahashi M, Sakamoto A, Watanabe C, Shichino Y, Floor SN, Fujiwara K, Mito M, Dodo K, et al. (2019). The Translation Inhibitor Rocaglamide Targets a Bimolecular Cavity between eIF4A and Polypurine RNA. Mol. Cell 73, 738–748.e9. [DOI] [PMC free article] [PubMed] [Google Scholar]
- 30.Chu J, Zhang W, Cencic R, O’Connor PBF, Robert F, Devine WG, Selznick A, Henkel T, Merrick WC, Brown LE, et al. (2020). Rocaglates Induce Gain-of-Function Alterations to eIF4A and eIF4F. Cell Rep. 30, 2481–2488.e5. [DOI] [PMC free article] [PubMed] [Google Scholar]
- 31.Skofler C, Kleinegger F, Krassnig S, Birkl-Toeglhofer AM, Singer G, Till H, Benesch M, Cencic R, Porco JA Jr., Pelletier J, et al. (2021). Eukaryotic Translation Initiation Factor 4AI: A Potential Novel Target in Neuroblastoma. Cells 10, 301. [DOI] [PMC free article] [PubMed] [Google Scholar]
- 32.Zhang W, Chu J, Cyr AM, Yueh H, Brown LE, Wang TT, Pelletier J, and Porco JA Jr. (2019). Intercepted Retro-Nazarov Reaction: Syntheses of Amidino-Rocaglate Derivatives and Their Biological Evaluation as eIF4A Inhibitors. J. Am. Chem. Soc. 141, 12891–12900. [DOI] [PMC free article] [PubMed] [Google Scholar]
- 33.Chu J, Zhang W, Cencic R, Devine WG, Beglov D, Henkel T, Brown LE, Vajda S, Porco JA Jr., and Pelletier J. (2019). Amidino-Rocaglates: A Potent Class of eIF4A Inhibitors. Cell Chem. Biol. 26, 1586–1593.e3. [DOI] [PMC free article] [PubMed] [Google Scholar]
- 34.Zimmerman MW, Liu Y, He S, Durbin AD, Abraham BJ, Easton J, Shao Y, Xu B, Zhu S, Zhang X, et al. (2018). MYC Drives a Subset of High-Risk Pediatric Neuroblastomas and Is Activated through Mechanisms Including Enhancer Hijacking and Focal Enhancer Amplification. Cancer Discov. 8, 320–335. [DOI] [PMC free article] [PubMed] [Google Scholar]
- 35.Debruyne DN, Dries R, Sengupta S, Seruggia D, Gao Y, Sharma B, Huang H, Moreau L, McLane M, Day DS, et al. (2019). BORIS promotes chromatin regulatory interactions in treatment-resistant cancer cells. Nature 572, 676–680. [DOI] [PMC free article] [PubMed] [Google Scholar]
- 36.Jopling CL, and Willis AE (2001). N-myc translation is initiated via an internal ribosome entry segment that displays enhanced activity in neuronal cells. Oncogene 20, 2664–2670. [DOI] [PubMed] [Google Scholar]
- 37.Dries R, Zhu Q, Dong R, Eng CL, Li H, Liu K, Fu Y, Zhao T, Sarkar A, George RE, Pierson N, et al. (2021). Giotto: a toolbox for integrative analysis and visualization of spatial expression data. Genome Biol 22, 78. [DOI] [PMC free article] [PubMed] [Google Scholar]
- 38.Chu J, Zhang W, Cencic R, Devine WG, Beglov D, Henkel T, Brown LE, Vajda S, Porco JA Jr., and Pelletier J. (2019). Amidino-Rocaglates: A Potent Class of eIF4A Inhibitors. Cell Chem. Biol. 26, 1586–1593.e3. [DOI] [PMC free article] [PubMed] [Google Scholar]
- 39.Otto T, Horn S, Brockmann M, Eilers U, Schüttrumpf L, Popov N, Kenney AM, Schulte JH, Beijersbergen R, Christiansen H, et al. (2009). Stabilization of N-Myc is a critical function of Aurora A in human neuroblastoma. Cancer Cell 15, 67–78. [DOI] [PubMed] [Google Scholar]
- 40.Agarwal S, Milazzo G, Rajapakshe K, Bernardi R, Chen Z, Barbieri E, Koster J, Perini G, Coarfa C, and Shohet JM (2018). MYCN acts as a direct co-regulator of p53 in MYCN amplified neuroblastoma. Oncotarget 9, 20323–20338. [DOI] [PMC free article] [PubMed] [Google Scholar]
- 41.Iwasaki S, Floor SN, and Ingolia NT (2016). Rocaglates convert DEAD-box protein eIF4A into a sequence-selective translational repressor. Nature 534, 558–561. [DOI] [PMC free article] [PubMed] [Google Scholar]
- 42.Ingolia NT, Brar GA, Rouskin S, McGeachy AM, and Weissman JS (2013). Genome-wide annotation and quantitation of translation by ribosome profiling. Curr Protoc Mol Biol 103, 4.18.1–4.18.19. Chapter 4, 19. [DOI] [PMC free article] [PubMed] [Google Scholar]
- 43.Oertlin C, Watt K, Ristau J, and Larsson O. (2022). Anota2seq Analysis for Transcriptome-Wide Studies of mRNA Translation. Methods Mol. Biol. 2418, 243–268. [DOI] [PubMed] [Google Scholar]
- 44.Valentijn LJ, Koster J, Haneveld F, Aissa RA, van Sluis P, Broekmans MEC, Molenaar JJ, van Nes J, and Versteeg R. (2012). Functional MYCN signature predicts outcome of neuroblastoma irrespective of MYCN amplification. Proc. Natl. Acad. Sci. USA 109, 19190–19195. [DOI] [PMC free article] [PubMed] [Google Scholar]
- 45.Danan C, Manickavel S, and Hafner M. (2016). PAR-CLIP: A Method for Transcriptome-Wide Identification of RNA Binding Protein Interaction Sites. Methods Mol. Biol. 1358, 153–173. [DOI] [PMC free article] [PubMed] [Google Scholar]
- 46.Jens M. (2016). A Pipeline for PAR-CLIP Data Analysis. Methods Mol. Biol. 1358, 197–207. [DOI] [PubMed] [Google Scholar]
- 47.Li F, Fang J, Yu Y, Hao S, Zou Q, Zeng Q, and Yang X. (2023). Reanalysis of ribosome profiling datasets reveals a function of rocaglamide A in perturbing the dynamics of translation elongation via eIF4A. Nat. Commun. 14, 553. [DOI] [PMC free article] [PubMed] [Google Scholar]
- 48.Bailey TL, Johnson J, Grant CE, and Noble WS (2015). The MEME Suite. Nucleic Acids Res. 43, W39–W49. [DOI] [PMC free article] [PubMed] [Google Scholar]
- 49.Pestova TV, Shatsky IN, Fletcher SP, Jackson RJ, and Hellen CU (1998). A prokaryotic-like mode of cytoplasmic eukaryotic ribosome binding to the initiation codon during internal translation initiation of hepatitis C and classical swine fever virus RNAs. Genes Dev. 12, 67–83. [DOI] [PMC free article] [PubMed] [Google Scholar]
- 50.Godet AC, David F, Hantelys F, Tatin F, Lacazette E, Garmy-Susini B, and Prats AC (2019). IRES Trans-Acting Factors, Key Actors of the Stress Response. Int. J. Mol. Sci. 20, 924. [DOI] [PMC free article] [PubMed] [Google Scholar]
- 51.Weiss WA, Aldape K, Mohapatra G, Feuerstein BG, and Bishop JM (1997). Targeted expression of MYCN causes neuroblastoma in transgenic mice. EMBO J. 16, 2985–2995. [DOI] [PMC free article] [PubMed] [Google Scholar]
- 52.Gandin V, Masvidal L, Hulea L, Gravel SP, Cargnello M, McLaughlan S, Cai Y, Balanathan P, Morita M, Rajakumar A, et al. (2016). nanoCAGE reveals 5’ UTR features that define specific modes of translation of functionally related MTOR-sensitive mRNAs. Genome Res. 26, 636–648. [DOI] [PMC free article] [PubMed] [Google Scholar]
- 53.Sen ND, Zhou F, Harris MS, Ingolia NT, and Hinnebusch AG (2016). eIF4B stimulates translation of long mRNAs with structured 5’ UTRs and low closed-loop potential but weak dependence on eIF4G. Proc. Natl. Acad. Sci. USA 113, 10464–10472. [DOI] [PMC free article] [PubMed] [Google Scholar]
- 54.Misiak D, Hagemann S, Bell JL, Busch B, Lederer M, Bley N, Schulte JH, and Hüttelmaier S. (2021). The MicroRNA Landscape of MYCN-Amplified Neuroblastoma. Front. Oncol. 11, 647737. [DOI] [PMC free article] [PubMed] [Google Scholar]
- 55.DiVita DJ, and Kearse MG (2021). A double on the Rocs with a twist: Rocaglamide A targets multiple DEAD-box helicases to inhibit translation initiation. Cell Chem. Biol. 28, 431–433. [DOI] [PMC free article] [PubMed] [Google Scholar]
- 56.Schneider CA, Rasband WS, and Eliceiri KW (2012). NIH Image to ImageJ: 25 years of image analysis. Nat. Methods 9, 671–675. [DOI] [PMC free article] [PubMed] [Google Scholar]
- 57.Bankhead P, Loughrey MB, Fernández JA, Dombrowski Y, McArt DG, Dunne PD, McQuaid S, Gray RT, Murray LJ, Coleman HG, et al. (2017). QuPath: Open source software for digital pathology image analysis. Sci. Rep. 7, 16878. [DOI] [PMC free article] [PubMed] [Google Scholar]
- 58.Wei T, and Simko V. (2021). R Package ‘corrplot’: Visualization of a Correlation. [Google Scholar]
- 59.Langmead B, Trapnell C, Pop M, and Salzberg SL (2009). Ultrafast and memory-efficient alignment of short DNA sequences to the human genome. Genome Biol. 10, R25. [DOI] [PMC free article] [PubMed] [Google Scholar]
- 60.Robinson JT, Thorvaldsdottir H, Turner D, and Mesirov JP (2023). igv.js: an embeddable JavaScript implementation of the Integrative Genomics Viewer (IGV). Bioinformatics 39, btac830. [DOI] [PMC free article] [PubMed] [Google Scholar]
- 61.Thorvaldsdóttir H, Robinson JT, and Mesirov JP (2013). Integrative Genomics Viewer (IGV): high-performance genomics data visualization and exploration. Brief. Bioinform. 14, 178–192. [DOI] [PMC free article] [PubMed] [Google Scholar]
- 62.Zhang Y, Liu T, Meyer CA, Eeckhoute J, Johnson DS, Bernstein BE, Nusbaum C, Myers RM, Brown M, Li W, and Liu XS (2008). Model-based analysis of ChIP-Seq (MACS). Genome Biol. 9, R137. [DOI] [PMC free article] [PubMed] [Google Scholar]
- 63.Lovén J, Hoke HA, Lin CY, Lau A, Orlando DA, Vakoc CR, Bradner JE, Lee TI, and Young RA (2013). Selective inhibition of tumor oncogenes by disruption of super-enhancers. Cell 153, 320–334. [DOI] [PMC free article] [PubMed] [Google Scholar]
- 64.Whyte WA, Orlando DA, Hnisz D, Abraham BJ, Lin CY, Kagey MH, Rahl PB, Lee TI, and Young RA (2013). Master transcription factors and mediator establish super-enhancers at key cell identity genes. Cell 153, 307–319. [DOI] [PMC free article] [PubMed] [Google Scholar]
- 65.Langmead B, and Salzberg SL (2012). Fast gapped-read alignment with Bowtie 2. Nat. Methods 9, 357–359. [DOI] [PMC free article] [PubMed] [Google Scholar]
- 66.Kim D, Pertea G, Trapnell C, Pimentel H, Kelley R, and Salzberg SL (2013). TopHat2: accurate alignment of transcriptomes in the presence of insertions, deletions and gene fusions. Genome Biol. 14, R36. [DOI] [PMC free article] [PubMed] [Google Scholar]
- 67.Trapnell C, Roberts A, Goff L, Pertea G, Kim D, Kelley DR, Pimentel H, Salzberg SL, Rinn JL, and Pachter L. (2012). Differential gene and transcript expression analysis of RNA-seq experiments with TopHat and Cufflinks. Nat. Protoc. 7, 562–578. [DOI] [PMC free article] [PubMed] [Google Scholar]
- 68.Li H, Handsaker B, Wysoker A, Fennell T, Ruan J, Homer N, Marth G, Abecasis G, and Durbin R; 1000 Genome Project Data Processing Subgroup (2009). The Sequence Alignment/Map format and SAMtools. Bioinformatics 25, 2078–2079. [DOI] [PMC free article] [PubMed] [Google Scholar]
- 69.Li H, and Durbin R. (2009). Fast and accurate short read alignment with Burrows-Wheeler transform. Bioinformatics 25, 1754–1760. [DOI] [PMC free article] [PubMed] [Google Scholar]
- 70.Quinlan AR, and Hall IM (2010). BEDTools: a flexible suite of utilities for comparing genomic features. Bioinformatics 26, 841–842. [DOI] [PMC free article] [PubMed] [Google Scholar]
- 71.Durinck S, Moreau Y, Kasprzyk A, Davis S, De Moor B, Brazma A, and Huber W. (2005). BioMart and Bioconductor: a powerful link between biological databases and microarray data analysis. Bioinformatics 21, 3439–3440. [DOI] [PubMed] [Google Scholar]
Associated Data
This section collects any data citations, data availability statements, or supplementary materials included in this article.