

Abstract
Background:
Application of single cell transcriptomic (scRNAseq) analysis to the study of atherosclerosis has provided unique insights into the molecular and genetic mechanisms that mediate disease risk and pathophysiology. However, non-standardized methodologies and relatively high cost associated with the technique have limited the size and replication of existing datasets and created disparate or contradictory findings that have fostered misunderstanding and controversy.
Methods:
To address these uncertainties we have performed a conservative integration of multiple published scRNAseq datasets into a single meta-analysis, performed extended analysis of native resident vascular cells, and used in-situ hybridization to map the disease anatomical location of the identified cluster cells. To investigate the trans-differentiation of smooth muscle cells (SMC) to macrophage phenotype, we have developed a classifying algorithm based on quantification of reporter transgene expression.
Results:
The reporter gene expression tool indicates that within the experimental limits of the examined studies, trans-differentiation of SMC to the macrophage lineage are extremely rare. Validated transition SMC phenotypes were defined by clustering, and the location of these cells mapped to lesion anatomy with in situ hybridization. We have also characterized 5 endothelial cell phenotypes, and linked these cellular species to different vascular structures and functions. Finally, we have identified a transcriptomically unique cellular phenotype that constitutes the aortic valve.
Conclusions:
Taken together, these analyses resolve a number of outstanding issues related to differing results reported with vascular disease scRNAseq studies, and significantly extend our understanding of the role of resident vascular cells in anatomy and disease.
Graphical Abstract:

Introduction
The pathophysiology of atherosclerosis involves multiple cell types, including smooth muscle cells (SMC), endothelial cells (EC), fibroblasts, macrophages and a number of immune cell types1. The role of SMC has been shown to be particularly important, as SMC-derived cells comprise ~30–50% of all cells in the plaque2 and a disproportionately large number of causal GWAS genes are thought to mediate CAD risk through SMC3. In the diseased vascular wall, SMC undergo a dramatic phenotypic shift; on a transcriptome-wide level these cells appear to de-differentiate, adopting either a fibroblast-like phenotype or an osteo-chondrogenic phenotype4–8. Endothelial cells also contribute to vascular disease risk, and although less dramatic, they also undergo phenotypic changes9. Both of these processes exhibit archetypal molecular changes similar to2 those identified in epithelial mesenchymal transformation. Despite rigorous research over the decades, it has been difficult to comprehensively explore the dynamics of these cell types in vivo during atherosclerosis.
The development of single-cell RNA sequencing (scRNAseq) technologies and their recent application to the study of atherosclerosis in vivo has begun to reveal both a more comprehensive and a more granular picture of cellular phenotypes during disease6,10–13. When combined with cellular lineage tracing techniques over multiple time points, these studies have the ability to characterize, at a molecular level, the profound cell state changes that shape the plaque. For example, multiple studies have used SMC and EC lineage tracing to study the phenotype(s) of progeny cells during atherosclerosis4–7,14. While these studies have led to many congruent observations, differences in experimental design, analysis, and interpretation of data have also led to conflicting results regarding the extent to which SMC-derived cells are able to transdifferentiate into other cell types, and also regarding the effect of those transitions on plaque phenotype and risk for disease. Thus, despite an unprecedented wealth of data, there remains significant controversy in the field.
In this study, we have integrated publicly available scRNAseq datasets of mouse atherosclerosis from multiple investigators to identify common observations across the datasets that persist despite different experimental designs, to investigate factors that could account for some of the conflicting results or interpretations. Further, we propose standard practices for analyzing and reporting scRNAseq data. We begin to localize cell subtypes to create a spatial cell atlas of atherosclerosis that can give insight into the consequence of cell state changes on plaque architecture. These analyses are focused on resident vascular cells, and do not address single cell transcriptomic studies investigating the cellular and transcriptomic changes related to primarily hematopoietic cells in the atherosclerotic tissues13.
Methods
Datasets included
All data and materials have been made publicly available at the GEO and can be accessed at GEO: GSE150644 (Alencar et al), GSE155513 (Pan et al),GSE131780 (Wirka et al), PRJNA794806 (Cheng et al), GSE150768 (Kim et al), GSE163519 (Newman et al) and GSE140947 (Chen et al).
Analysis of scRNA-Seq data
Quality Filtering
Fastq files from each dataset were aligned to mouse reference genome version mm10 individually using CellRanger Software (10X Genomics). We used the “mkref” function of cellranger to create a custom mouse reference genome including the sequences of fluorescence reporter genes and the “count” function to align the fastq sequence over the reference genome. The aligned datasets were analyzed using R package Seurat version 4. Low quality cells were removed based on high mitochondrial content with percentage < 7.5 %. In order to remove doublets, an upper cut-off of the number of genes > 6000 was used for the analysis. Seurat’s “VlnPlot” feature was used to visualize the QC metrics and the “subset” feature used to filter out the low-quality cells.
Dataset Integration
The merged seurat object with raw UMI count was library-size normalized using the built-in seurat pipeline function “NormalizeData”. Data were scaled using the “ScaleData” function. Principal component analysis was performed to analyze individual samples and the number of principal components (PCs) were determined using the Jackstraw method with the “RunPCA” function. After principal component analysis (PCA), a graph-based clustering approach was implemented to cluster cells into distinct populations of cell-types with embedding cells to graph-structures based on K-nearest neighbors (KNN) graphs using “FindNeighbours” and “FindClusters”. The edges between different cells represent similar gene expression patterns. A unified strategy was followed for reference assembly and transfer learning, to allow integration of the datasets listed in Table 1. Namely, the “FindIntegrationAnchors” and “IntegrateData” functions were used to identify single-cell pairs across the datasets that can be used as “anchors” to transform datasets into shared space. This approach enabled the identification of distinct populations of SMC, irrespective of differences in chemistry and biological variabilities. Further, the “FindAllMarkers” function was used to identify differentially expressed genes with fold change and bonferroni adjusted p-value for statistical measures. Quantification and visualization of the gene expression was performed using seurat’s built-in functions such as “AddModuleScore”, “FeaturePlot”, “DimPlot”, “DoHeatmap” and “VlnPlot”. Pathway analysis on the top 30 marker genes for each cluster was performed with the DAVID pathway enrichment tool, against a background of all genes. The “clusterprofiler” and “enrichgo” packages were used for gene ontology biological pathway analysis with options “ont = ‘BP’”, “pvalueCutoff = 0.05” and “qvalueCutoff = 0.05”.This approach was used to identify distinct endothelial cell populations.
Table 1.
Details of scRNAseq studies included in these analyses.
| Sex | Lineage Reporter | Cre driver | Tamox dose | Tamox start age | Athero model | Age start of diet | Tissue dissection | Capture | Gene KO analysis | Mod SMC terms | Transdiff cell types | scRNA clusters | Protein analysis | # cells after filter | # cells before filter | |
|---|---|---|---|---|---|---|---|---|---|---|---|---|---|---|---|---|
| Alencar | M | LSL-eYFP and RSR-tdTomato-GFP | Myh11-CreERT2Myh11-Cre(Dre)ERT2Lgals3-SR-IRES-Cre | 0.1 mg × 10 days, IP | 6–8 wks | 10 or 18 wk HFD in Apoe−/− mice | Unknown | Micro-dissected lesions of brachiocephalic artery (BCA) | 10x V2 genomics | Oct4, Klf4 | Pioneer cell | UMAP, 14 clusters | CyTOF/IFM | 9175 | 15961 | |
| Pan | M | LSL-ZsGreen1 | Myh11-CreERT2 | 2-day diet | 7 wks | 8, 16, 26 wk HFD in Ldlr−/− and Apoe−/− mice | 8 weeks | Whole brachiocephalic artery and ascending thoracic aorta | 10x V2 genomics | Not applicable | Fibrochondrocyte-like | Stem cells, monocytes, endothelial cells | UMAP, 12 clusters | metaVIPER/IFM | 42752 | 49523 |
| Wirka | M | LSL-tdTomato | Myh11-CreERT2 | 0.2 mg/g × 2 days, PO | 8 wks | 8 and 16 wk HFD in Apoe−/− mice | 9 weeks | Whole aortic root and ascending arch | 10x V2 genomics | Tcf21 | Fibromyocytes | tSNE, 12 clusters | CITE-seq/IFM | 27662 | 34600 | |
| Cheng | M | LSL-tdTomato | Myh11-CreERT2 | 0.2 mg/g × 2 days, PO | 8 wks | 16 wk HFD in Apoe−/− mice | 9 weeks | Whole aortic root and ascending arch | 10x V3 genomics | Smad3, Zeb2 | Remodeling SMC (Smad3 KO), fibromyocytes, chondromyocytes | 84809 | 106579 | |||
| Kim | M | LSL-tdTomato | Myh11-CreERT2 | 0.2 mg/g × 2 days, PO | 8 wks | 16 wk HFD in Apoe−/− mice | 9 weeks | Whole aortic root and ascending arch | 10x V2 genomics | Ahr | Chondromyocytes | UMAP, 7 clusters | 5389 | 7679 | ||
| Newman | M | eYFP | Myh11-CreERT2 | 1 mg of tamoxifen (T-5648, Sigma) per mouse per day for 10 d over 2 week | 6–8 wks | 18 or 26 weeks HFD (26–34 weeks old) | 9 weeks | BCA and aortic root | 10x V3 genomics | Pdgfrb | UMAP, 19 clusters | 8155 | 13630 | |||
| Chen | M | GFP | Myh11-CreERT2 | 1 mg/day for 5 days | 6 wks | 24-week-old Apoe−/− and TGFβR2iSMC-Apoe mice | 8 weeks | Ascending aorta | 10x V3 genomics | TgfbrII | Stem cells, monocytes, adipose | UMAP, 18 clusters | CyTOF | 13153 | 17164 |
Animals and procedures
The animal study protocol was approved by the Administrative Panel on Laboratory Animal Care (APLAC) at Stanford University. Mice used for in situ marker localization assays were on the C57Bl6/J background. Experimentally relevant alleles harbored by these mice have been described previously. The Y-linked Myh11-CreERT2 transgenic construct (TgMyh11-CreERT2; JAX# 019079)15 induces smooth muscle-specific expression of a tamoxifen-inducible Cre recombinase. When combined with the Cre-activated, floxed Rosa26-tdT allele (B6.Cg-Gt(ROSA)26Sortm14 (CAGtdTomato)Hze/J, JAX# 007914) following tamoxifen induction, smooth muscle cell-derived cells can be identified by expression of the fluorescent tandem dimer tomato (tdT) reporter. The Apoe-null allele (B6.129P2-Apoetm1Unc/J, JAX#002052) sensitizes mice to high-fat diet (HFD)-induced atherogenesis. As the Myh11-CreERT2 allele is Y-linked, only male mice were used for this study. Smooth muscle labelling was achieved in male Myh11-CreERT2; Apoe−/−; Rosa26-tdT+/+ mice at 8 weeks of age by the administration of two doses of tamoxifen at 0.2 mg/g body weight, separated by 48 h. Atherogenesis was induced by replacement of standard laboratory mouse diet with HFD (Dyets #101511, 21% anhydrous milk fat, 19% casein, 0.15% cholesterol) for 16 weeks, starting 48 h after the second dose of tamoxifen. Mice were kept in standard housing.
Preparation of mouse arterial cryosections
Following induction of anesthesia, mice were sacrificed by cervical dislocation. The vasculature was flushed of blood by cutting the right atrium, followed by slow injection of 10 mL of PBS into the left ventricle. Perivascular adipose was removed from arterial tissues, including aortic root, brachiocephalic artery and aortic arch, before fixation in 4% PFA in PBS overnight at 4 °C. Tissues were cryopreserved through a sucrose gradient, followed by a 1 h incubation in a 50:50 solution of 30% sucrose:OCT compound. Tissues were then snap-frozen in 100% OCT compound before cryosectioning into 7um-thick sections for spatial localization assays.
In situ marker localization assays
IHC was performed according to standard protocol. Primary antibodies: Anti-SM22alpha (Tagln) rabbit polyclonal primary antibody (1:300 dilution; 3.3 μg/mL; ab14106; Abcam), CNN1 rabbit monoclonal antibody (1:400 dilution; absolute concentration unspecified; Origene TA327614). Secondary: Rabbit-on-Rodent HRP Polymer (RMR622; Biocare Medical). The processed sections were visualized using a Leica DM5500 microscope, and images were obtained using Leica Application Suite X software. For RNAscope, slides were processed according to the manufacturer’s instructions, and all reagents were obtained from ACD Bio. Slides were washed once in PBS, then immersed in 1× Target Retrieval reagent at 100 °C for 5 min. Slides were washed twice in deionized water, immersed in 100% ethanol and air dried, and sections were encircled with a liquid-blocking pen. Sections were incubated with Protease III reagent for 30 min at 40 °C, then washed twice with deionized water. Sections were incubated with probes against specified endothelial, valve and smooth muscle markers or a negative control probe for 2 h at 40 °C. colorimetric assays were performed per the manufacturer’s instructions. Representative images were chosen based on repeated patterns of staining for at least > 5 independent biological replicates.
Statistical Methods
Statistical significance of differentially expressed marker genes across different clusters was identified using the Wilcoxon rank-sum test.
The Receiver Operating Characteristic (ROC) curve, namely area under the curve (AUC), was used to perform binary classification analysis between the true positive fraction and false positive fractions, based on each possible decision threshold value. ROC analysis was performed for integrated objects for baseline datasets, to identify the optimal threshold value for gene expression of fluorescent markers. Logistic regression was used to classify SMC vs non-SMC, based on the expression profile of tdTomato and Zsgreen1 fluorescent markers in Cheng et al. and Pan et al. respectively. The optimum expression value that best classifies the SMC vs non-SMC was identified and shown as a dotted line in the Fig. 2. This threshold cut-off was used to visualize the SMC lineage traced cells; the expression of macrophage marker Cd68 was also shown.
Figure 2.
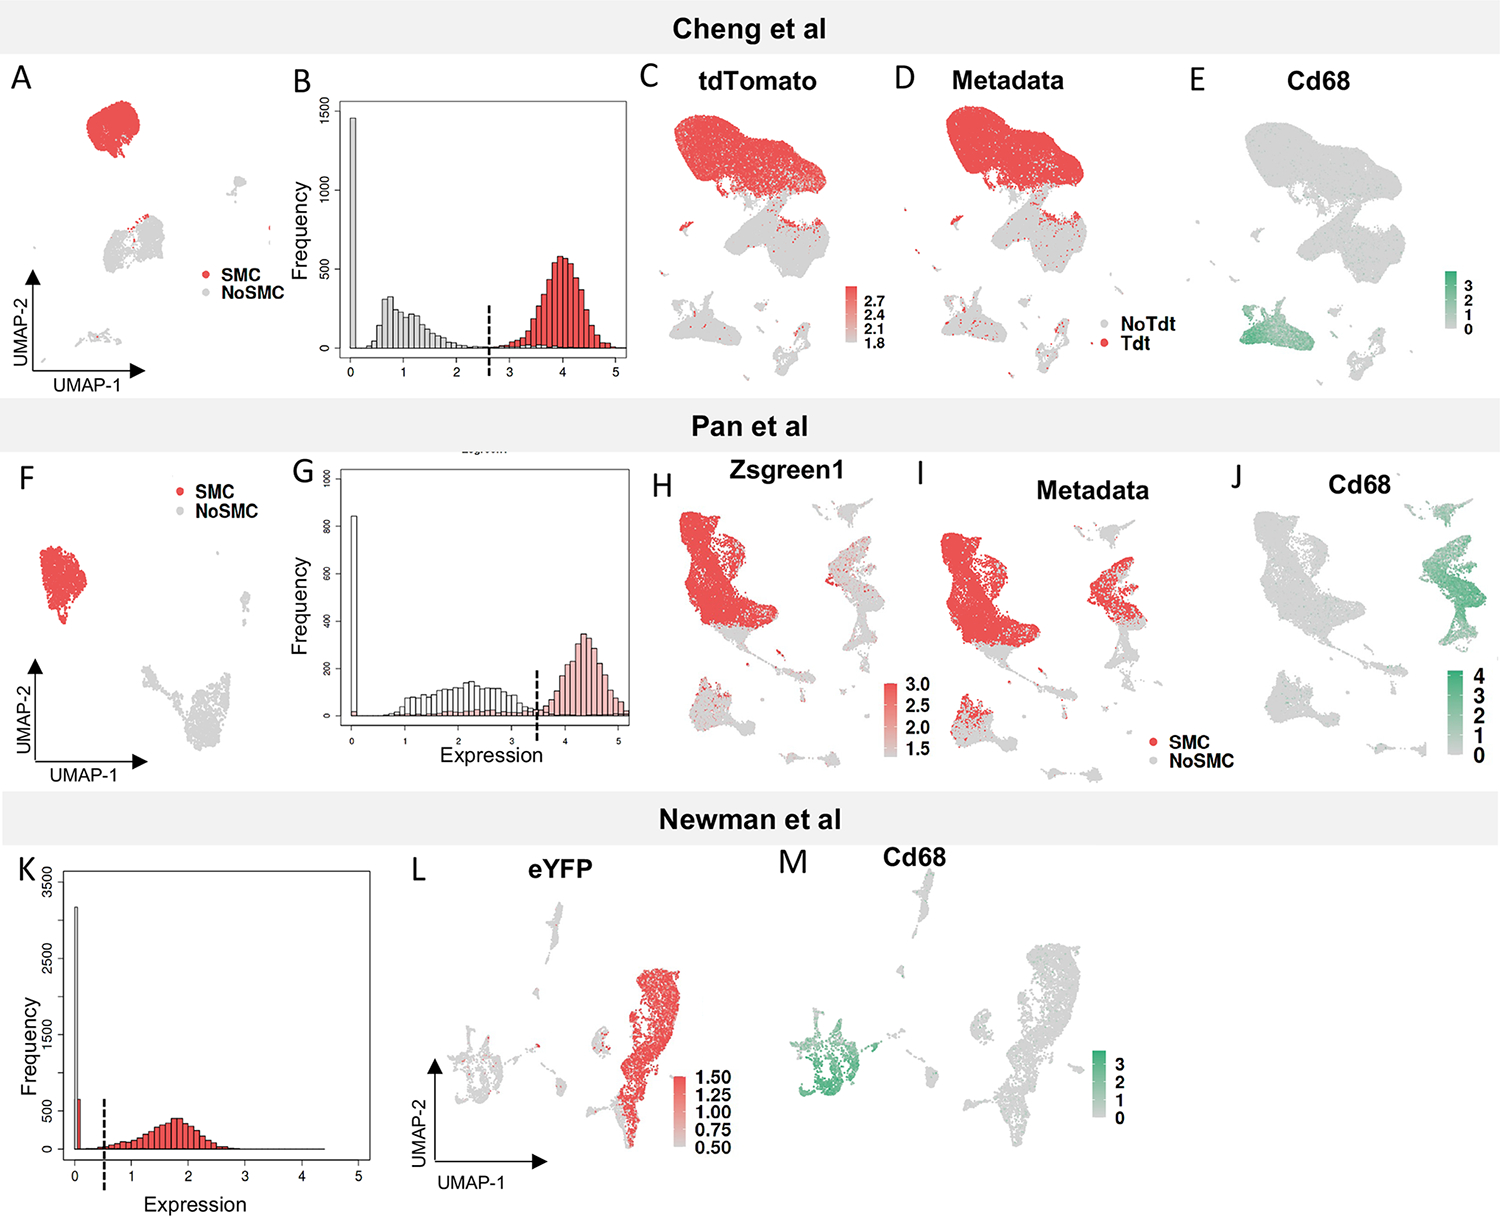
Investigation of possible SMC transdifferentiation to macrophages, employing datasets from Cheng et al (A - E), Pan et al (F - J) and Newman et al (K - M). A) UMAP showing SMC (red) and non-SMC (grey) at baseline as identified with Myh11 expression for Cheng et al dataset. B) Histogram showing the expression of tdTomato in SMC vs non-SMC at baseline. The dotted line shows the cut-off identified with the AUC curve. C) UMAP showing expression of tdTomato gene in Cheng et al 16-week timepoint with cut-off 1.8. Cutoff corresponds to the AUC in panel ‘B.’ D) UMAP showing FACS labeled cells in Cheng et al 16-week time-point. Metadata represents assignment of lineage tracing as per fluorescent gating in these studies. E) Expression of the canonical macrophage marker Cd68 at the 16-week time-point. F) Expression of Zsgreen1 in SMC (red) vs non-SMC (grey) at 0-week time point identified with Myh11 expression. G) Histogram showing the expression distribution of Zsgreen1 in SMC vs non-SMC cells at 0 week with dotted line representing the cut-off identified with AUC curve. H) Expression of Zsgreen1 at 16 - and 22 - week time-point from Pan et al with cut-off 1.3. I) UMAP showing FACS data with labeled SMC and non-SMC in Pan et al. Metadata represents assignment of lineage tracing as per fluorescent gating in these studies. J) UMAP showing expression of Cd68 marking the macrophage cluster at 16-week and 22-week. K) Histogram showing expression distribution of eYFP in SMC vs non- SMC in Newman et al dataset identified with Myh11 expression. L) Expression of eYFP and M) Cd68.
Results
Integration of multiple scRNAseq datasets
To investigate common features of gene expression in the context of atherosclerosis in mouse models, we downloaded and analyzed available primary data from scRNAseq studies published from July 2019 to April 2022 (Table 1). These studies employed hyperlipidemic mice with deletion of the ApoE or Ldlr genes and all groups performed lineage tracing with the same smooth muscle-specific transgeneic Myh11-CreERT2 originally developed by the Offermanns lab15. All these models activate lineage tracing via excising a floxed stop codon in front of a fluorescent protein knocked into the ROSA26 locus, although several different fluorescent lineage markers were employed. An important difference among the studies was the atherosclerotic site harvested for transcriptomic profiling, with various segments of the aortic root, ascending aorta, and brachiocephalic artery (BCA) being included in the sample. Importantly, the Owens group microdissected only the lesions in the BCA, whereas this lab has focused mostly on the aortic root and ascending aorta, and others utilized the entire aorta. These differences allowed for comparative observations regarding the localization of specific cellular phenotypes in the context of an integrated data analysis4,14. All studies employed the 10X Genomics microfluidics system for single cell capture. Of note, the early studies were performed with 10x Genomics version 2 assay reagents, and later studies with version 3 reagents, introducing a prominent source for batch effects among these datasets. Sequencing in all cases was with next generation short read Illumina technology, although on different specific platforms.
We downloaded all the available mouse scRNAseq data for the studies listed in Table 1 and aligned these fastq files to a custom mm10 reference genome that included the sequences of all fluorescent reporters, using 10x Genomics Cellranger mapping software. We obtained a total of 152,045 cells for final analysis after filtering out 5% of the cells based on mitochondrial content and low-quality metrics. We used a cutoff of 6000 genes to remove doublets, and comparison of this method with the DoubletFinder algorithm found that both approaches identified a very small number of true doublets16 (Suppl. Fig. 1).
Integration using library-wide normalization and default Seurat settings for clustering the datasets showed batch effects preventing the cells in similar biological states from integrating (Suppl. Fig. 2). The UMAP revealed cell type clusters separated by v2 versus v3 chemistry and dataset identity. In order to remove batch-effects and integrate the data, we used Seurat’s anchor-based integration with single-cell transform (SCT) in which pair-wise correspondences between the datasets were identified as anchors and used to transfer information and harmonize between cells with the same biological state. We used 50 dimensions for integrating the datasets with a conservative clustering resolution of 0.2. We also employed Harmony17 to integrate the different study datasets, and found no significant difference in clustering compared to the Seurat Integration based approach (Suppl. Fig. 3).
Using a conservative clustering resolution (0.2), the integrated UMAP identified 13 clusters of cells (Fig. 1A), allowing visualization of the cellular distribution in 2-dimensional space with respect to experimental dataset (Fig. 1B, Suppl. Fig. 4), time-point (Fig. 1C) and knock-out genotype (Fig. 1D). These UMAPs show some variation that is to be expected with the noted differences in study design, but good overall integration of the datasets. At the chosen clustering resolution, SMC formed three cellular populations, including quiescent differentiated SMC expressing Myh11 and Cnn1, osteochondrogenic “chondromyocytes” (CMC) that express chondrocyte genes such as Col2a1 and Acan, as well as a smooth muscle lineage-traced fibroblast-like “fibromyocyte” phenotype marked by expression of Vcam1 and Tnfrsf11b6,18. The remaining cells within the vessel wall, including endothelial cells (EC) and monocyte/macrophages (Macro) clustered separately, with EC and fibroblasts constituting multiple clusters, as described by several groups19,20. We have shown the expression of canonical/known markers for each cell type and identified the top 3 markers in major cell-type clusters (Fig. 1E and 1F).
Figure 1.
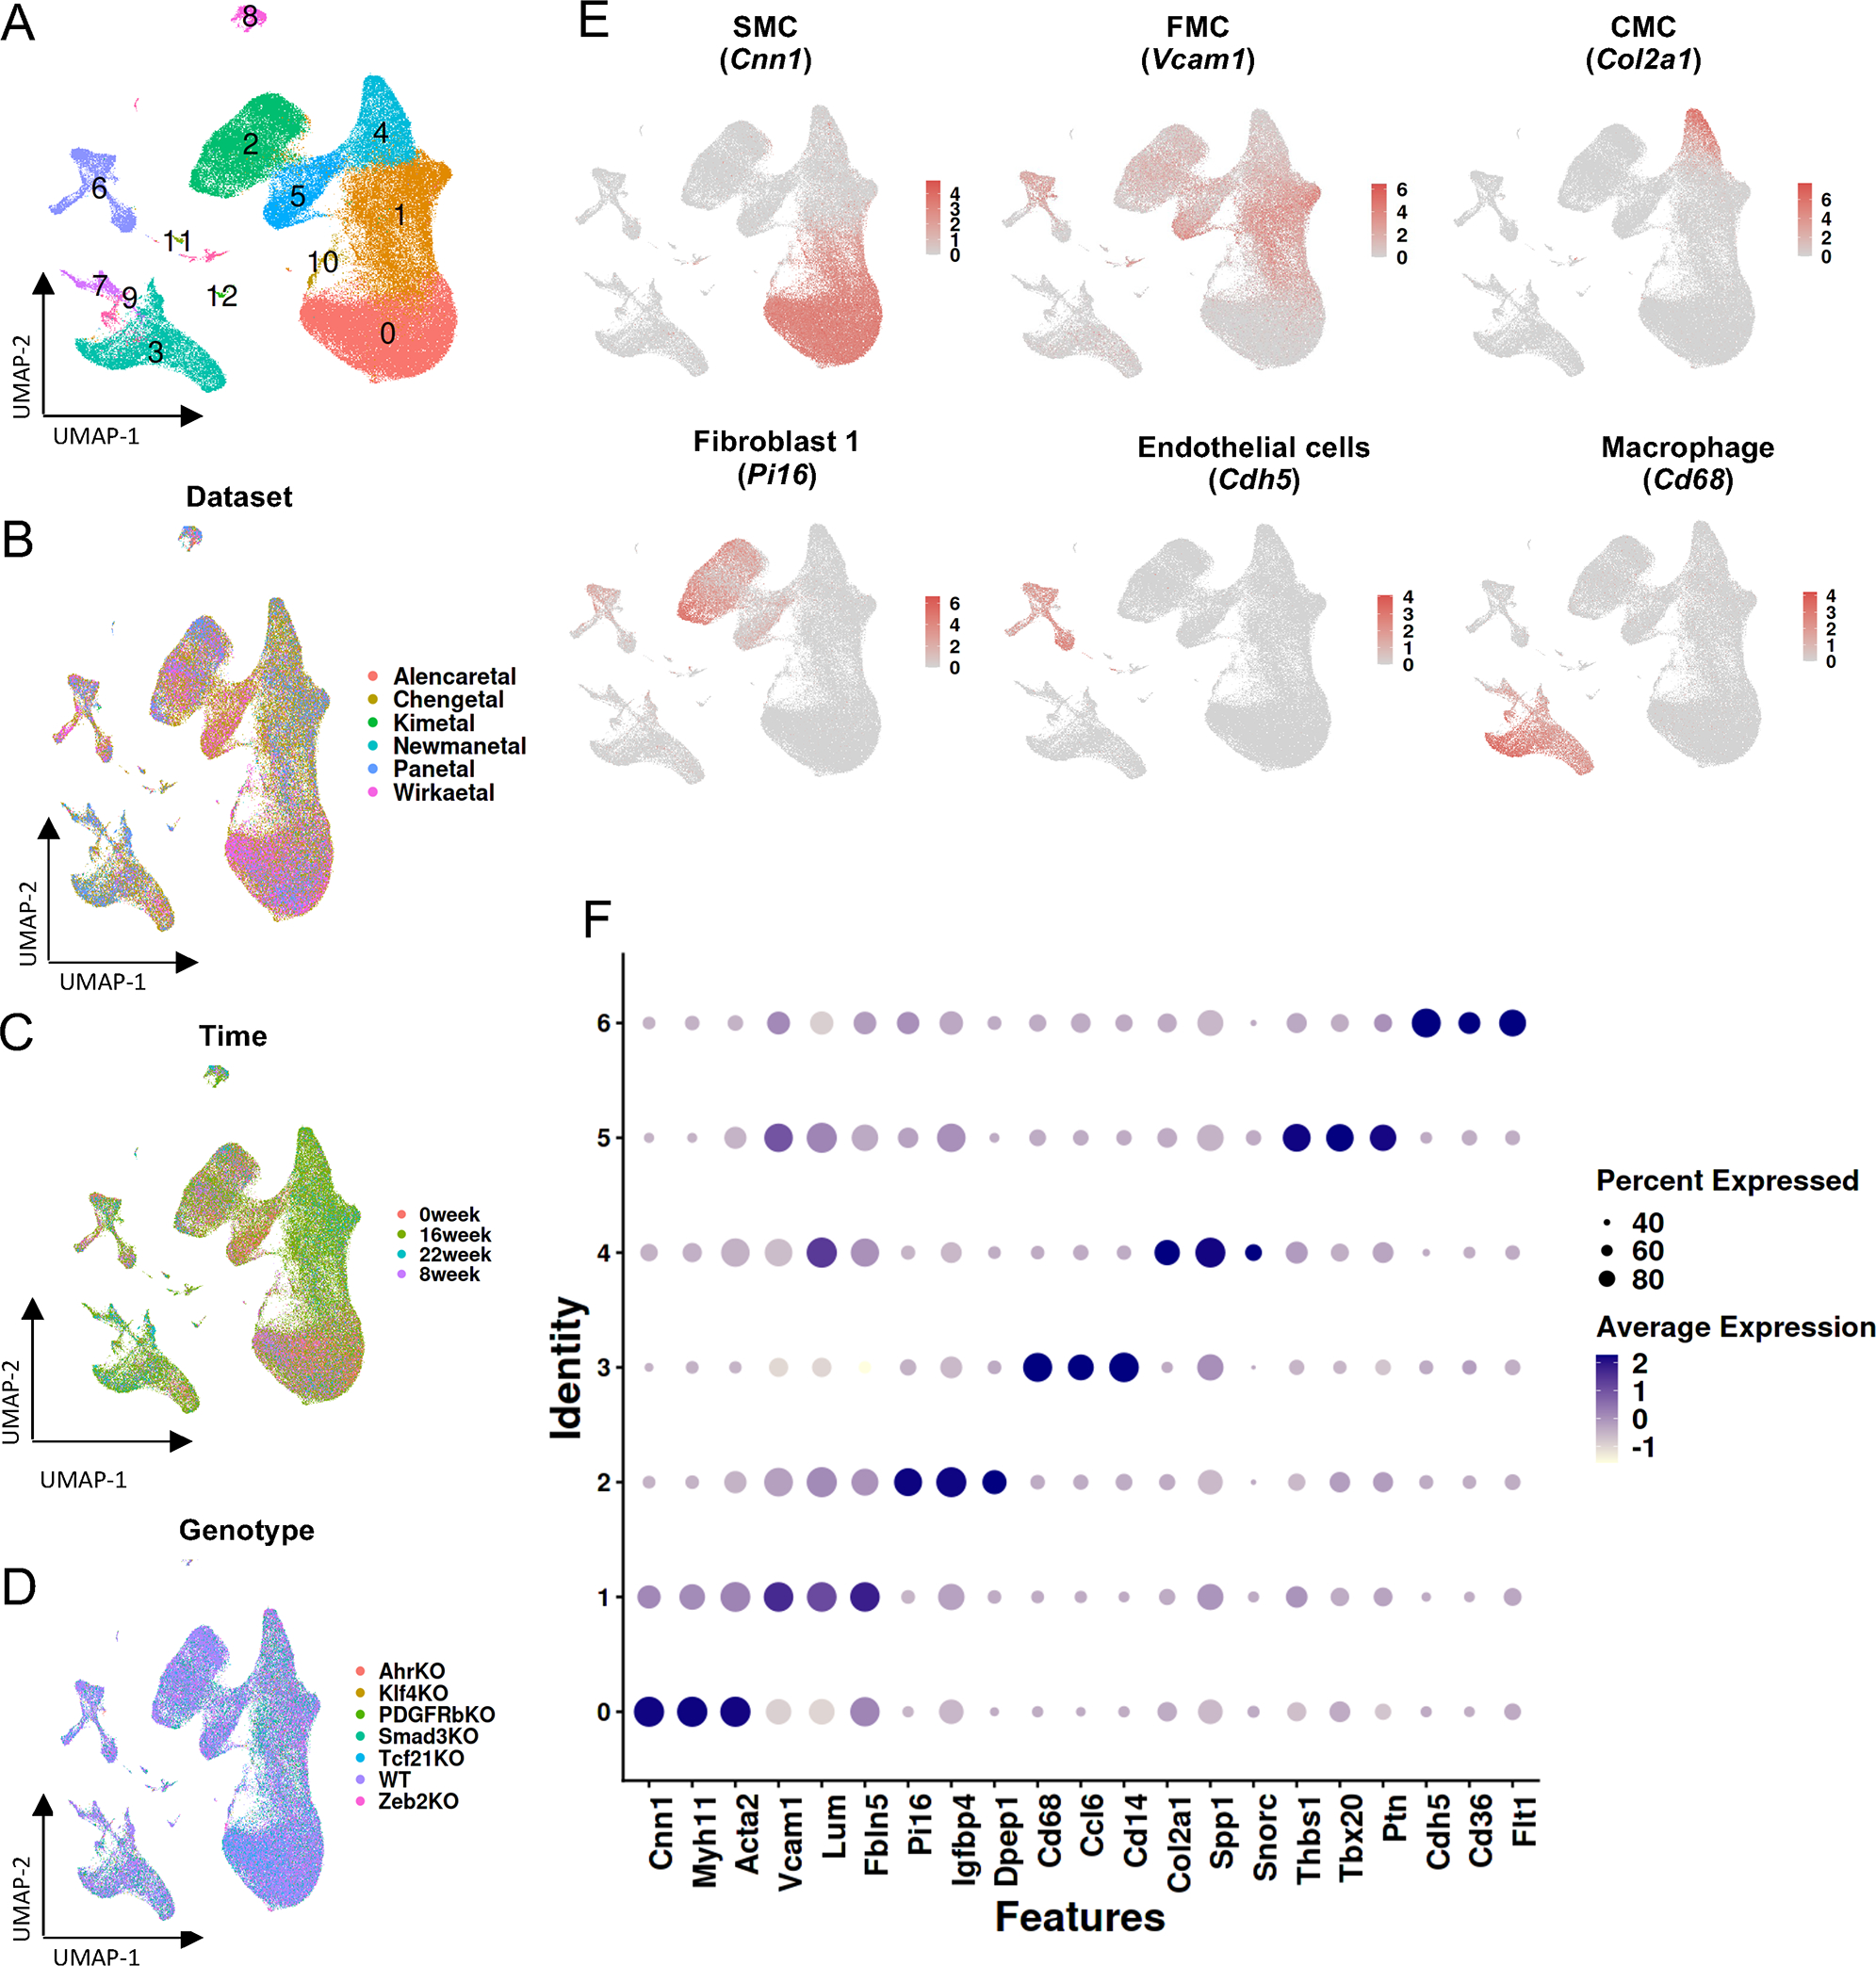
Integration of scRNAseq datasets using reference-based integration. A) Unsupervised clustering of different transcriptomic datasets using Seurat at resolution 0.2. Data dimensionality reduction and two-dimensional representation is shown by UMAP. Major cell types were annotated manually from the integrated UMAP. B) Dataset distribution of cells over the 2-dimensional UMAP. C) UMAP showing data from different timepoints included in the integrated object. D) UMAP representing gene knockout cells included in the object. E) FeaturePlots showing expression of markers from major cell types. F) DotPlot showing the expression of top three markers from the major cell-type groups, with size of the dot showing percent of cells expressing the markers.
Trans-differentiation of SMC to other vascular wall cellular lineages is rare
The availability of single-cell RNA whole gene transcriptomics and SMC lineage tracing in the same cells provides a unique opportunity to investigate the possibility that the resident vascular cells can undergo a complete change in phenotype to another cell lineage. There are a limited number of examples where this type of trans-differentiation occurs in nature21, but given the fact that SMC are not terminally differentiated and retain the flexibility to alter phenotype through an epigenetic process, this has been the subject of much discussion. In addition to the SMC cluster-specific modulated phenotypes noted above, one of the studies included in these analyses has provided evidence that SMC can trans-differentiate to the macrophage lineage. While it is generally agreed that SMC can express inflammatory genes and engulf lipids in the setting of atherosclerosis22,23, whether SMC can transdifferentiate to the macrophage lineage remains controversial. For instance, original analyses of single cell data from SMC-lineage traced cells included in this joint analysis have reported varying estimates of the plaque macrophages being SMC derived, from <0.5% in Cheng et al. to <50% in Pan et al5,7.
In order to test the possibility that SMC can differentiate into macrophages, we performed identical analysis across these disparate individual datasets from different groups. In all datasets, identification of SMC-lineage traced cells was accomplished via expression of fluorescent reporters and detection of reporter-expressing cells with fluorescence activated cell sorting (FACS). However, differing fluorophore brightness, differences in FACS gating and autofluorescence from lipid droplets in certain channels can have large effects on which cells are considered SMC lineage positive. Here, we took advantage of the fact that fluorescent markers can be recovered from the transcriptome, similar to any other expressed gene, if their DNA sequence is embedded in the mapping mouse genome. By leveraging the RNA expression of these lineage markers, we were able to establish a rigorous framework that allowed confident determination of which cells were SMC lineage positive in each dataset. Importantly, we took advantage of the existence of “time point zero” data, which contained the clearly defined quiescent, differentiated “baseline” SMC population, and in the absence of high fat vascular stress did not contain any trans-differentiated SMC. We used this population to determine the cutoffs of fluorescence expression that correctly differentiated SMC from all other non-SMC populations in each dataset.
In the “time point zero” data, we first defined the SMC vs non-SMC populations based upon the well-defined transcriptomic signature of differentiated SMC. For this analysis we chose three datasets, two that did not identify SMC to macrophage trans-differentiation, Cheng et al5 and Newman et al14, and one that did, Pan et al7 (Fig. 2). All “time point zero” data reflected single-cell capture at baseline, prior to high fat diet but after Tamoxifen induction. We then used a histogram to visualize the distribution of fluorophore expression for both SMC and non-SMC populations, highlighting the expression of the lineage markers in SMC, marked in red, compared to all non-SMC marked in grey. Interestingly, while most non-SMC had no expression of lineage florescent markers zsGreen or tdTomato, there was some detectable low-level expression of both fluorophores across all non-SMC populations immediately after gavage at the baseline timepoint, including endothelial cells, macrophages, T-cells, and fibroblasts. (Fig. 2A, 2F). However, in aggregate, these cells were clearly distinguishable from the true SMC population, which displayed a separate, higher distribution of fluorophore expression. To rigorously determine ‘cutoffs’ for fluorophore expression that separate SMC from non-SMC in each study, we performed ROC curve analysis on “time-point zero” data from Cheng et al and Pan et al to generate dataset-specific ROC-AUC curves (Fig. 2B, 2G vertical line, Suppl. Fig. 5). At time-point zero, using these cutoffs, minimal lineage-positive cells lie within the macrophage cluster in either dataset. Because no additional lineage marker induction was performed in either study after the baseline timepoint, we then applied the same cutoff to the high-fat-diet timepoints to determine whether there was significant transdifferentiation of SMC-lineage-traced cells into other cell types. Application of these cutoffs demonstrated that SMC-derived cells did not significantly contribute to the macrophage cluster across all datasets, consistent with macrophages not arising from smooth muscle cells in atherosclerotic plaque (Figs. 2A – 2J). The Newman et al. dataset did not have baseline data14, but we used the histogram to distinguish SMC from non-SMC, and showed that there was no transdifferentiation of SMC to macrophages in this dataset (Fig. 2K–2M). The small number of SMC lineage-positive cells found in the endothelial, macrophage and fibroblast clusters is within the incidence of cell doublets formed by the 10x Genomics technology. While most studies analyzed showed good agreement between FACS-based lineage assignment and fluorophore gene expression-based lineage assignment, the FACS-assigned lineage positive cells in the Pan, et al.7 study deviated significantly due to the inclusion of cells that fell within the low-positive distribution and were thus very likely non-SMC-derived.
Cell-specific expression and anatomical location of SMC lineage populations
In order to get a deeper understanding of SMC and their transition phenotypes in wild-type datasets, we focused on clusters 0,1, 4 and 10 from Fig 1A. A total of 39,373 smooth muscle lineage cells were identified, re-normalized, and underwent principal component analysis, clustering and UMAP visualization. With standard library-size normalization, we observed that the UMAP is dominated with respect to version v2 versus v3 10x capture and processing reagents. In order to overcome this batch effect, we performed Seurat’s reference assembly and transfer learning algorithm weighted on nearest neighbors24. We compared clustering results with different resolutions using ClusterTrees, and found that the SMC were best represented as 9 individual groups (Fig. 3A, Suppl. Fig. 6). All clusters were represented by similar nCountRNA and nFeatureRNA numbers except cluster 8 which had low feature counts, and was excluded from additional investigation (Suppl. Table 1). We examined the contribution of each individual study to the combined data object. Cells from all studies were included in each of the SMC clusters, but there was variance in differential contribution due to the 10x chemistry, total number of SMC in each of the studies, anatomic location, and maturation level of the lesions due to varying length of high-fat diet treatment, etc. (Fig. 3B). The remaining clusters were validated with spatial information, biological pathway assessment and ClusterTrees analysis (Suppl. Fig. 6).
Figure 3.
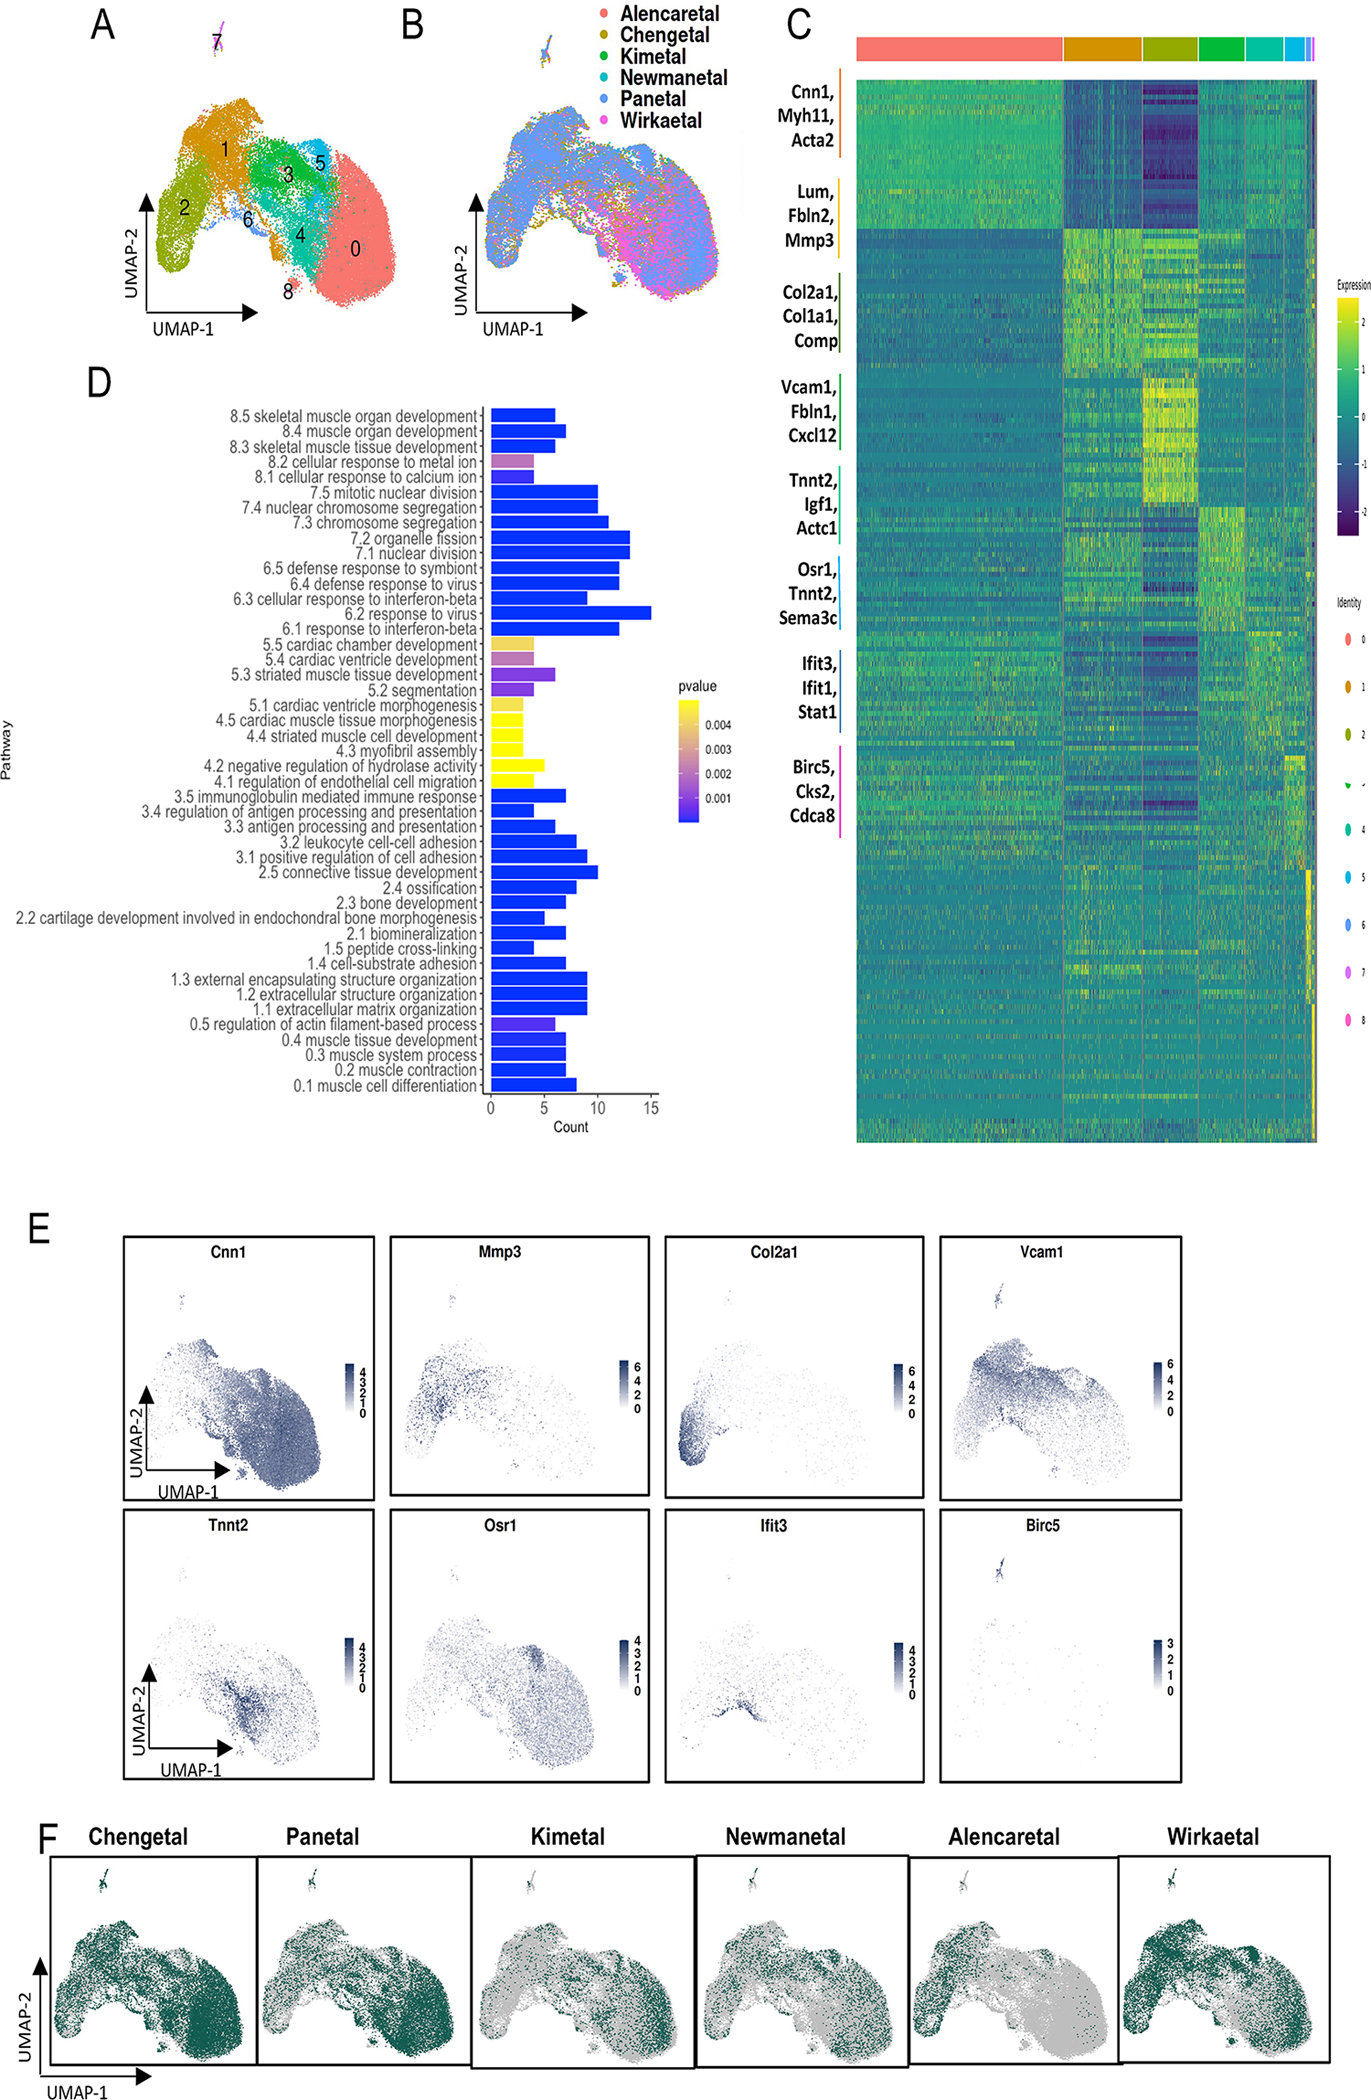
Sub-clustering of wild-type smooth muscle cells. A) UMAP of cells from unsupervised clustering using Seurat at resolution 0.15. B) Dataset-wise distribution of cells across 2-dimensional UMAP. C) Heatmap showing differential expressed genes in smooth muscle cell clusters. Representative genes are identified for each cluster. D) Pathway enrichment analysis for top 30 genes in each cluster identified with clusterProfiler. E) Feature plot for specific markers for each cluster. F) Cells highlighted for each dataset in the integrated wild-type smooth muscle cell UMAP, highlighted in green in the integrated UMAP.
We performed DE gene analysis for the 8 SMC clusters (resolution 0.09) using Seurat’s FindMarkers function to identify marker genes in each cluster and performed pathway analysis using the enrichGO pathway for the top 30 genes in each cluster (Fig. 3C, 3D). This analysis indicated that cluster 0 was enriched for markers of quiescent differentiated SMC, including Myh11, Lmod1 etc., and also enriched for differentiated SMC pathways including muscle cell differentiation, muscle contraction, actin filament organization and muscle cell development (Suppl. Table 2). Cluster 2 cells were enriched for markers of endochondral bone formation, including Col2a1, Ibsp, Comp, etc., and were noted to express genes enriched in pathways identified with extracellular matrix organization, chondrocyte differentiation and ossification. We have previously termed these cells chondromyocytes to indicate their origin from SMC and the adoption of the chondrocyte-like phenotype18.
SMC lineage cluster 1 cells were characterized by marker genes Vcam1, Lum, Thbs1, as well as matrix protein genes Fbln1 and Serpina3 which are typical for the fibroblast-like cells that we have previously termed fibromyocytes (FMC). Another lab has used the term fibrochondrocytes to describe cluster 1 and 2 cells7. Interestingly, the cells constituting cluster 3 exhibited expression of genes related to immune pathways, including leukocyte cell-cell adhesion, antigen processing and immunoglobulin mediated immune processes (Fig. 3D). Cluster 4 was composed of cells expressing multiple cardiac development and morphogenesis genes, including Tnnt2, Tcap, Osr1, Smoc1 (Fig. 3A, 3E). This is consistent with recent findings from Pedroza et al, showing that Tnnt2 positive smooth muscle cells are primarily derived from the second heart field, and contribute primarily to the outer layer of aortic medial SMC25. Also consistent with the findings of Pedroza et al, the data included here from Newman et al14 and Alencar et al4 do not identify this group of cells. Their data were derived from the brachiocephalic artery, which does not contain second heart field-derived cells. Further, their lesion samples were comprised of microdissected disease tissue, and would not be expected to include the more abluminal located Tnnt2 expressing medial cells.
Cluster 5 cells also expressed Tnnt2 as well as a number of contractile genes shared with skeletal muscle and cardiac cells, suggesting that this cluster represented a unique group of differentiated SMC not previously recognized, and raised the possibility that they were initiating phenotypic modulation to one of the other characterized transition phenotypes. Cluster 6 cells were noted to express a large number of interferon regulated genes, including Isg15, Ifit3, Ifit1, and Irgm. These genes are known to be upregulated in the setting of decreased Adar1 RNA splicing, and have been linked to SMC function and abdominal aortic aneurysm formation26. These findings suggest that activation of the interferon pathway in SMC due to perturbation of critical RNA splicing functions represents a critical component of inflammatory atherosclerotic disease processes. Cluster 7 showed enrichment for cell-cycle pathways such as nuclear division, organelle fission and chromosome segregation, suggesting that this cluster was primarily specified by gene expression patterns related to cell division, and did not represent a distinct SMC lineage cell phenotype (Fig. 3C, 3D).
To link the predicted functional profiles of the different SMC lineage cluster cells, we conducted immunohistochemistry and RNAscope experiments for cluster-specific markers with aortic root tissue sections from the ApoE KO mouse model. For cluster 0, TAGLN immunohistochemistry identified an expansive number of medial and fibrous cap SMC, while CNN1 stained a much more restricted number of medial and fibrous cap cells (Figs. 4A, 4B). However, the overall pattern was similar for antibody staining for the two SMC differentiation markers. Vcam1 was used as a marker for cluster 1 cells (FMC), and there was a strong hybridization signal in the region of the fibrous cap and deeper in the abluminal region of the plaque (Fig. 4C). We investigated the lesion localization of the chondromyocytes with probes for Col2a1 and Ibsp, and localized these cluster 2 cells to the abluminal region of the plaque near the basal acellular core areas (Figs. 4D, 4E). For cluster 5, we identified low-level expression in a large proportion of medial SMC, consistent with expression of contractile protein differentiation markers (Fig. 4F). Cluster 4 cells representing secondary heart field cells was previously localized to the outer segment of the aortic wall by Pedroza et al.27 Finally, we were not able to localize the cluster 6 SMC expressing inflammatory markers. This could have been the result of tissue slide sampling error or differences in the animals used for scRNAseq versus RNAscope. Negative controls for RNAscopes and immunohistochemical stainings are shown in Suppl. Fig. 7.
Figure 4.
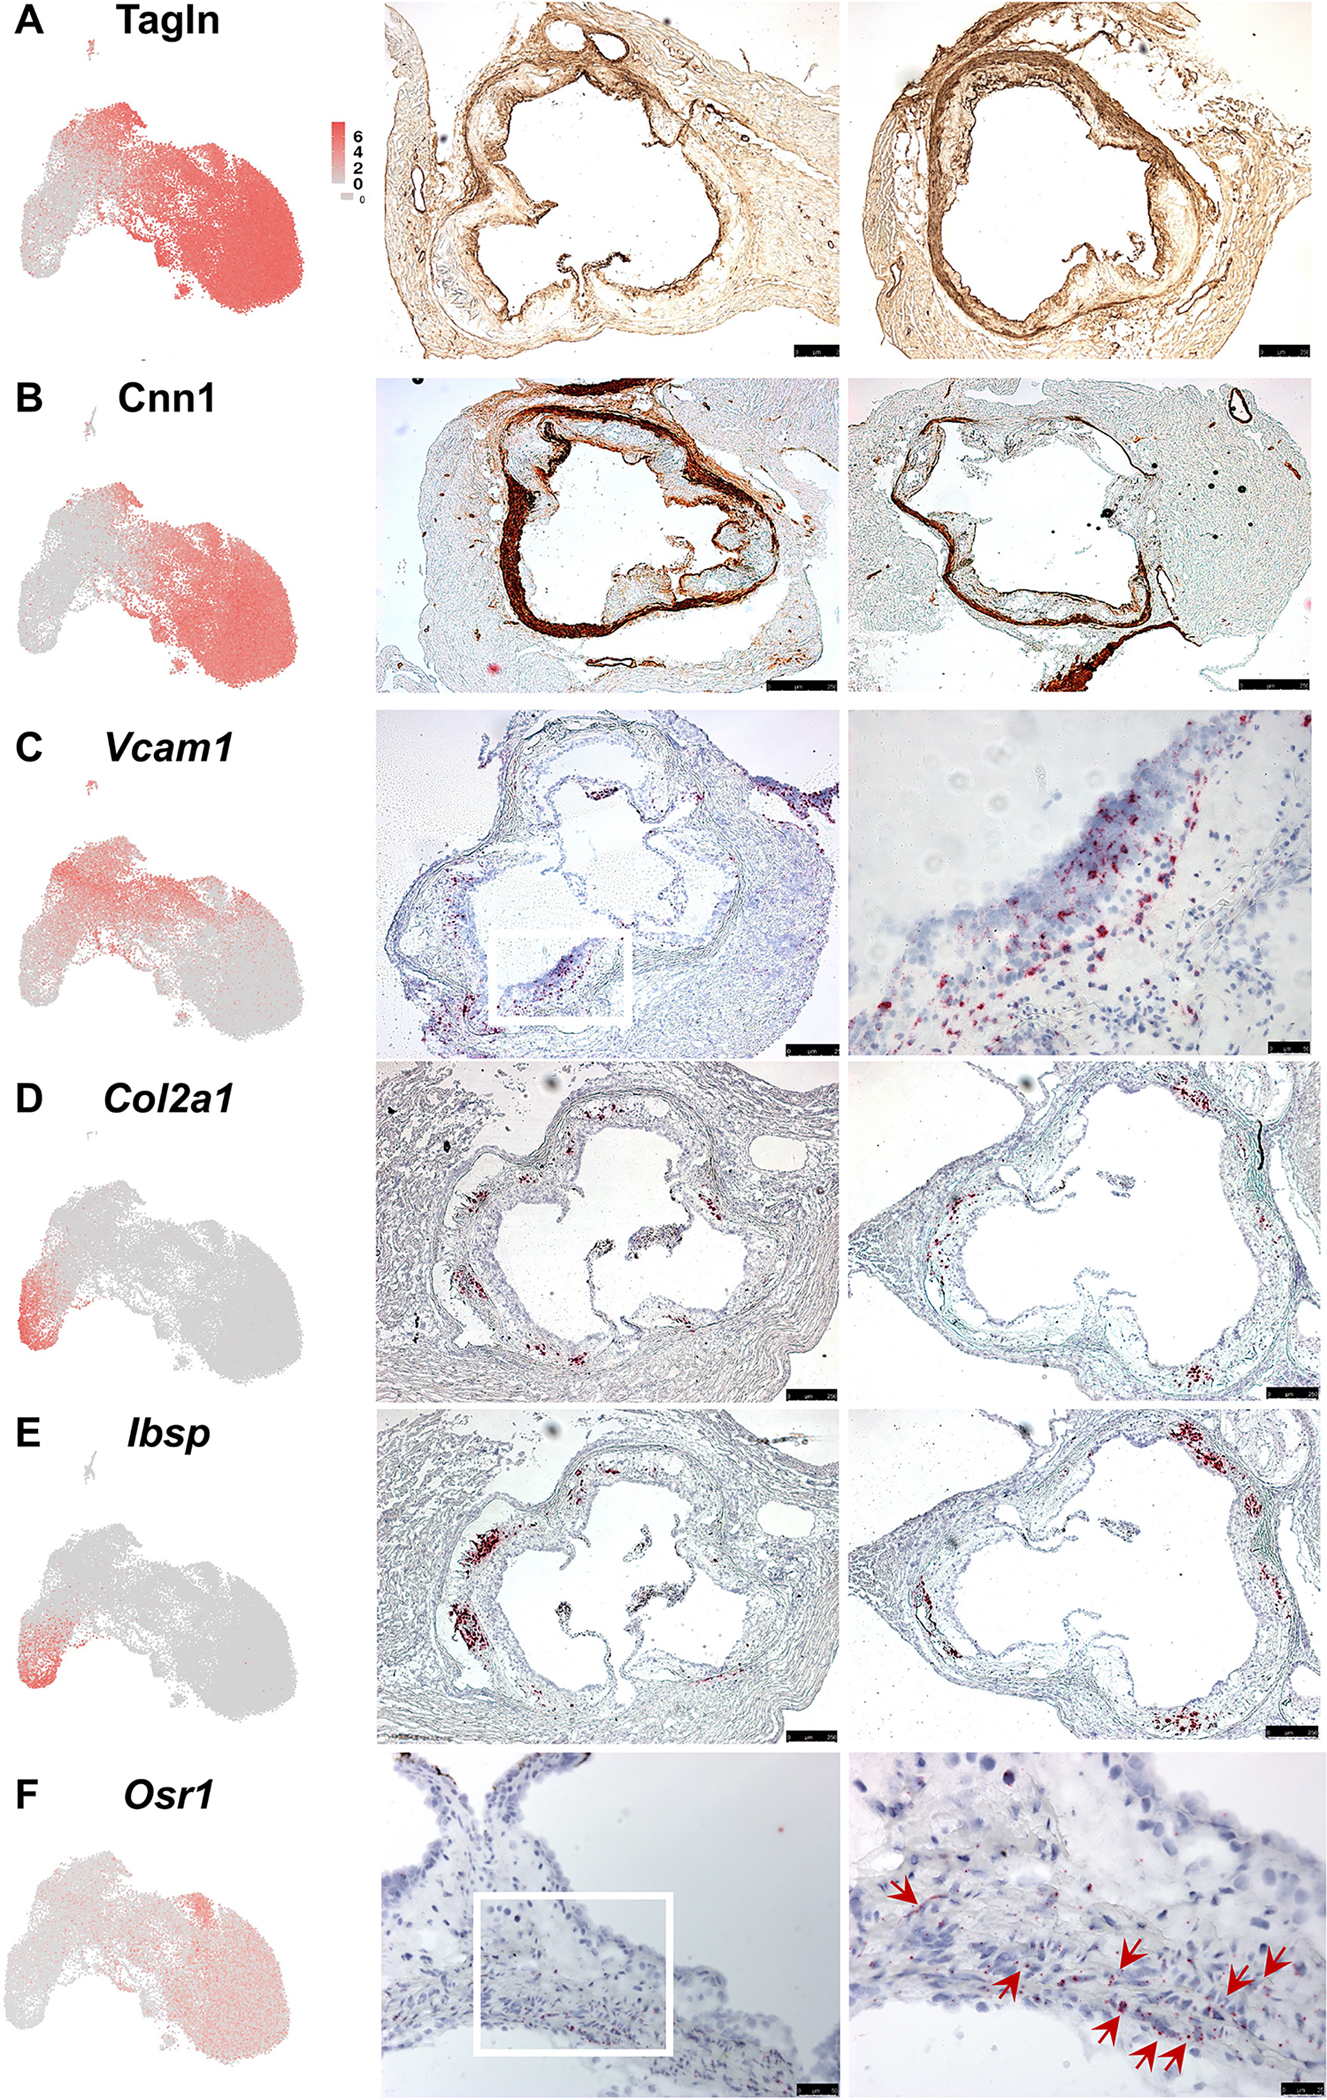
Validation of selected markers for distinct smooth muscle cell populations using immunohistochemistry and RNAscope. A) Tagln and B) Cnn1 immune labeling for these quiescent smooth muscle cell markers. C) RNAscope for fibromyocyte marker Vcam1, D) chondromyocyte markers Col2a1 and E) Ibsp, and F, G) cluster 5 marker OSR1. In situ reaction is visualized as red color.
To investigate the consistency of the findings from these marker localization assays across arterial beds, we also probed for expression of SMC markers in the aortic arch and brachiocephalic arteries (Suppl. Fig. 8). In general, the proportion of hybridized cells and their location within the diseased vessel wall corresponded well in these arteries compared with the aortic root. However, the brachiocephalic artery showed somewhat fewer cells with hybridization for Vcam1, Col2a1 and Osr1.
Cell-specific expression and anatomical location of endothelial cell lineage populations
Clustering of the dataset at the low resolution of 0.001 revealed one large cluster of EC, while clustering at the higher resolution of 0.5 produced 11 EC clusters. Previous detailed analysis of EC phenotype has suggested the presence of a mixture of transcriptionally distinct endothelial populations that occupy the vessel wall19. To determine a reasonable estimate of the number of biologically meaningful clusters that reside within this integrated dataset we first subsetted the EC, as defined by expression of Pecam1 and other canonical markers, and then performed principal component analysis, nearest-neighbor modularity optimization-based clustering, and UMAP visualization of these cells alone. We performed clustering at multiple resolutions, and used the ClusterTrees algorithm as a guide for visualizing the lineage of clusters with varied clustering resolution (Suppl. Fig. 9). This approach revealed 7 EC clusters at a resolution of 0.15 and their dataset-wise visualization respectively (Fig. 5A). In the UMAP visualization, the EC are divided into three large clusters and a few small, isolated clusters, with one of the large clusters further dividing into 3 transcriptomically distinct clusters. All of the clusters appeared to contain individual cells from each of the datasets (Fig. 5B). The two small, rare clusters occur at a frequency that is below the expected rate of doublets for 10x capture, and appeared to contain genes such as Cd74 and H2ab1 which are specific for other cell types and not EC, suggesting that these two clusters were likely doublets. They were excluded from further analysis.
Figure 5.
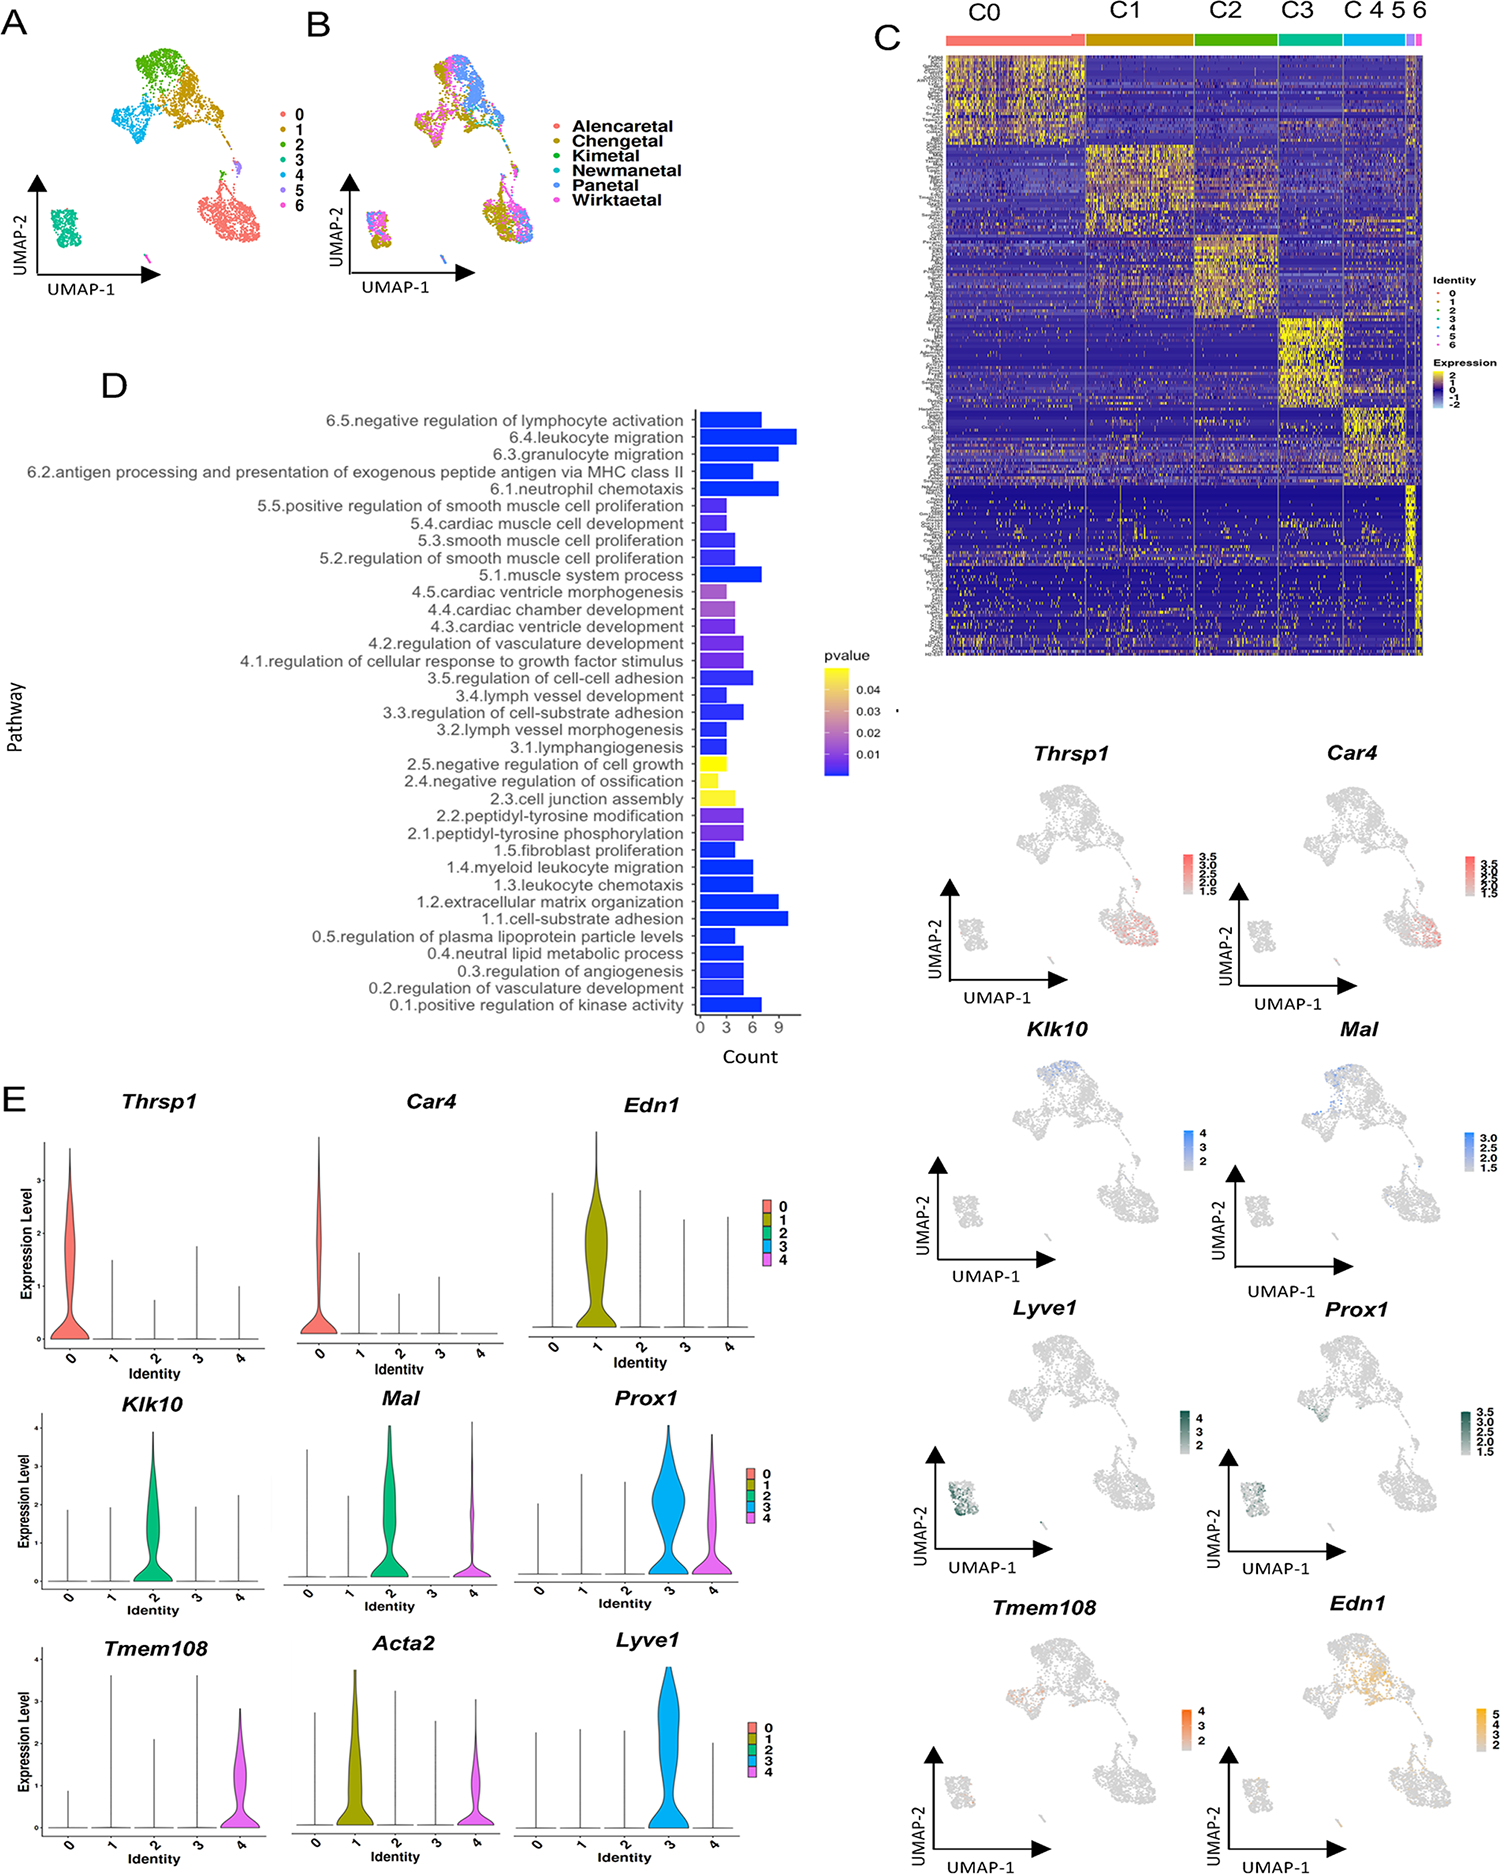
Distinct clustering of endothelial cell population in wild-type datasets. A) Unsupervised clustering using Seurat at resolution 0.15. B) Dataset-wise distribution of cells across 2-dimensional UMAP. C) Heatmap showing top 30 markers for each cluster at resolution 0.15. D) Pathway enrichment analysis for top 30 genes from the heatmap using clusterProfiler. Pathways are identified by the first digit representing the cluster number and a decimal assigned sequentially for individual clusters. E) Violin plots show specific markers in endothelial cell clusters. F) Feature plots showing the expression of gene markers selected for validation.
To investigate differences in functional annotation between these endothelial subclusters, we identified the top 30 significantly differentially expressed (DE) genes with p-value <0.01 by Wilcoxon rank-sum test and 0.5 log-fold enrichment. These DE genes were shown to be independently clustered in 7 groups by heatmap (Fig. 5C). Pathway analysis was conducted with clusterProfiler for these DE genes to investigate possible cluster-specific functions (Fig. 5D, Suppl. Table 3). Cluster 0 top genes included Lpl, Thrsp, Cd36, Scarb1 and Gpihbp1, which were enriched for lipid metabolism terms, Cxcl12, Flt1, Kdr and Col4a2 for blood vessel morphogenesis and Rgcc, C1qtnf9, Tcim and Cdkn1a for the kinase activity pathways. This gene expression profile is similar to that identified for the “lipid processing” cluster previously characterized19. In cluster 1, 10 out of 30 genes, including Edn1, Col8a1, Spp1 and Lgals1, belonged to cell-substrate adhesion pathways and extracellular matrix organization. This cluster also included chemotaxis, migration and angiogenesis regulation pathways as well, with marker genes such as Serpine1, Fn1 and Sfrp1. Of note, this cluster also was found to express Acta2, which has been used as the marker for endothelial-mesenchymal transition (EndoMT) in this cell type, providing single-cell transcriptomic evidence for this process. Acta2 is found only in this large cluster but not the others, suggesting only a subset of endothelial cells found in the vessel wall can undergo EndoMT. Cluster 2 has 5 out of 29 genes belonging to the peptidyl-tyrosine modification pathway with genes such as Ptprj, Bmx, Ehd4 and Efemp1. Additional annotations included negative regulation of ossification and cell growth. Cluster 3 DE genes and pathways pointed to lymphatic endothelial cells enriched in lymph vessel development, endothelial cell migration and cell-cell adhesion with marker genes such as Lyve1, Prox1, Pdpn and Nr2f2. Cluster 4 showed enrichment of cardiac development and vasculature development. The cluster included high expression of genes including Wnt4, Dcn, Enpp2, Hand2 and Postn.
Multiple studies have sequenced endothelial single-cell RNA to cluster and define the cell populations28–34. Single cell RNA sequencing of the healthy mouse aorta by Kalluri et al. previously identified three distinct EC populations19. One of their clusters was identified as a lymphatic EC cluster and 2 other populations with lipoprotein handling, angiogenesis and extracellular matrix production functions. We compared the populations identified in this previous publication with our data and found that the EC1 population is similar to our cluster 2, EC2 with cluster 1 and EC3 with our cluster 0 (Suppl. Fig. 10). Even though the heatmap shows very distinct markers similar to Kalluri et al., we observed that the pathway analysis does not show specifically related pathways. Interestingly, the pathway analysis of endothelial cells does not show distinct pathways, for example, cluster 0 shows kinase activity, lipid modeling as well as blood vessel morphogenesis.
To locate these transcriptomically distinct populations of EC in the diseased vessel wall, we performed RNAscope using cluster-specific markers, including: Thrsp1 and Car4 for cluster 0, Edn1 for cluster 1, Klk10 and Mal for cluster 2, Lyve1 and Prox1 for cluster 3 and Tmem108 for cluster 4. Violin plots and feature plots confirmed the specificity of these markers (Figs. 5E, 5F). In addition to the above pathway analysis suggesting unique functions of these endothelial cell clusters, each of the clusters displayed distinct anatomic locations in the vessel wall (Fig. 6). Cluster 0 EC were found to reside in the adventitia and myocardial interstitium, where they contribute to the microvasculature. The large number of these microvascular EC is congruent with a role in lipid metabolism, and their contribution to the microcirculation with an angiogenic function, especially in the adventitia of diseased vessels in the context of vascular disease. Clusters 1 and 2 were found on the luminal surface of the aorta, with expression of cluster 2 markers Klk10 and Mal found at the surface of aorta without plaque, and cluster 1 EC, as marked by Edn1 expression, being found on the surface of plaques and in the luminal neointima. This location of cluster 1 cells at the luminal and sub-luminal aspects of disease plaque, along with their expression of Edn1 and Acta2 further suggests these are EC undergoing EndoMT. Cluster 2 cells were functionally linked to cell growth and tyrosine signaling pathway modification, and thus these cells may represent EC that are responding to early atherosclerosis signaling pathway activation.
Figure 6.
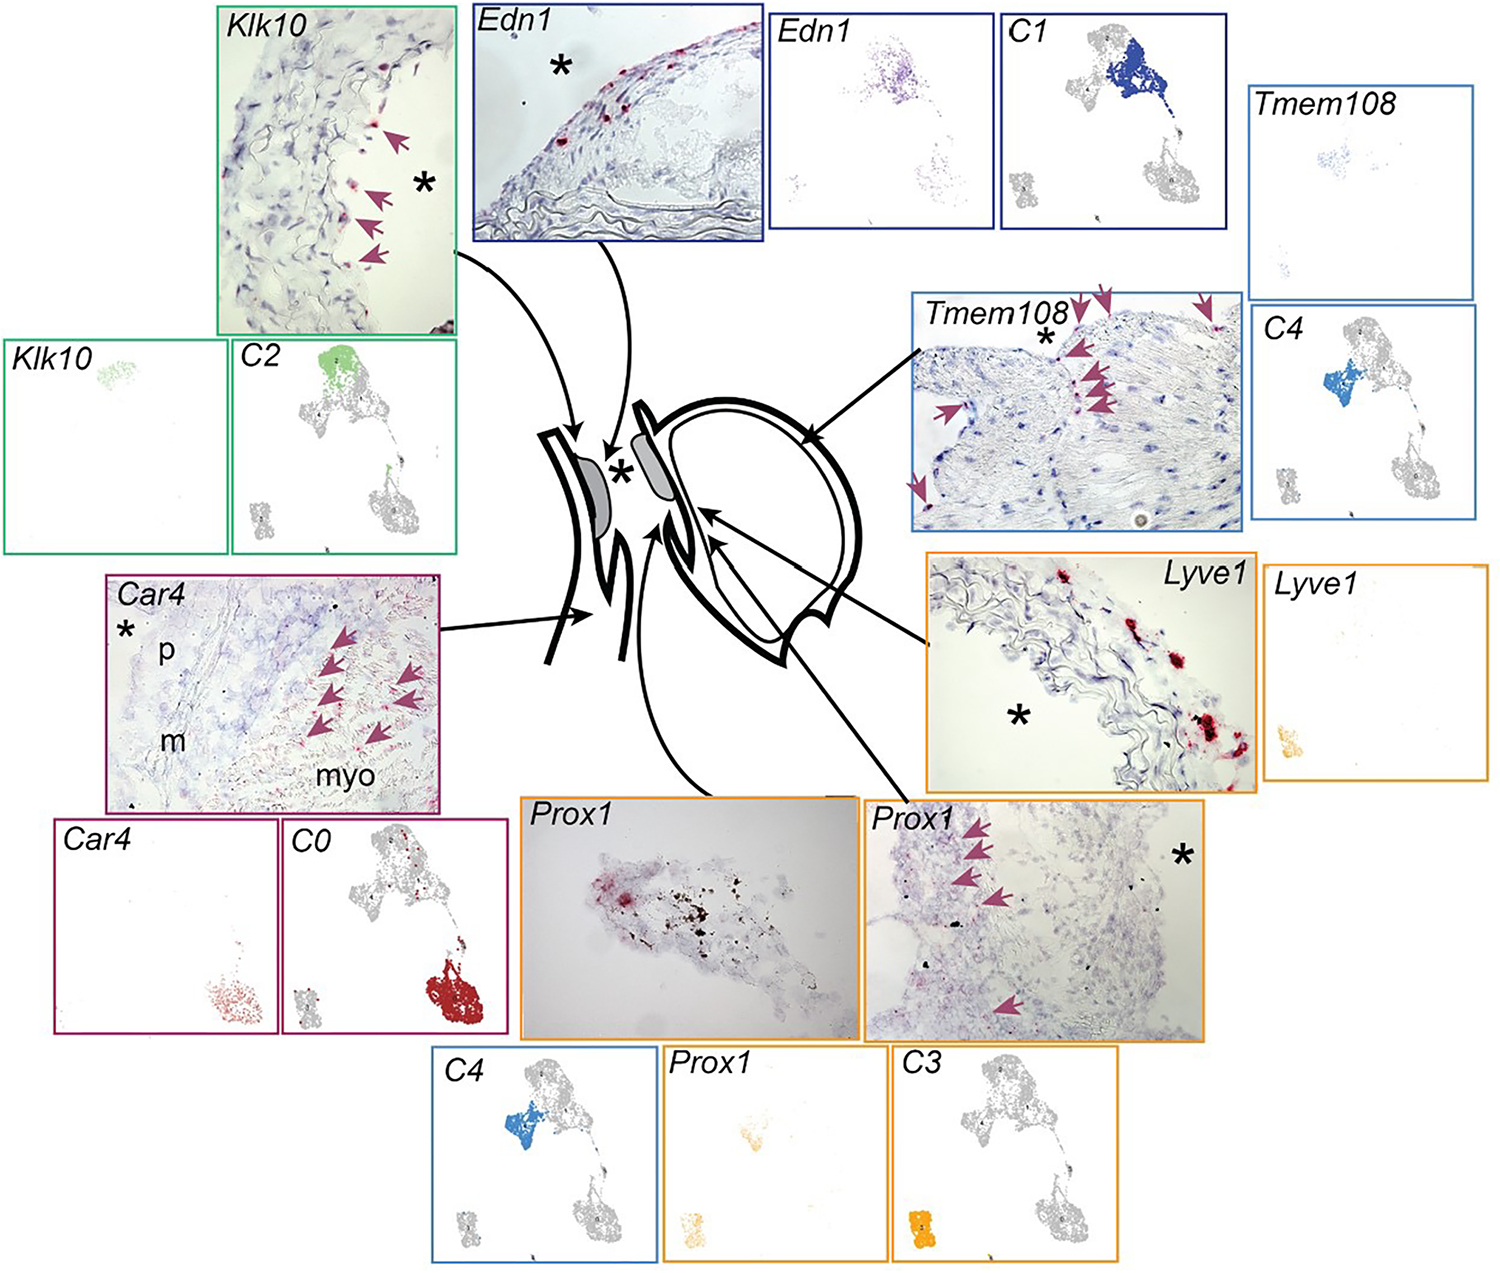
In situ hybridization localization of endothelial cell clusters. Individual marker genes were identified with the “findmarker” algorithm in Seurat, and tissue hybridization performed with RNAscope. For each cluster and marker, RNAscope hybridization, cluster assignment, and feature plots are shown. Anatomical locations of cells expressing cluster markers were identified as follows: cluster 0, marker Car4, interstitial microvascular EC; cluster 1, marker Edn1, modulated EC in disease plaque; cluster 2, marker Klk10, large vessel luminal endothelial cells; cluster 3, marker Lyve1 in the adventitia and marker Prox1, lymphatic EC in the adventitia, and aortic valve fibroblasts; cluster 4, Tmem108 and Prox1, endocardial EC and valve cells. In situ reaction is visualized as red color.
In keeping with their expression of lymphatic marker genes Lyve1 and Prox1, and pathway enrichment for lymph vessel morphogenesis, cluster 3 EC were localized to the adventitia where they were found to be associated with linear vascular-like structures, presumably lymphatic vessels. Cluster 4 EC gene Tmem108 expression was localized to the atrial endocardium and to a lesser extent the atrial interstitium. Interestingly, cluster 3 marker Prox1 was noted to be expressed by a small number of cluster 4 EC, and its expression in aortic valve leaflets consistent with the contribution of these cells to cluster 4. The localization of cluster 4 cells was supported by the absence of these cells in datasets exclusively derived from the brachiocephalic artery.
We have also investigated expression of these EC markers in the aortic arch and brachiocephalic arteries, with overall consistent results but with some noted differences (Suppl. Fig. 11). Cluster 0 genes Car4, and Thrsp marked the cardiac interstitium and adventitia, cluster 1 gene Edn1 identified EC near the fibrous cap, but there was a smaller number of Edn1 expressing cells in both the arch and brachiocephalic arteries. Cluster 3 cells expressing Lyve and to a lesser extent Prox1 labeled adventitial EC in both of these vessels. Cluster 2 gene Klk10 identified a small number of EC near the vessel surface. Taken together, these data suggest that these functionally distinct populations previously identified are not present in the artery as a mosaic mixture, but rather reside in spatially distinct domains. Single-cell clustering analysis has clearly highlighted the biological and anatomical differences influencing the functional differences among the endothelial subtypes.
Characterization of cellular populations that contribute to the aortic valve
We and other groups have routinely found that the fibroblast cells identified in studies of the aortic root are composed of two distinct cellular populations25,35. While one of these clusters, the fibroblast-1 cells, cluster 2 in the integrated UMAP (Fig. 7A), appeared to be the dominant primary adventitial fibroblast population, the anatomical location of the second, fibroblast-2 population has remained unknown. We hypothesized that these cells, which comprise cluster 5 in the combined object (Fig. 7A), might contribute to the aortic valve, which was often included in tissue dissections. To localize clusters in situ with RNAscope, we first identified cluster-specific markers. Igf1 and Tbx20 expression was highly specific for the fibroblast cluster and was detectable within the aortic valve leaflet body consistent with valvular interstitial cell (VIC) identity (Figs. 7A, 7B). Expression of markers Spp1 and Tnfrsf11b was less specific to the fibroblast clusters, showing expression in SMC derived fibromyocyte and chondromyocyte clusters. Interestingly, Spp1 and Tnfrsf11b expression was spatially restricted to the junction of the leaflets and aortic wall, consistent with the distinct commissural/leaflet hinge population identified histologically by Richardson et al. using similar lineage-tracing strategies36. Accordingly, we identified this cluster as valvular commissural cells (VCC). We anticipate that further characterization of these cells will provide a useful resource for future studies of degenerative aortic valve disease.
Figure 7.
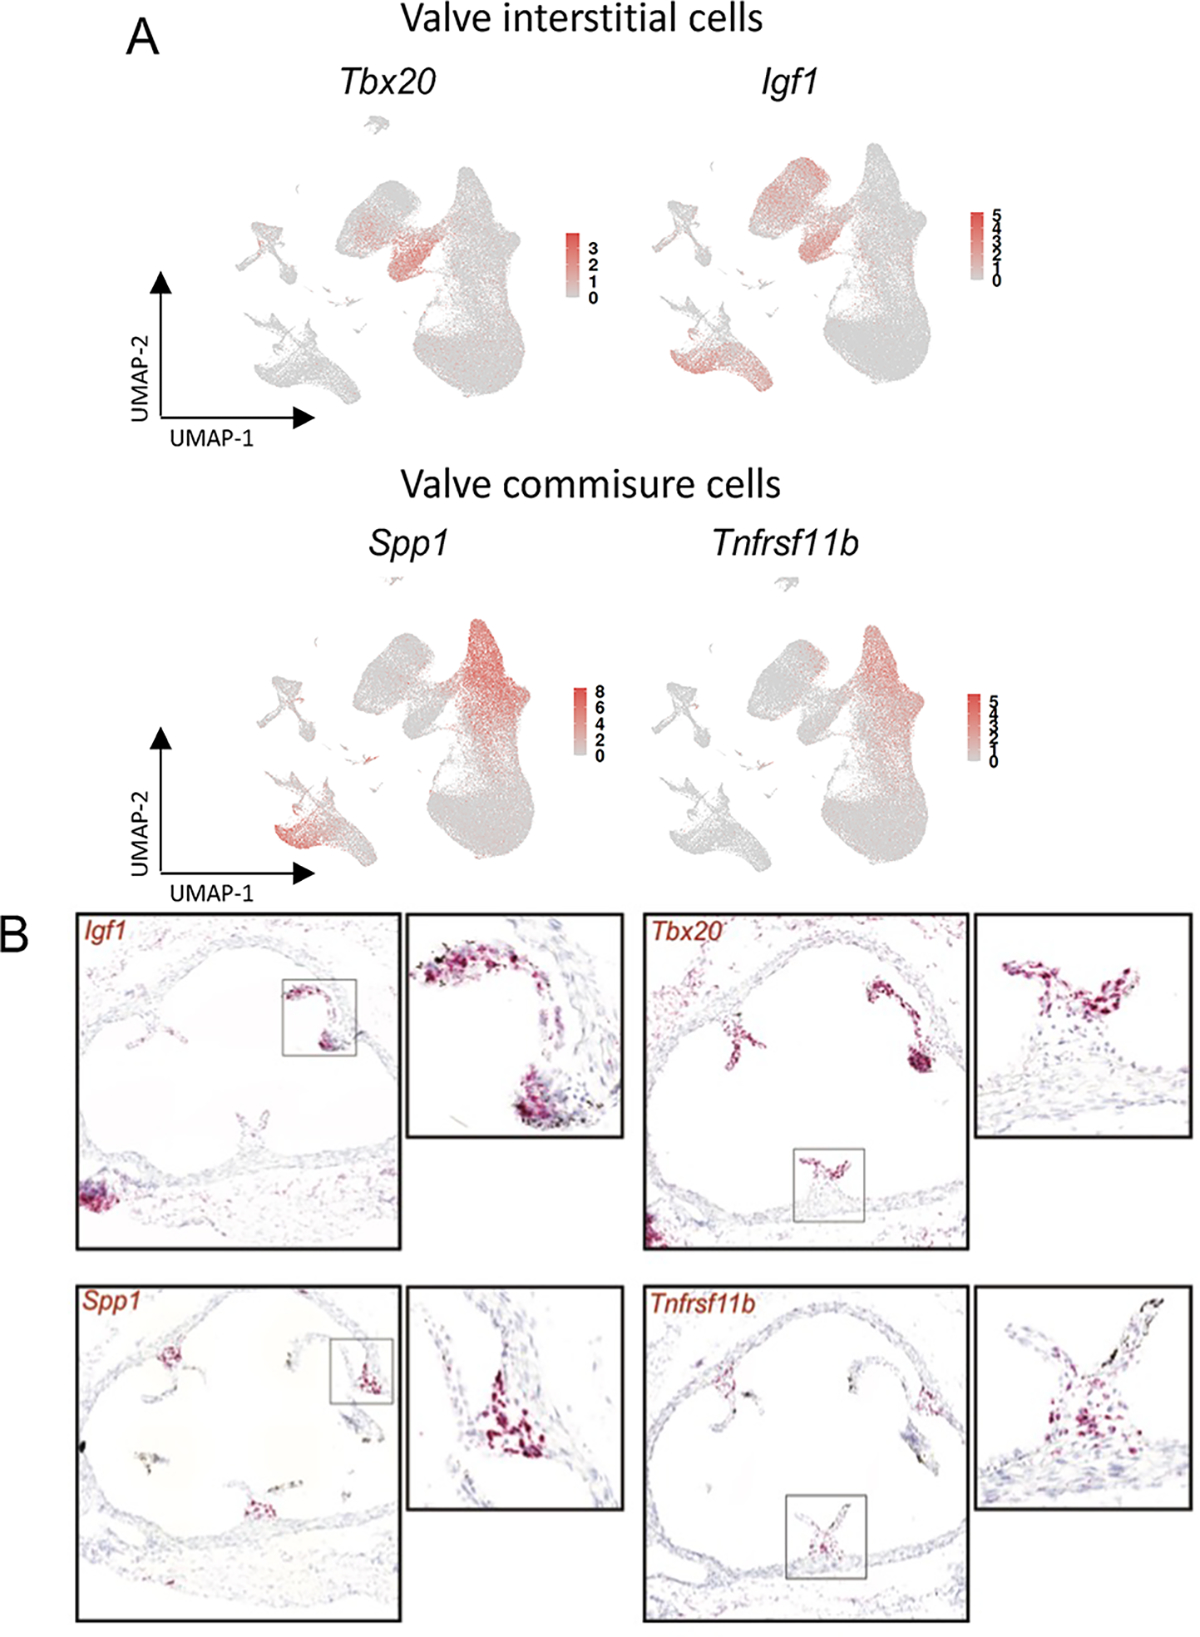
Identification and localization of aortic valve cells. A, B) Fibroblast cluster 5 marker genes Tbx20 and Igf1 were enriched in valve interstitial cells. Valve commissure cells were marked by FMC / CMC genes Spp1 and Tnfrsf11b. Cell-specific expression of these markers was characterized by RNAscope studies of valve tissues.
Discussion
This study involves a comprehensive integration of individual single-cell transcriptomic datasets that include cell-specific lineage tracing as well as contemporary genetic and genomic analytical methods to characterize the pathophysiology of atherosclerosis. These individual studies varied based on dissection, fluorescence markers and FACS gating strategies, tamoxifen administration, knock out genes as well as the time of sample collection. In addition, the authors have analyzed the datasets with different dimensionality reduction methods and clustering resolutions. Together, these issues make it difficult to compare the disparate datasets and observations. However, our thesis has been that combining these datasets will provide a unique opportunity to gain insights into the fundamental cellular and molecular processes during disease, and to provide a common framework upon which to compare genetic risk mechanisms. We have also undertaken the integration of these datasets to understand whether differences in reported findings represent fundamental differences due to experimental details, data analysis methods, or differences in interpretation of the findings. We attempted to include the highly relevant Chen et al35 dataset in our study but for unclear reasons, that data could not be integrated well with the other datasets without extreme measures that we felt would compromise the final composite data object and lead to spurious results.
We would like to point out that Zernecke et al 202037 and Zernecke et al 202338 have also integrated multiple scRNAs sequencing datasets of immune cells from healthy or atherosclerotic mouse aortas to show different sub-populations of macrophages, dendritic cells as well as T-cells. In this study we have focused on cells other than immune cells such as smooth muscle cells, endothelial cells and fibroblasts.
Batch-effects in the single-cell analysis can result from differences in sequencing depth, sequencing lane, cell isolation protocol, version differences in the experimental processing reagents, experimental lab, and sample handling. Other than these technical variations, there are biological factors such as fundamental phenotypic differences in the cells studied, unappreciated differences between experimental models, circadian variation due to differences in tissue harvest time, etc. The datasets included in our study were generated with cells captured and processed with v2 chemistry4,6,18 as well as v3 chemistry5,7,14. Due to the updated technology, datasets sequenced with v3 datasets provided identification of a greater number of transcripts and more UMIs per transcript, especially for more lowly expressed genes. Thus, the batch effect due to the differences in the chemistry used among the datasets was a dominant factor in data variance after normalization and dimensionality reduction, despite attempts to harmonize the different technologies with the Seurat. It is always a concern that the implementation of batch correction methods can eliminate true biological differences among samples. Correcting batch-effect is a trade-off between keeping the true biological signals and removing only the technical variations by not over-correcting the data. Multiple studies have been published that have compared different batch-effect correction methods and compared these trade-offs. In analyses reported here, we performed Seurat’s integration based on transfer learning and anchor based approach which is one of the most conservative and effective methods identified in a comprehensive analysis of different batch correction methods39. Leucken et al 2022 compared 68 different combinations of methods and processing and found that Seurat integration method was able to integrate differences among sample locations and technique differences as some tools confuse it as biological variations40.
The datasets included in this study have used different fluorescent markers such as tdTomato5,6,18, Zsgreen17, eYFP14 and eGFP4. We observed that these markers had very similar recombination efficiency and differences in fluorophores did not affect the interpretation or understanding of the dataset. There were differences in the specific vascular tissue included in the cell samples: aortic root only, the aortic root plus the ascending aorta, and only plaque tissue from the brachiocephalic artery. These differences created variation in the contribution of datasets to cellular clusters, for instance there were no Tnnt2-expressing cells in the Alencar et al and Newman et al datasets, but overall, this did not produce fundamentally different results.
Merging scRNAseq datasets allowed us to better understand transcriptomically distinct endothelial cells and their possible functions. Transcriptionally distinct endothelial sub-populations have been demonstrated by previous single cell analysis of murine vasculature19. Analysis of the current large-scale single cell dataset identified EC clusters that validated and extended these previous findings. The larger number of cells allowed us to further sub-cluster certain groups of endothelial cells into more disease relevant, transcriptionally distinct populations, and confirm the finding to be generalizable across different vascular beds. This includes a subset of endothelial cells that undergo transcriptomic shifts in atherosclerotic plaques that are present in all of the tissues examined. The functionally distinct nature of these populations of cells has been demonstrated in the past using pathway analysis of enriched genes, which we were able to recapitulate. However, by identifying the exact anatomical location of individual clusters using specific marker genes, we uncovered further insights into the transcriptomic and putative functional phenotype. The previous understanding has been that these functionally distinct endothelial populations represent the presence of a mixture of multiple functionally distinct endothelial cells on the luminal surface. However, RNA in situ hybridization revealed that each “putatively functionally distinct” population is also spatially distinct. This is best illustrated by EC that cover the surface of the valves and endocardium, for example, which are present only in datasets where the aortic root valve is included in the capture. Previously identified distinction of “lipoprotein handling” and “Intergin signaling” endothelial cells appeared to reflect large vessel endothelial cells and endothelial cells found in microvascular tissue respectively. This type of information was not captured with pathway analysis, demonstrating the importance of complimentary high resolution spatial transcriptomic confirmation of single cell RNA sequencing data.
There was overall agreement with respect to the SMC cell state changes in the basic mouse atherosclerosis models, with transition from a contractile phenotype to a more fibroblast-like phenotype that expresses a complement of matrix proteins6, and also to a cell that expresses genes consistent with a osteo-chondrogenic phenotype5,8. All studies were shown to contribute cells to these transition phenotypes (Fig. 3B). These phenotypic transitions were consistent with a continuous process from differentiated contractile cell to the fibroblast phenotype and subsequently to the chondrogenic phenotype, and pseudotime analyses were consistent with this type of continuous trajectory. Proof of a single primary trajectory was provided by studies with a double recombinase mouse developed in the Owens lab, the SMC lineage cells being initially lineage marked with Myh11Dre and then subsequently marked with the fibroblast phenotype recombinase Lgals3-Cre expression4. This study revealed that the majority of SMC-derived fibroblast-like cells go on to develop the chondrogenic phenotype. Despite the congruence of studies regarding primary transition phenotypes, the number of SMC clusters identified in various studies varied from 3 to 314,5,7,8,18,35. While clustering resolution is somewhat arbitrary, it should be based on unique pathway analyses for genes differentially regulated between clusters, unique vascular wall anatomical location, or the use of advanced algorithms such as ClusterTrees which are designed to guide clustering resolution41. The most rigid criterion is that a cluster be shown to have specific altered phenotype or relative cell number in conjunction with targeted manipulation of a gene with relevant cluster-specific expression pattern and function. For instance, this laboratory defined the fibromyocyte cluster phenotype through the genetic manipulation of Tcf216, and the chondromyocyte phenotype through knockout of Ahr18.
Many studies have shown that SMC in vitro are able to uptake lipids and upregulate a small number of macrophage markers. In addition, lineage-traced SMC in vivo have been observed to co-express the macrophage marker Lgals3, leading many to postulate that SMC acquire a ‘macrophage-like’ phenotype during atherosclerosis. However, these studies almost exclusively relied on the measurement of only one gene or phenotypic marker, significantly limiting interpretation. The recent combination of in vivo lineage tracing and single-cell RNA sequencing has allowed a far more comprehensive evaluation of SMC phenotype during atherosclerosis, but flaws in experimental design, analysis and interpretation can still lead to erroneous conclusions.
The most critical aspect of this new class of experiments is the correct assignment of SMC lineage. Correct lineage assignment by FACS analysis is dependent on reliable gating, which is in turn influenced by many factors. First, although many fluorescent lineage markers are available, it is important to choose a marker that affords a high dynamic range between negative and positive populations; otherwise, it can be difficult to correctly discriminate between lineage-positive and lineage-negative cells. Second, even when using an ideal lineage marker, there still exists a small number of cells that display fluorescence higher than the fluorescence-negative population but considerably lower than the lineage-positive population, a population we term ‘intermediate-positive’.
In the current study, by recovering the lineage marking fluorophore gene expression from the transcriptomic data in each experiment, we have rigorously determined the level of marker expression that correctly discriminates SMC from non-SMC lineage cells. For this purpose, we have defined SMC by their whole transcriptome, which clearly distinguishes them from non-SMC, and we have done so at the baseline time point for each experiment, prior to any phenotypic transformation. At this baseline time point, we show that the ‘intermediate-positive’ cells represent non-SMC. This ‘intermediate-positive’ population could be the result of multiple processes, including fragments of lysed lineage-positive cells adhering to lineage-negative cells, autofluorescence from high fat diet, or ‘leakiness’ of the reporter construct. Critically, we show that the inclusion of this ‘intermediate-positive’ population as SMC-derived leads to incorrect conclusions, including the observation by Pan et al that a significant number of SMC-derived cells transdifferentiate into macrophages. When the proper gating is applied, based upon expression of the recovered lineage marker in the Pan et al dataset, the number of SMC-derived cells in the macrophage cluster decreased dramatically to be comparable with all the other datasets. In all the studies examined, even when proper gating was performed, there were a small number of SMC lineage-positive cells in almost all non-SMC populations at a rate consistent with the known cell doublet formation in single-cell experiments, but this level is not elevated in the macrophage cluster relative to any other non-SMC population.
It is important to note that any single cell study claiming that SMC-derived cells are moving to the macrophage cluster is actually asserting that SMC transdifferentiate into cells that are transcriptomically identical to monocyte-derived macrophages, and not just ‘macrophage-like’ cells. This is an extraordinary claim, and as such would need to be supported by extraordinarily strong evidence. Instead, when properly executed, we find that all available single-cell studies, including Pan et al., show that SMC-derived cells do not transdifferentiate into bona-fide macrophages to any appreciable extent. We and others have noted that SMC-derived cells do indeed take up small amounts of lipids in the plaque, and SMC may adopt other important characteristics shared with macrophages. However, given the vast, readily observable transcriptomic difference between phenotypically modulated SMC and macrophages in vivo in the plaque, these similarities may be limited.
This study has a number of limitations. Even though ApoE knockout is the most frequent murine model used in the studies investigated here, the biology triggered by different genetic models of hyperlipidemia can be different (summarized in Getz et al 2017)42. In our integrated object, the majority of datasets are from the ApoE knockout model, but Pan et al included the Ldr knockout model as well. We did not observe any clear differences between models of hyperlipidemia in this study. Variance between biological replicates can also have significant effects in single-cell studies, and we did not explicitly compare differences among replicates in this study. The studies included in our analyses also contained genetic knockout samples, but we did not include these data in the current study; and intend to study the effects of these gene knockouts with future analyses. Finally, the studies in the integrated object described in our studies are based primarily on version 2 10x Genomics chemistry, which provided a more limited number of identified genes compared to subsequent chemistry and methods that provided greater numbers of genes.
Supplementary Material
Table S1. nCount_RNA and nFeature_RNA statistics for SMC sub-clusters.
Table S2. Pathways identified for genes expressed in smooth muscle cell sub-clusters.
Table S3. Pathways identified for genes expressed in endothelial sub-clusters.
Highlights.
Integration of single cell RNA datasets from multiple laboratories, employing different methodologies, identify common features of murine atherosclerosis.
There are a number of different endothelial cell phenotypes that occupy unique locations in different vascular beds.
One published study suggesting that smooth muscle cells can trans-differentiate to macrophages appears to be incorrect.
Acknowledgements
This study would not have been possible without the generous contributions of the individual investigators who deposited their primary data in public repositories, we extend our gratitude for their consideration.
Sources of funding
This work was supported by National Institutes of Health grants K08HL153798 (PC), F32HL143847 (PC), K08HL152308 (RW), R01HL109512 (TQ), R01HL134817 (TQ), R01HL139478 (TQ), R01HL156846 (TQ), R01HL151535 (TQ), R01HL145708 (TQ), R01HL158525 (TQ), UM1 HG011972 (TQ), as well as a Human Cell Atlas grant (ZF2019–002437) from the Chan Zuckerberg Foundation (TQ). This work was also supported by an American Heart Association grant 20CDA35310303 (PC).
Footnotes
Disclosures
The authors declare no conflict of interest.
Data Availability
All individual datasets have been previously deposited at the Gene Ontology Omnibus: Pan et al (GSE155513)7, Alencar et al (GSE150644)4, Newman et al (GSE163519)14, Cheng et al Smad3 (PRJNA794806)8, Cheng et al Zeb2 (PRJNA794806)5, Chen et al (GSE141031)28, Kim et al (GSE150768)16, and Wirka et al (PRJNA630677)6.
References
- 1.Hansson GK. Inflammation, atherosclerosis, and coronary artery disease. N Engl J Med. 2005;352:1685–1695. [DOI] [PubMed] [Google Scholar]
- 2.Shankman LS, Gomez D, Cherepanova OA, et al. KLF4-dependent phenotypic modulation of smooth muscle cells has a key role in atherosclerotic plaque pathogenesis. Nat Med. 2015;21:628–637. [DOI] [PMC free article] [PubMed] [Google Scholar]
- 3.Turner AW, Hu SS, Mosquera JV, et al. Author Correction: Single-nucleus chromatin accessibility profiling highlights regulatory mechanisms of coronary artery disease risk. Nat Genet. 2022;54:1259–1259. [DOI] [PubMed] [Google Scholar]
- 4.Alencar GF, Owsiany KM, Karnewar S, et al. Stem Cell Pluripotency Genes Klf4 and Oct4 Regulate Complex SMC Phenotypic Changes Critical in Late-Stage Atherosclerotic Lesion Pathogenesis. Circulation. 2020;142:2045–2059. [DOI] [PMC free article] [PubMed] [Google Scholar]
- 5.Cheng P, Wirka RC, Shoa CL, et al. ZEB2 Shapes the Epigenetic Landscape of Atherosclerosis. Circulation. 2022;145:469–485. [DOI] [PMC free article] [PubMed] [Google Scholar]
- 6.Wirka RC, Wagh D, Paik DT, et al. Atheroprotective roles of smooth muscle cell phenotypic modulation and the TCF21 disease gene as revealed by single-cell analysis. Nat Med. 2019;25:1280–1289. [DOI] [PMC free article] [PubMed] [Google Scholar]
- 7.Pan H, Xue C, Auerbach BJ, et al. Single-Cell Genomics Reveals a Novel Cell State During Smooth Muscle Cell Phenotypic Switching and Potential Therapeutic Targets for Atherosclerosis in Mouse and Human. Circulation. 2020;142:2060–2075. [DOI] [PMC free article] [PubMed] [Google Scholar]
- 8.Cheng P, Wirka RC, Kim JB, et al. Smad3 regulates smooth muscle cell fate and mediates adverse remodeling and calcification of the atherosclerotic plaque. Nat Cardiovasc Res. 2022;1:322–333. [DOI] [PMC free article] [PubMed] [Google Scholar]
- 9.Lecce L, Xu Y, V’Gangula B, et al. Histone deacetylase 9 promotes endothelial-mesenchymal transition and an unfavorable atherosclerotic plaque phenotype. J Clin Invest. 2021;131:e131178. [DOI] [PMC free article] [PubMed] [Google Scholar]
- 10.Slenders L, Tessels DE, van der Laan SW, Pasterkamp G, Mokry M. The Applications of Single-Cell RNA Sequencing in Atherosclerotic Disease. Front Cardiovasc Med. 2022;9:826103. [DOI] [PMC free article] [PubMed] [Google Scholar]
- 11.Butcher MJ, Filipowicz AR, Waseem TC, McGary CM, Crow KJ, Magilnick N, Boldin M, Lundberg PS, Galkina EV. Atherosclerosis-Driven Treg Plasticity Results in Formation of a Dysfunctional Subset of Plastic IFNγ+ Th1/Tregs. Circ Res. 2016;119:1190–1198. [DOI] [PMC free article] [PubMed] [Google Scholar]
- 12.Depuydt MAC, Prange KHM, Slenders L, et al. Microanatomy of the Human Atherosclerotic Plaque by Single-Cell Transcriptomics. Circ Res. 2020;127:1437–1455. [DOI] [PMC free article] [PubMed] [Google Scholar]
- 13.Winkels H, Ehinger E, Vassallo M, et al. Atlas of the immune cell repertoire in mouse atherosclerosis defined by single-cell RNA-sequencing and mass cytometry. Circ Res. 2018;122:1675–1685. [DOI] [PMC free article] [PubMed] [Google Scholar]
- 14.Newman AAC, Serbulea V, Baylis RA, et al. Multiple cell types contribute to the atherosclerotic lesion fibrous cap by PDGFRβ and bioenergetic mechanisms. Nature metabolism. 2021;3:166–181. [DOI] [PMC free article] [PubMed] [Google Scholar]
- 15.Wirth A, Benyó Z, Lukasova M, et al. G12-G13-LARG-mediated signaling in vascular smooth muscle is required for salt-induced hypertension. Nat Med. 2008;14:64–68. [DOI] [PubMed] [Google Scholar]
- 16.McGinnis CS, Murrow LM, Gartner ZJ. DoubletFinder: Doublet Detection in Single-Cell RNA Sequencing Data Using Artificial Nearest Neighbors. Cell Syst. 2019;8:329–337. [DOI] [PMC free article] [PubMed] [Google Scholar]
- 17.Korsunsky I, Millard N, Fan J, et al. Fast, sensitive and accurate integration of single-cell data with Harmony. Nat Methods. 2019;16:1289–1296. [DOI] [PMC free article] [PubMed] [Google Scholar]
- 18.Kim JB, Zhao Q, Nguyen T, et al. Environment-Sensing Aryl Hydrocarbon Receptor Inhibits the Chondrogenic Fate of Modulated Smooth Muscle Cells in Atherosclerotic Lesions. Circulation. 2020;142:575–590. [DOI] [PMC free article] [PubMed] [Google Scholar]
- 19.Kalluri AS, Vellarikkal SK, Edelman ER, Nguyen L, Subramanian A, Ellinor PT, Regev A, Kathiresan S, Gupta RM. Single-Cell Analysis of the Normal Mouse Aorta Reveals Functionally Distinct Endothelial Cell Populations. Circulation. 2019;140:147–163. [DOI] [PMC free article] [PubMed] [Google Scholar]
- 20.Gu W, Ni Z, Tan Y-Q, et al. Adventitial Cell Atlas of wt (Wild Type) and ApoE (Apolipoprotein E)-Deficient Mice Defined by Single-Cell RNA Sequencing. Arteriosclerosis, Thrombosis, and Vascular Biology. 2019;39:1055–1071. [DOI] [PMC free article] [PubMed] [Google Scholar]
- 21.Patapoutian A, Wold BJ, Wagner RA. Evidence for developmentally programmed transdifferentiation in mouse esophageal muscle. Science. 1995;270:1818–1821. [DOI] [PubMed] [Google Scholar]
- 22.Bulut GB, Alencar GF, Owsiany KM, et al. KLF4 (Kruppel-Like Factor 4)-Dependent Perivascular Plasticity Contributes to Adipose Tissue inflammation. Arterioscler Thromb Vasc Biol. 2021;41:284–301. [DOI] [PMC free article] [PubMed] [Google Scholar]
- 23.Xiang P, Blanchard V, Francis GA. Smooth Muscle Cell-Macrophage Interactions Leading to Foam Cell Formation in Atherosclerosis: Location, Location, Location. Front Physiol. 2022;13:921597. [DOI] [PMC free article] [PubMed] [Google Scholar]
- 24.Butler A, Hoffman P, Smibert P, Papalexi E, Satija R. Integrating single-cell transcriptomic data across different conditions, technologies, and species. Nat Biotechnol. 2018;36:411–420. [DOI] [PMC free article] [PubMed] [Google Scholar]
- 25.Pedroza AJ, Tashima Y, Shad R, et al. Single Cell Transcriptomic Profiling of Vascular Smooth Muscle Cell Phenotype Modulation in Marfan Syndrome Aortic Aneurysm. Arterioscler Thromb Vasc Biol. 2020;40:2195–2211. [DOI] [PMC free article] [PubMed] [Google Scholar]
- 26.Cai D, Sun C, Zhang G, Que X, Fujise K, Weintraub NL, Chen S-Y. A Novel Mechanism Underlying Inflammatory Smooth Muscle Phenotype in Abdominal Aortic Aneurysm. Circ Res. 2021;129:e202–e214. [DOI] [PMC free article] [PubMed] [Google Scholar]
- 27.Pedroza AJ, Dalal AR, Shad R, et al. Embryologic Origin Influences Smooth Muscle Cell Phenotypic Modulation Signatures in Murine Marfan Syndrome Aortic Aneurysm. Arterioscler Thromb Vasc Biol. 2022;42:1154–1168. [DOI] [PMC free article] [PubMed] [Google Scholar]
- 28.Ren J, Xiao X, Li R, Lv C, Zhang Y, Wang L, Hong T, Zhang H, Wang Y. Single-cell sequencing reveals that endothelial cells, EndMT cells and mural cells contribute to the pathogenesis of cavernous malformations. Exp Mol Med. 2023;55:628–642. [DOI] [PMC free article] [PubMed] [Google Scholar]
- 29.Bondareva O, Rodríguez-Aguilera JR, Oliveira F, et al. Single-cell profiling of vascular endothelial cells reveals progressive organ-specific vulnerabilities during obesity. Nature Metabolism. 2022;4:1591–1610. [DOI] [PMC free article] [PubMed] [Google Scholar]
- 30.Jeong H-W, Diéguez-Hurtado R, Arf H, Song J, Park H, Kruse K, Sorokin L, Adams RH. Single-cell transcriptomics reveals functionally specialized vascular endothelium in brain. 2022;11:e57520. [DOI] [PMC free article] [PubMed] [Google Scholar]
- 31.Schupp JC, Adams TS, Cosme C Jr., et al. Integrated Single-Cell Atlas of Endothelial Cells of the Human Lung. Circulation. 2021;144:286–302. [DOI] [PMC free article] [PubMed] [Google Scholar]
- 32.Zhang L, Gao S, White Z, Dai Y, Malik AB, Rehman J. Single-cell transcriptomic profiling of lung endothelial cells identifies dynamic inflammatory and regenerative subpopulations. JCI Insight. 2022;7:e158079. [DOI] [PMC free article] [PubMed] [Google Scholar]
- 33.Feng W, Chen L, Nguyen PK, Wu SM, Li G. Single Cell Analysis of Endothelial Cells Identified Organ-Specific Molecular Signatures and Heart-Specific Cell Populations and Molecular Features. Front Cardiovasc Med. 2019;6:165–180. [DOI] [PMC free article] [PubMed] [Google Scholar]
- 34.Rodor J, Chen SH, Scanlon JP, et al. Single-cell RNA sequencing profiling of mouse endothelial cells in response to pulmonary arterial hypertension. Cardiovasc Res. 2021;118:2519–2534. [DOI] [PMC free article] [PubMed] [Google Scholar]
- 35.Chen PY, Qin L, Li G, et al. Smooth Muscle Cell Reprogramming in Aortic Aneurysms. Cell Stem Cell. 2020;26:542–557. [DOI] [PMC free article] [PubMed] [Google Scholar]
- 36.Richardson R, Eley L, Donald-Wilson C, et al. Development and maturation of the fibrous components of the arterial roots in the mouse heart. J Anat. 2018;232:554–567. [DOI] [PMC free article] [PubMed] [Google Scholar]
- 37.Zernecke A, Winkels H, Cochain C, et al. Meta-Analysis of Leukocyte Diversity in Atherosclerotic Mouse Aortas. Circ Res. 2020;127:402–426. [DOI] [PMC free article] [PubMed] [Google Scholar]
- 38.Zernecke A, Erhard F, Weinberger T, Schulz C, Ley K, Saliba AE, Cochain C. Integrated single-cell analysis-based classification of vascular mononuclear phagocytes in mouse and human atherosclerosis. Cardiovasc Res. 2023;119:1676–1689. [DOI] [PMC free article] [PubMed] [Google Scholar]
- 39.Tran HTN, Ang KS, Chevrier M, Zhang X, Lee NYS, Goh M, Chen J. A benchmark of batch-effect correction methods for single-cell RNA sequencing data. Genome Biol. 2020;21:12. [DOI] [PMC free article] [PubMed] [Google Scholar]
- 40.Luecken MD, Buttner M, Chaichoompu K, et al. Benchmarking atlas-level data integration in single-cell genomics. Nat Methods. 2022;19:41–50. [DOI] [PMC free article] [PubMed] [Google Scholar]
- 41.Zappia L, Oshlack A. Clustering trees: a visualization for evaluating clusterings at multiple resolutions. Gigascience. 2018;7:giy083. [DOI] [PMC free article] [PubMed] [Google Scholar]
- 42.Getz GS, Reardon CA. Genetic control of apoprotein A-I and atheroprotection: some insights from inbred strains of mice. Curr Opin Lipidol. 2017;28:403–407. [DOI] [PMC free article] [PubMed] [Google Scholar]
Associated Data
This section collects any data citations, data availability statements, or supplementary materials included in this article.
Supplementary Materials
Table S1. nCount_RNA and nFeature_RNA statistics for SMC sub-clusters.
Table S2. Pathways identified for genes expressed in smooth muscle cell sub-clusters.
Table S3. Pathways identified for genes expressed in endothelial sub-clusters.
Data Availability Statement
All individual datasets have been previously deposited at the Gene Ontology Omnibus: Pan et al (GSE155513)7, Alencar et al (GSE150644)4, Newman et al (GSE163519)14, Cheng et al Smad3 (PRJNA794806)8, Cheng et al Zeb2 (PRJNA794806)5, Chen et al (GSE141031)28, Kim et al (GSE150768)16, and Wirka et al (PRJNA630677)6.