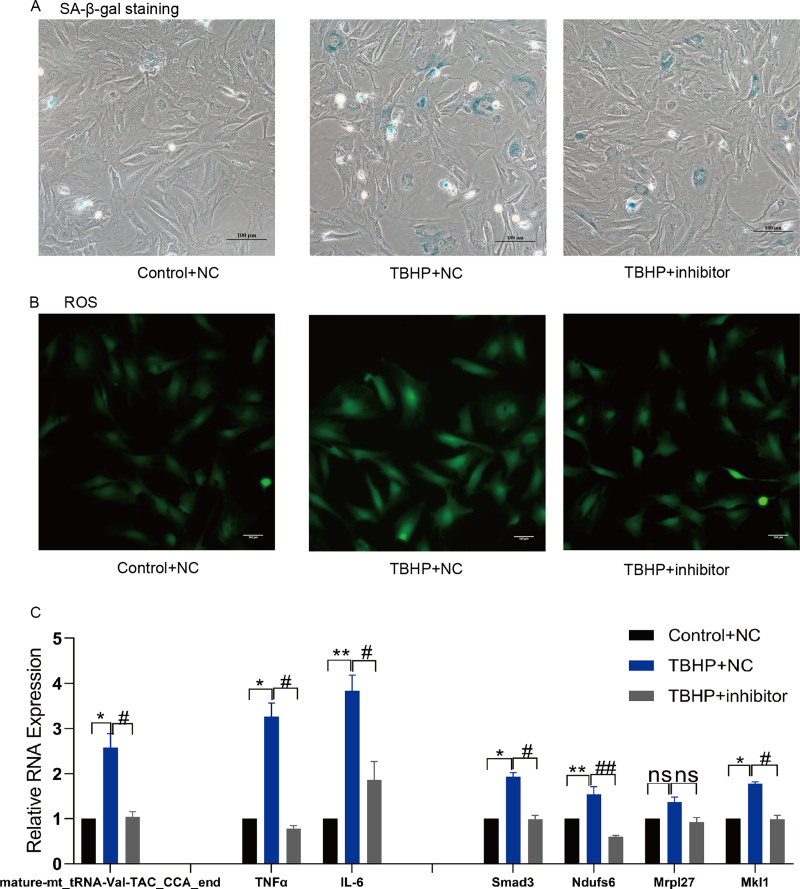
Figure 7. Inhibition of mature-mt_tRNA-Val-TAC_CCA_end improved oxidation-inflammation-aging.
(A) The ratio of senescent cells after treated with mature-mt_tRNA-Val-TAC_CCA_end inhibitor. Scale bar, 100 μm. (B) ROS detection. Scale bar, 100 μm. (C) The expression of inflammation indicators and target genes. n = 3–4, *P < 0.05, **P < 0.01 vs. Control + NC; #P < 0.05, ##P < 0.01 vs. TBHP+NC.

