Abstract
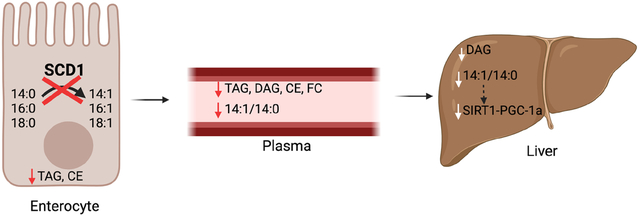
Stearoyl-CoA desaturase-1 is an endoplasmic reticulum (ER)-membrane resident protein that inserts a double bond into saturated fatty acids, converting them into their monounsaturated counterparts. Previous studies have demonstrated an important role for SCD1 in modulating tissue and systemic health. Specifically, lack of hepatic or cutaneous SCD1 results in significant reductions in tissue esterified lipids. While the intestine is an important site of lipid esterification and assimilation into the body, the regulation of intestinal SCD1 or its impact on lipid composition in the intestine and other tissues has not been investigated. Here we report that unlike other lipogenic enzymes, SCD1 is enriched in the distal small intestine and in the colon of chow-fed mice and is robustly upregulated by acute feeding of a high-sucrose diet. We generated a mouse model lacking SCD1 specifically in the intestine (iKO mice). These mice have significant reductions not only in intestinal lipids, but also in plasma triacylglycerols, diacylglycerols, cholesterol esters, and free cholesterol. Additionally, hepatic accumulation of diacylglycerols is significantly reduced in iKO mice. Comprehensive targeted lipidomic profiling revealed a consistent reduction in the myristoleic (14:1) to myristic (14:0) acid ratios in intestine, liver, and plasma of iKO mice. Consistent with the reduction of the monounsaturated fatty acid myristoleic acid in hepatic lipids of chow fed iKO mice, hepatic expression of Pgc-1α, Sirt1, and related fatty acid oxidation genes were reduced in chow-fed iKO mice. Further, lack of intestinal SCD1 reduced expression of de novo lipogenic genes in distal intestine of chow-fed mice and in the livers of mice fed a lipogenic high-sucrose diet. Taken together, these studies reveal a novel pattern of expression of SCD1 in the intestine. They also demonstrate that intestinal SCD1 modulates lipid content and composition of not only intestinal tissues, but also that of plasma and liver. Further, these data point to intestinal SCD1 as a modulator of gut-liver crosstalk, potentially through the production of novel signaling lipids such as myristoleic acid. These data have important implications to understanding how intestinal SCD1 may modulate risk for post-prandial lipemia, hepatic steatosis, and related pathologies.
Keywords: myristoleate, postprandial lipemia, gut-liver crosstalk, delta-9 desaturase, MUFAs
Graphical Abstract
1. Introduction
Stearoyl-CoA desaturase 1 (SCD1) is an endoplasmic reticulum (ER)-membrane bound protein that plays a key regulatory role in lipid metabolism (1–3). SCD1 catalyzes the desaturation of dietary and de novo synthesized saturated fatty acids (SFAs), ranging from 12–18 carbons long, resulting in the formation of the respective Δ9 unsaturated monounsaturated fatty acid (MUFA) counterparts. Specific cellular SFAs and MUFAs can also be elongated to give rise to fatty acids that are reflective of cellular SCD1 activity, as in the case of cis-vaccenic acid (18:1n7), which is generated by elongation of 16:1n7, which is solely a product of SCD activity (4–8) (Figure 1A). The MUFA products of SCD1 are key substrates for the synthesis of lipid species such as triacylglycerols (TAG), cholesterol esters (CE), phospholipids (PL), wax esters, and diacylglycerols (DAG). Due to this critical role in lipid metabolism, SCD1 has been implicated in the development of metabolic diseases such as diabetes, fatty liver disease, and obesity (9–13).
Figure 1. Intestinal SCD1 is induced by feeding a high-sucrose diet and is enriched in distal small intestine.
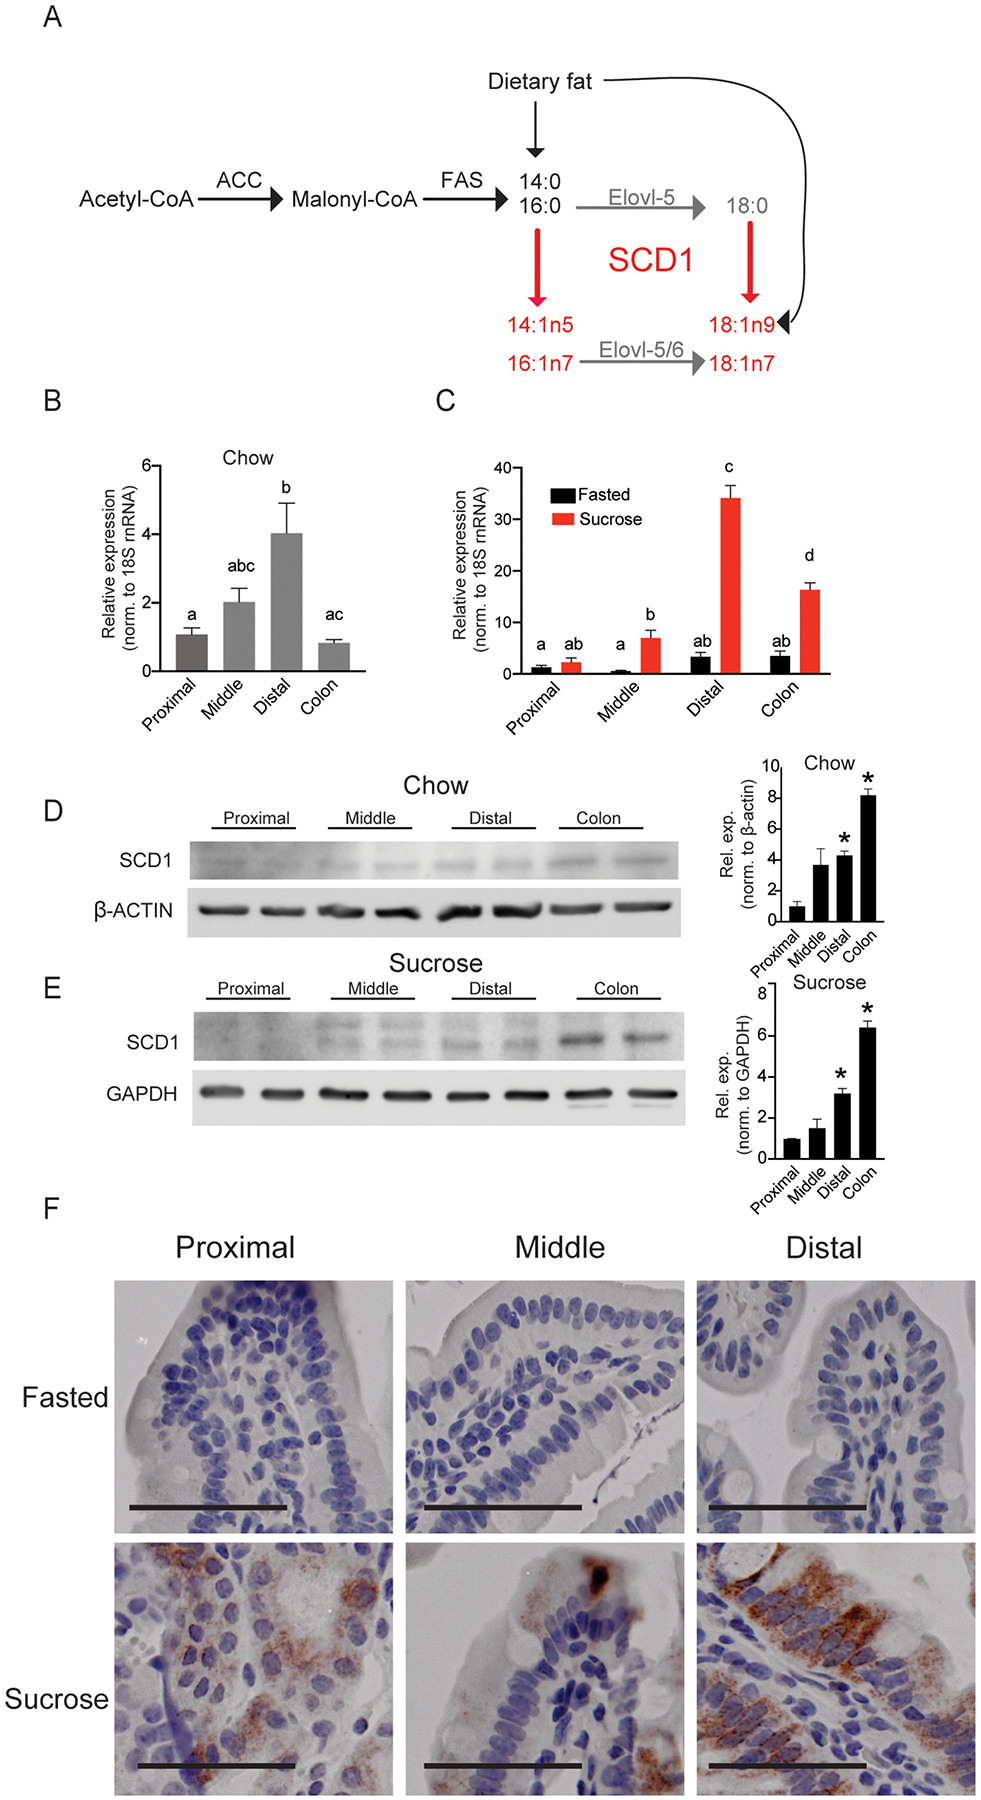
(A) Generation of MUFA products by cellular SCD1 activity; SCD1 products are in red, and elongation products are in gray. (B-C) Scd1 expression in chow-fed or fasted and sucrose-refed animals in proximal, middle, and distal small intestine and colon; n=5–8. Averages ± SEM, bars with different letters are significantly different from each other. (D,E) SCD1 protein expression in the proximal, middle, and distal intestine and colon of chow-fed and sucrose-fed mice. Each lane contains protein pooled from 3 animals; *, p<0.05 vs. proximal (F) Immunohistochemical staining for SCD1 in intestines; images representative of three animals each; scale bar represents 25 μM. SCD1, Stearoyl-CoA Desaturase 1, β-Actin, Beta-Actin, GAPDH, glyceraldehyde 3-phosphate dehydrogenase.
SCD1 is ubiquitously expressed, and both whole-body knockouts and several tissue specific knockout models have been studied to determine the tissue specific contributions of SCD1 to whole body lipid metabolism. Previous studies using animals globally deficient in SCD1 (Scd1−/−) established that whole body SCD1 deficiency protects mice against diet-induced adiposity and insulin resistance (10,14–18). Liver-specific SCD1 deletion protected mice from carbohydrate-induced obesity and hepatic steatosis (15); these mice also had reduced liver and plasma triacylglycerols when fed a lipogenic high-sucrose diet, which robustly induces hepatic SCD1 in wildtype mice (15). These data suggested that hepatic SCD1 expression may play a key role in modulating liver responses to high-glycemic index diets (15). Since whole body deletion of SCD1 causes distinct cutaneous changes, including alopecia and dermatitis (17,19), mice lacking SCD1 only in the skin were generated (18). Interestingly, skin-specific deletion of SCD1 recapitulated the whole-body phenotype of resistance to high-fat diet-induced obesity and insulin resistance. Concomitantly, lack of skin SCD1 also resulted in a large build-up of unesterified lipids, including free cholesterol and free fatty acids. Conversely, esterified lipids including cholesterol esters, triacylglycerols, and wax diesters were markedly reduced in skin of these mice (18). These marked changes occurred despite an abundance of oleic acid in the diet and systemically through synthesis in the liver and adipose (18,20,21), suggesting that local desaturation of SFAs in the skin plays an important role in maintaining the cutaneous lipid barrier. Collectively, these prior studies have indicated that tissue SCD1 function plays crucial and divergent roles in lipid esterification and lipid homeostasis and that endogenously synthesized MUFAs play essential and distinct roles in regulating tissue lipid balance.
The intestine is an important regulatory and signaling organ that plays a key role in the digestion, absorption, and secretion of lipids (22–24). Importantly, esterification of free cholesterol and free fatty acids absorbed from the intestinal lumen by ER-membrane resident proteins, including MGAT (monoacyglycerol:acyltransferase), ACAT (acyl:CoA:cholesterol acyltransferase) and DGAT (diacylglycerol:acyltransferase) is essential for efficient lipid assimilation into chylomicrons (25–32). Indeed, genetic and pharmacological inhibition of these enzymes is associated with reduced plasma lipid levels, which may directly lower risk for atherosclerosis, stroke, and type II diabetes (33–35). While SCD1 deficiency has been shown to reduce lipid esterification in the skin epithelium and in the liver, a role for intestinal SCD1 in modulating systemic lipid levels has not been investigated. Here, we report our novel findings regarding the distribution and regulation of intestinal SCD1 in the mouse and its role in regulating intestinal and systemic lipid balance in response to varying nutritional inputs.
2. Methods
2.1. Animal diet studies
Wild-type C57BL/6J mice (Jackson Laboratories) were individually housed and maintained on a chow diet prior to the start of the study. Both males and females were studied, and data were segregated by sex. For chow diet studies, males were used except in Figure 2, where both male and female data are reported. For sucrose studies, males were used in Figure 1 and females were used in all other figures; Supplementary Figure 2 shows both male and female data. For sucrose-refeeding studies, mice were fasted for 24 hours with ad libitum access to water and refed a lipogenic high-sucrose, very low fat, high-glycemic index diet containing 49% sucrose and 1% corn oil by weight (TD.03045, Envigo, Indianapolis, IN) for 18 hours prior to euthanasia. All mice were euthanized in the post-prandial state by isoflurane anaesthesia followed by cardiac exsanguination between 9 and 11 a.m. Liver, epididymal adipose tissue (eWAT), intestinal mucosal scrapings, and plasma were collected. Prior to collection, intestines were washed with ice-cold PBS, and the small intestine (stomach to the cecum) and colon were collected, after carefully dissecting away any connective tissue and fat surrounding the intestines. The small intestine was divided into three equal parts, denoted as proximal, middle, and distal intestine. Mucosal scrapings were collected from all intestine segments. All tissues and plasma were snap-frozen in liquid nitrogen and stored at −80° C or fixed in formalin for immunohistochemistry (IHC) measurements. For all in vivo procedures, every effort was made to minimize discomfort and suffering, in accordance with the protocols approved by the Animal Care and Use Committee of Rutgers University, New Brunswick, New Jersey under protocol No. 201900077.
Figure 2. SCD1 is specifically depleted in intestines of iKO mice.
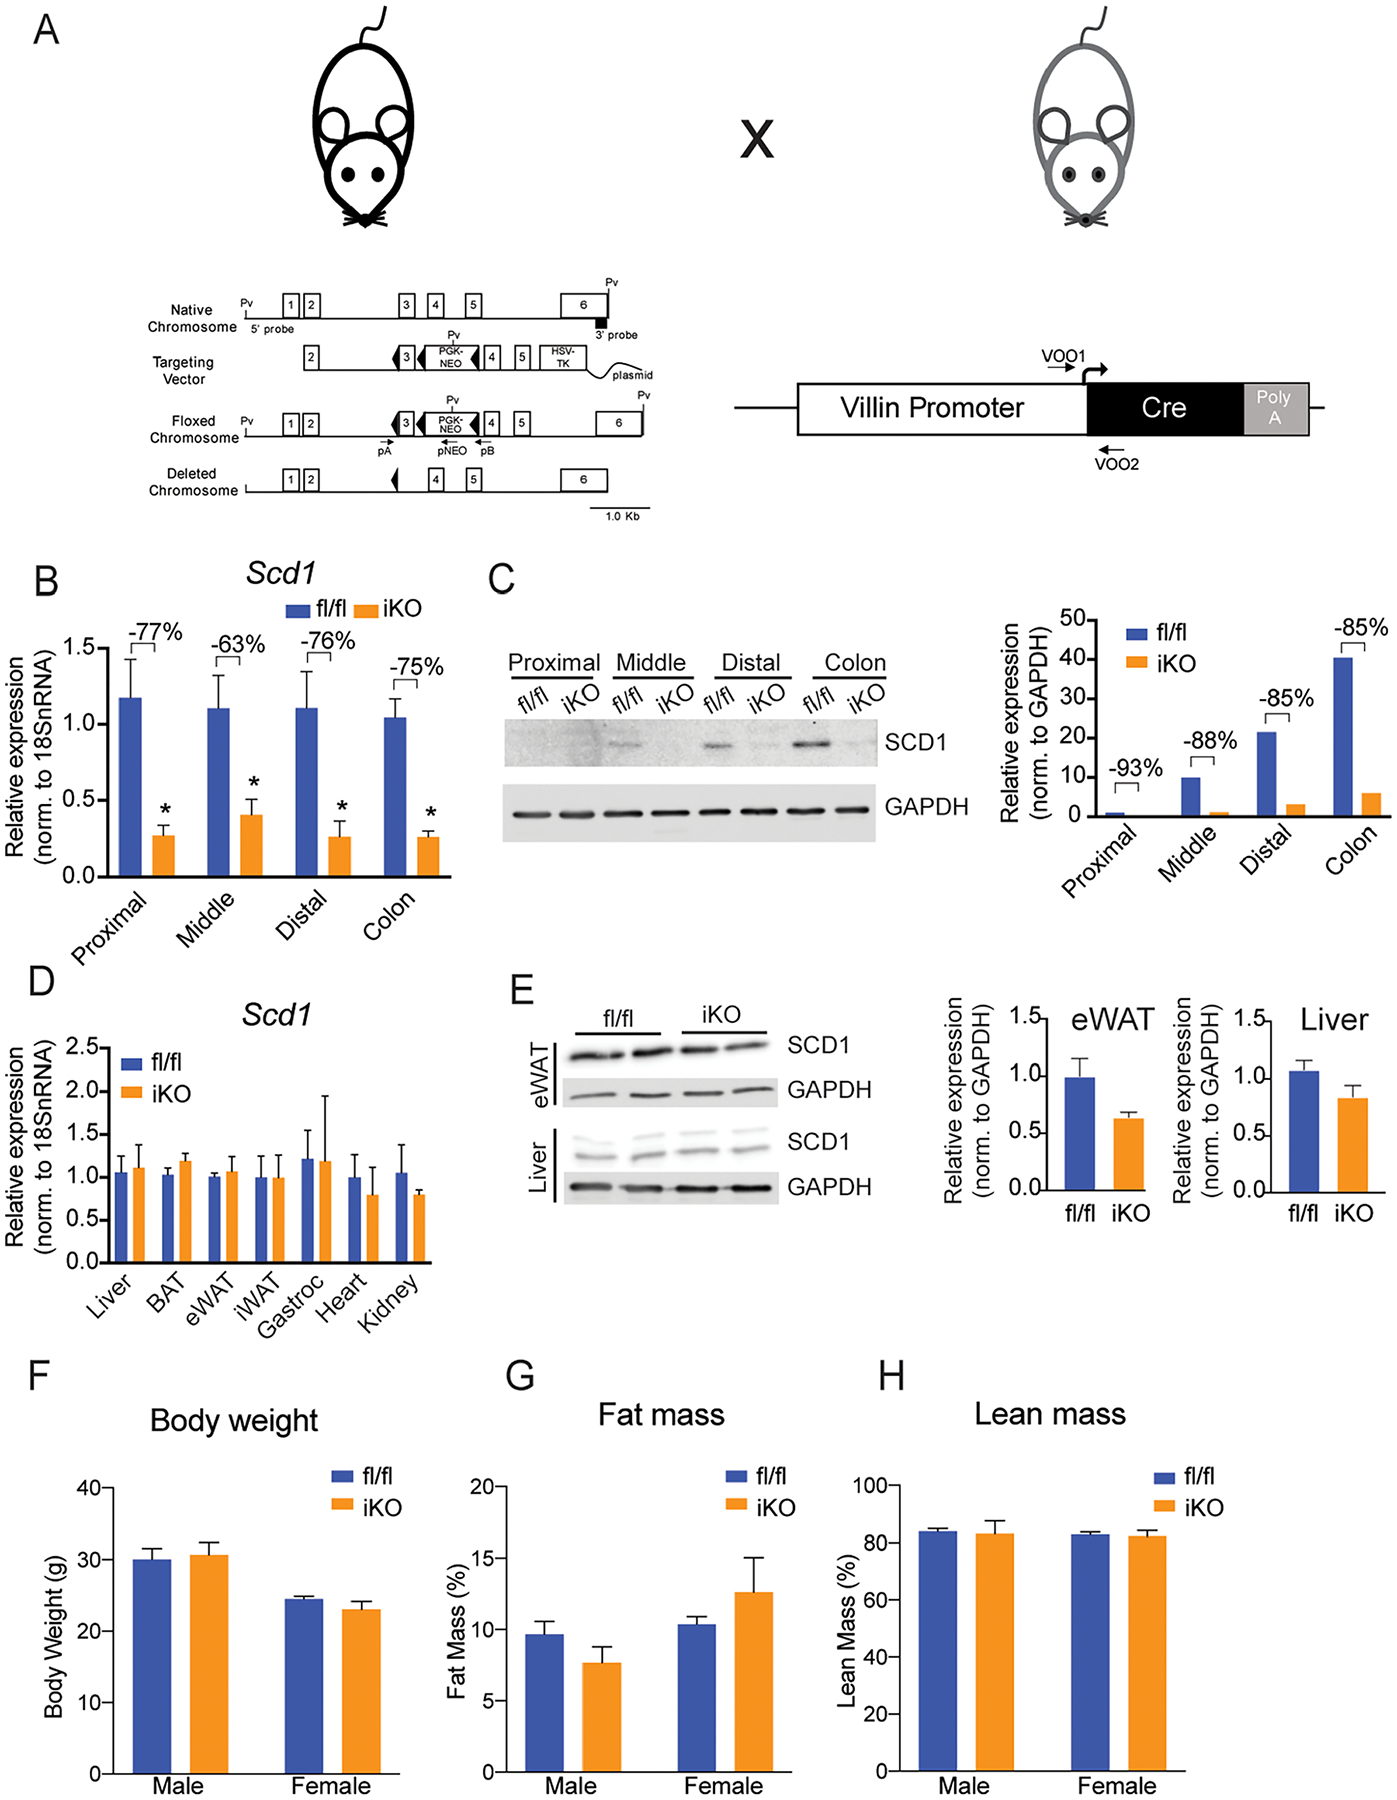
(A) Model for the generation of an intestinal SCD1 knockout model. (B, C) Intestinal SCD1 gene and protein expression is significantly reduced in small intestine and colon of chow fed mice. (D,E) SCD1 gene and protein expression is not changed in non-intestinal tissues. (F-H) Body weights and body composition are not genotypically different in chow-fed mice. Averages ± SEM. *p<0.05 vs fl/fl. n= 6–8 for gene expression and body composition, and protein pooled from 3 animals per lane for protein blots. SCD1, Stearoyl-CoA Desaturase 1, GAPDH, glyceraldehyde 3-phosphate dehydrogenase.
2.2. Intestinal deletion of SCD1
Mice carrying flanking LoxP sequences surrounding exon 3 of the Scd1 gene (Scd1fl/fl; fl/fl) were provided by Dr. James Ntambi at the University of Wisconsin-Madison. The generation of these mice has been previously described (15). To generate intestine-specific Scd1 knockout mice, Scd1fl/fl mice were crossed with mice expressing Cre recombinase under the Villin 1 promoter (Vil-Cre 1000; #021504; The Jackson Laboratory, Bar Harbor, ME). Mice were maintained on a 12-hour light/dark cycle with ad libitum access to water and standard chow diet.
2.3. Immunohistochemistry
The small intestine was flushed with ice-cold PBS, cut longitudinally to expose the lumen, and rolled in a ‘Swiss-roll’ prior to fixation in 10% formalin for 24 hours followed by paraffin embedding. Tissues were blocked in 10% normal goat serum for 1 hour at room temperature and incubated in SCD1 primary antibody (C12H5, Cell Signaling Technology, Danvers, MA, United States) at a concentration of 1:100. Tissues were then incubated in anti-rabbit biotinylated secondary antibody followed by ABC reagent for 30 minutes each using VECTASTAIN Rabbit Elite kit (PK-6101). Negative controls were incubated in 10% normal goat serum during the blocking and primary antibody incubation step, and then with anti-rabbit biotinylated secondary antibody and ABC reagent. Tissues were then incubated in 3,3′-diaminobenzidine (DAB) for visualization. Tissues were dehydrated by immersion in a graded ethanol series and stained with hematoxylin before mounting with non-aqueous mounting media. Images of sections were analyzed using OlyVIA imaging software.
2.4. Carmine Red Gut Transit Time Assay
Individually housed mice were fasted overnight and then placed in cages with water and chow diet. Mice were orally gavaged with 300 μL of Carmine red solution (6% w/v in 0.5% hemicellulose). Feces were collected every 30 minutes and streaked across a white paper towel to monitor for the appearance of red dye.
2.5. Gene expression analyses
RNA was isolated using QIAzol Lysis Reagent and the Qiagen RNeasy kit (Qiagen, Hilden, Germany). Superscript III first-strand synthesis system (Invitrogen, Carlsbad, CA, United States) was used to synthesize cDNA from 1 μg of RNA. Quantitative real-time PCR (qRT-PCR) was performed on a QuantStudio 3 Real-Time PCR System (Applied Biosystems, Foster City, CA, United States) with gene-specific primers (Table 1). Data were normalized to the expression of RNA18SN5, and quantification was carried out using the 2−ΔΔCt method (36).
Table 1.
Sequences for gene-specific primers.
| Gene Name | Forward Primer (5’ → 3’) | Reverse Primer (3’ → 5’) |
|---|---|---|
| 18s rRNA | TCACCATCATGCAGAACCCA | CCTGGCTGTACTTCCCATCCT |
| Scd1 | CCTCTGGAGCCACAGAACTT | GCCATGGTGTTGGCAATGAT |
| Srebp1c | GCTCCTGTGCTACTTTGCCT | CAGCTGAAGACACAAAACCCA |
| Fas | TTCCGAGATTCCATCCTACGC | AAAGGTGCTCTCGTCTGTGC |
| Acc | AGGAGCTGTCTATTCGGGGT | CTGTCCAGCCAGCCAGTATC |
| Mgat1 | AATCATTGTCCTCGGAGGTG | TGGGTCAAGGCCATCTTAAC |
| Mgat2 | AAGTTCAACGTCCCTGAGGA | AAGTCCCCCTAATCCCACAC |
| Dgat1 | CTGGATTGTGGGCCGATTCT | ATACATGAGCACAGCCACCG |
| Dgat2 | GCCTGCAGTGTCATCCTCAT | TGGGCGTGTTCCAGTCAAAT |
2.6. Protein Analyses
Whole cell lysates were prepared and lysate protein concentrations were determined by Bradford assay, as previously described (18). Equal amounts of protein were separated by SDS-PAGE and transferred to PVDF membranes. Total protein staining was performed using Ponceau stain to confirm uniform protein loading and transfer. Membranes were blocked in 5% BSA in Tris-buffered saline (TBS, 150 mM NaCl, 50 mM Tris-HCl, pH 7.4) with 0.1% Tween 20 overnight at 4°C with rocking. The membranes were incubated overnight at 4°C with primary antibody. Primary antibodies were as follows: SCD1 (Cell Signaling Technology, Danvers, MA, United States), GAPDH (Cell Signaling Technology) and β-actin (Millipore Sigma, Burlington, MA, United States). Membranes were incubated with HRP- or Alexa-fluor conjugated secondary antibodies, and signal was detected using enhanced chemiluminescence or fluorescence imaging, respectively, on an Azure c600 imaging system (Azure Biosystems, Dublin, CA, United States).
2.7. Lipid Analyses
Hepatic, plasma, and intestinal lipids were extracted by a modified Folch method and separated by thin-layer chromatography, as previously described (37,38). Briefly, lipids were extracted by homogenization in chloroform:methanol (2:1), and phase separated by addition of acidified saline followed by centrifugation. The lower organic phase was dried and reconstituted in chloroform:methanol (2:1), spotted onto Silica Gel 60 chromatography plates (Sigma-Aldrich, St.Louis, MO), and developed in heptane:isopropyl ether:acetic acid (60:40:3) until the solvent front reached 1 cm from the top of the plate. TLC plates were sprayed with 0.2% (w/v) 2’,7’-dichorofluorescein (Sigma-Aldrich) in ethanol, and bands were visualized under UV light (321 nm). Bands corresponding to phospholipid (PL), monoacylglycerol, diacylglycerol (DAG), free fatty acid (FFA), triacylglycerol (TAG), and cholesterol ester (CE) were identified using known standards, scraped, and collected for further analysis. Lipids were methylated in 14% BF3 in MeOH (Sigma-Aldrich), heated to 100° C and extracted in hexane. The lipid fraction was dried, reconstituted in hexane, and loaded onto the Gas Chromatography and Mass Spectrometry system (Agilent Technologies, Santa Clara, CA, United States) using an autosampler. MassHunter Data Acquisition software and MassHunter Quantitative Analysis software was utilized for peak analyses. Peak identity was confirmed by National Institute of Standards and Technology (NIST) library search. Area under the curve values were generated by MassHunter and converted to concentration using standard curves generated for each acyl chain. Plasma free cholesterol was measured using the Wako Free Cholesterol E Microtiter kit, as per manufacturer’s instructions (FUJIFILM Healthcare, Lexington, MA).
2.8. Fecal Fat Measurement
Fecal fat was measured as previously described (39). Briefly, feces were collected for 24 hours from individually housed mice. Feces were dried overnight at 60°C and weighed. 0.5 g (dry weight) was dissolved in water overnight and lipid-extracted as described above. The extracted lipids were placed in pre-weighed glass tubes and dried completely under a nitrogen stream. Tubes were weighed again to determine mass of recovered lipid.
2.9. Statistical Analyses
Data are expressed as mean ± SEM for biological replicates with comparisons carried out using student’s t-test for two-group comparisons or one-way ANOVA followed by post-hoc analysis using a multiple comparison procedure with Bonferroni/Dunn post-hoc comparison in Graph Pad Prism (version 8.2.0 for Windows, GraphPad Software, La Jolla, CA). p values less than 0.05 were considered statistically significant.
3. Results
3.1. Intestinal SCD1 is enriched in the distal small intestine and upregulated by sucrose feeding
To understand the potential role and regulation of SCD1 in the intestine, we first determined its pattern of expression along the length of the intestine. Under chow-fed conditions, Scd1 gene expression was highest in the distal small intestine, corresponding to the ileum, with lower levels of expression in the proximal and mid-small intestine, corresponding to duodenum and jejunum, respectively (Figure 1A). Mice were then refed a high-sucrose, very-low fat, high-glycemic index diet which has been previously shown to induce hepatic SCD1 expression (15). Following sucrose feeding, Scd1 expression was greatly increased in all intestinal segments (Figure 1B). The greatest relative expression was observed in the ileum (Figure 1B). In addition to the small intestine, robust Scd1 gene expression was also observed in the colon in chow-fed mice (Figure 1A). Additionally, colonic expression was significantly increased upon sucrose refeeding (Figure 1B). Relative expression of SCD1 protein was confirmed to be highest in the ileum and colon in chow-fed mice (Figure 1C) and in sucrose refed mice (Figs. 1D–E). Protein levels of SCD1 in fasted mice were undetectable by Western blot (not shown) or IHC (Figure 1E; Supplementary Figure 1). However, intestinal and colonic SCD1 protein was robustly upregulated by sucrose feeding (Figure 1E). Colon sections were not fixed for IHC analyses. These results demonstrate that intestinal SCD1 is regulated in both a spatial and nutritional manner, suggesting a potential regulatory role for this protein in intestinal and potentially in systemic lipid metabolism.
3.2. Deletion of intestinal SCD1 does not alter intestinal fat absorption, motility, or body composition
Given these observations of intestinal SCD1 expression and regulation, we sought to determine a potential role for intestinal SCD1 in regulating intestinal and systemic lipid homeostasis. We therefore generated an intestine-specific SCD1 knockout mouse (iKO) by introducing Cre recombinase under the control of the intestine-specific Villin promoter into Scd1fl/fl mice that carry two LoxP sites flanking exon 3 of the Scd1 gene (Figure 2A). To verify knockdown of intestinal Scd1, we measured gene expression along the length of the intestine in chow-fed mice (Figure 2B). Scd1 gene expression was significantly reduced in all intestine segments; residual Scd1 expression is likely due to presence of non-epithelial cells that express Scd1. We also confirmed deficiency of intestinal SCD1 protein by Western blot and found that iKO mice had an 85–90% reduction in proximal, middle, and distal intestine and colon (Figure 2C). Additionally, to confirm that the knockdown of SCD1 was specific to the intestine, we measured Scd1 gene expression in liver, brown adipose tissue (BAT), epididymal white adipose tissue (eWAT), inguinal white adipose tissue (iWAT), gastrocnemius muscle, heart and kidney (Figure 2D) and protein expression in liver and eWAT (Figure 2E). SCD1 expression was unchanged in any of these tissues of iKO mice. At 16–20 weeks of age, male and female fl/fl and iKO mice were weighed, and body composition was measured by MRI. No significant differences were observed in any measurements between genotypes (Figure 2F–H).
To determine if deletion of SCD1 altered intestinal development and morphology, we measured small intestine and colon lengths (Figure 3A and B). The small intestine was measured from the pyloric sphincter to the cecum, and the colon was measured from the cecum to the rectum. A small but significant increase in small intestine and colon lengths was observed in iKO mice (Figures 3 A,B). Histological examination by H&E staining revealed intact villi and crypts in iKO mice without obvious pathological alterations (Figure 3C). Systematic measurement of villus and crypt characteristics revealed a slight but significant decrease in villus widths and crypt depths in iKO mice, without any changes in villus lengths (Figures 3D–F). To determine if the deficiency of intestinal SCD1 impacts fat absorption, fecal fat content was measured (Figure 3G). There were no significant differences in fecal fat content between the fl/fl and iKO mice. Further, gut motility was measured using a Carmine Red dye that is impermeable to the intestinal membrane. No significant differences in gut transit time were observed between the two genotypes (Fig 3H). Thus, the slight 10% increase in intestine lengths and similar reductions in villus widths and crypt depths did not impact measures of lipid absorption or gut transit time in iKO animals.
Figure 3. Intestinal structure is slightly altered, but gut motility and fat absorption are intact in iKO mice.
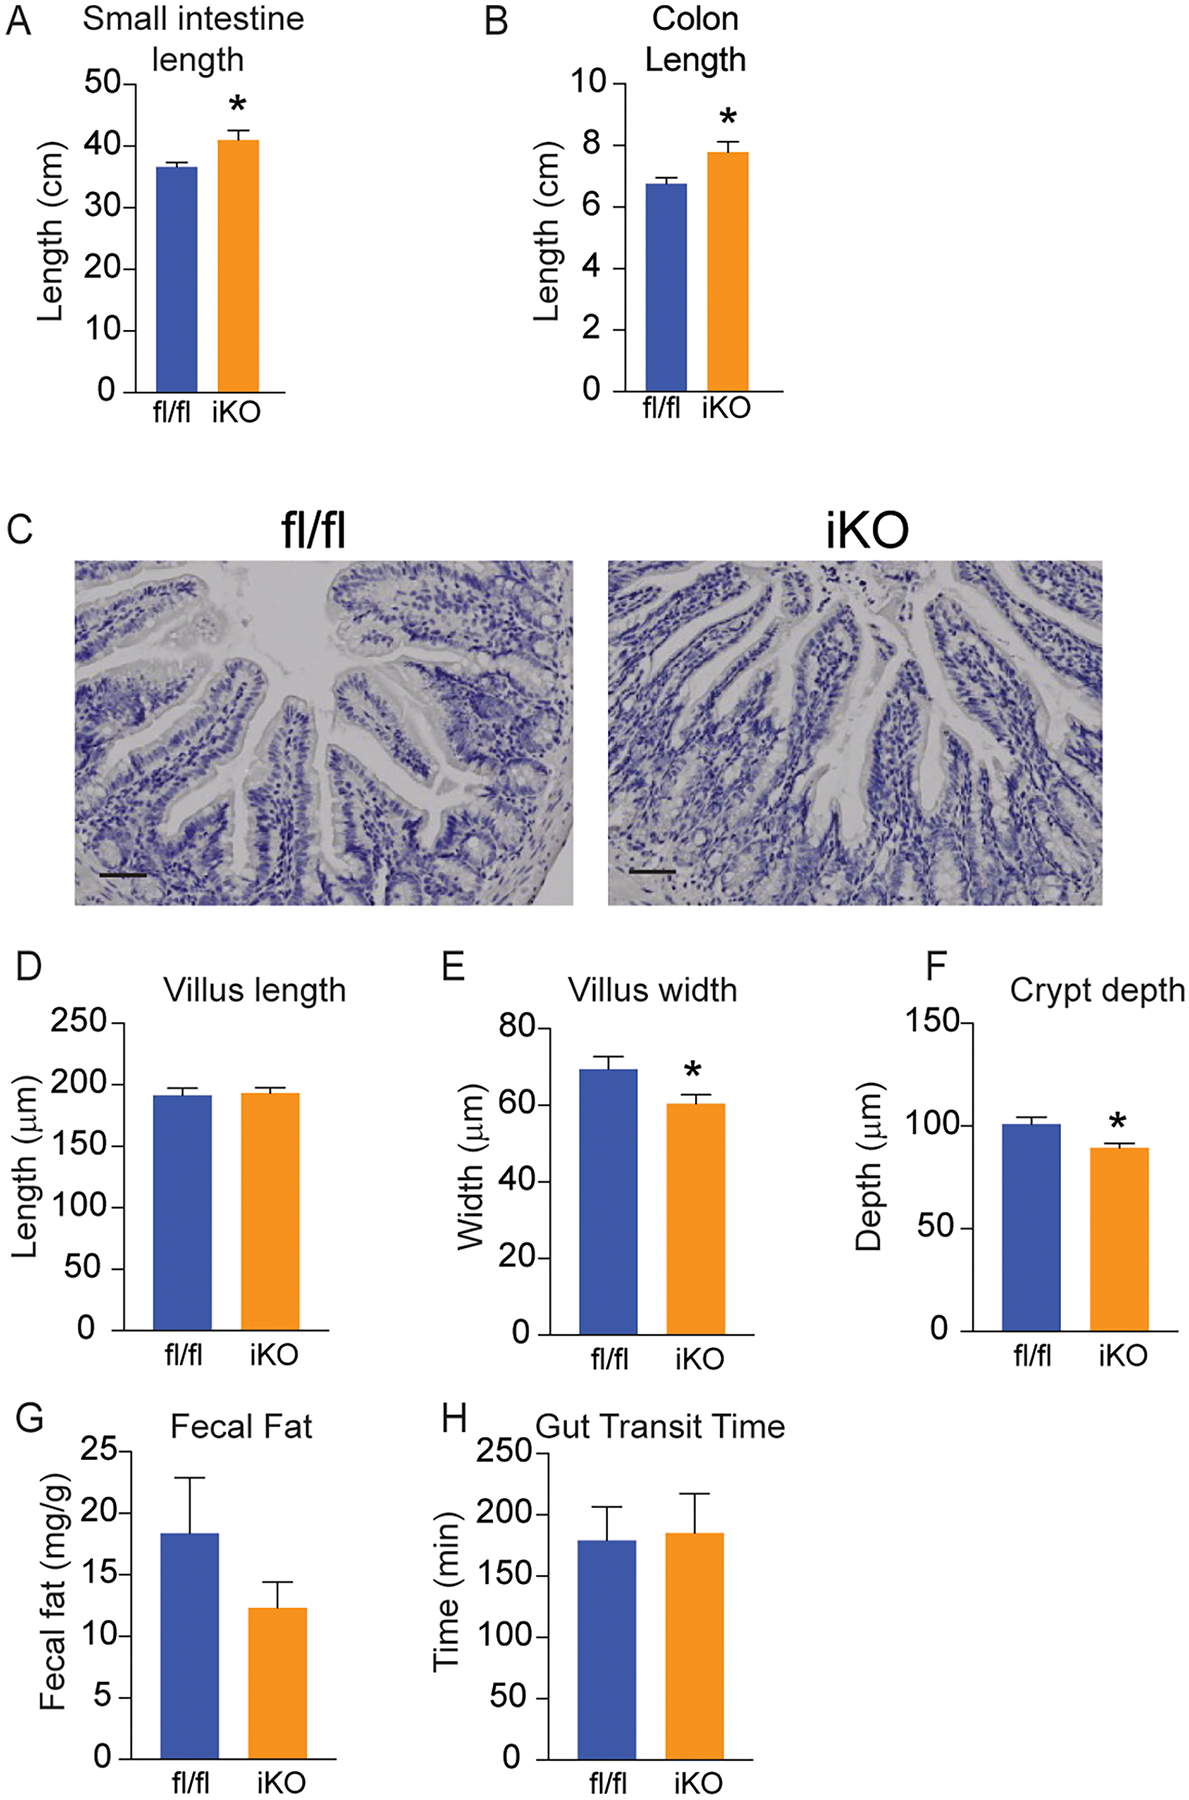
(A,B) Lengths of small intestine and colon were slightly increased in iKO mice; n=8–12. (C) H&E staining of Swiss-rolled intestine segments do not show any apparent pathological changes in iKO mice. Images are representative of 3 chow-fed mice, and images were taken throughout length of intestine; scale bar represents 25 μM. (D-F) Villus lengths were not alterd, but villus widths and crypt depths were slightly reduced in iKO mice; data represent 50–60 villi counted from 3 chow-fed mice. (G,H) Fecal fat content and gut transit time were not altered in chow-fed iKO mice; n=5–6. Averages ± SEM. *p<0.05 vs fl.
Taken together, these data indicate that SCD1 expression in the intestine is specifically and significantly ablated in the iKO model, without gross changes in intestinal function or body composition.
3.3. Deletion of intestinal SCD1 downregulates expression of other intestinal lipogenic genes
We have previously shown that hepatic SCD1 mediates the induction of lipogenic genes in response to pro-lipogenic diets (41). To determine if intestinal SCD1 may play a similar role in modulating lipogenic gene expression in the intestine, expression of several lipogenic genes was measured by qRT-PCR along the length of the intestine in mice maintained on a chow diet or subjected to an acute high-sucrose diet. There were no genotypic differences in body weights or food intake during sucrose refeeding studies (Supplementary Figure 2). Under chow-fed conditions, the only significant changes observed in lipogenic gene expression in iKO mice occurred in the distal portion of the small intestine. Expression of fatty acid synthase (Fas), acetyl-coenzyme A carboxylase, diacylglycerol O-acyltransferase 1 (Dgat1), and diacylglycerol O-acyltransferase 2 (Dgat2) were all significantly reduced in chow-fed iKO mice compared to their fl/fl counterparts in the distal small intestine (Figure 4C). Acute sucrose feeding significantly induced lipogenic gene expression in all segments of the small intestine and colon (Figures 4A–D). Interestingly, in sucrose-fed iKO mice, expression of sterol regulatory element binding transcription factor 1 (Srebp-1c) and target lipogenic genes in the distal small intestine was paradoxically increased in iKO mice (Figure 4C). These data indicate that lack of SCD1 in the intestine does not prevent the induction of these genes in response to sucrose feeding. Unlike in the small intestine, expression of Fas and Acc in the colon was significantly reduced in iKO mice, relative to fl/fl counterparts (Figure 4D). Expression of Srebp1c was also reduced in the colon of iKO mice, although this was not statistically significant. Mgat2 expression in the colon was unchanged, while Dgat1 was increased in the colon of iKO mice, as in the distal small intestine. Overall, these data indicate that under chow-fed conditions, lack of intestinal SCD1 may downregulate the expression of other lipogenic genes, many of which have been shown to regulate intestinal and systemic metabolism (28,29,31). However, upon refeeding a high-sucrose diet, which robustly induces both intestinal (Figure 1) and hepatic SCD1 (15), the lack of intestinal SCD1 does not prevent induction of intestinal lipogenic genes.
Figure 4. Intestinal and hepatic lipogenic gene expression is altered by intestinal SCD1 deficiency.
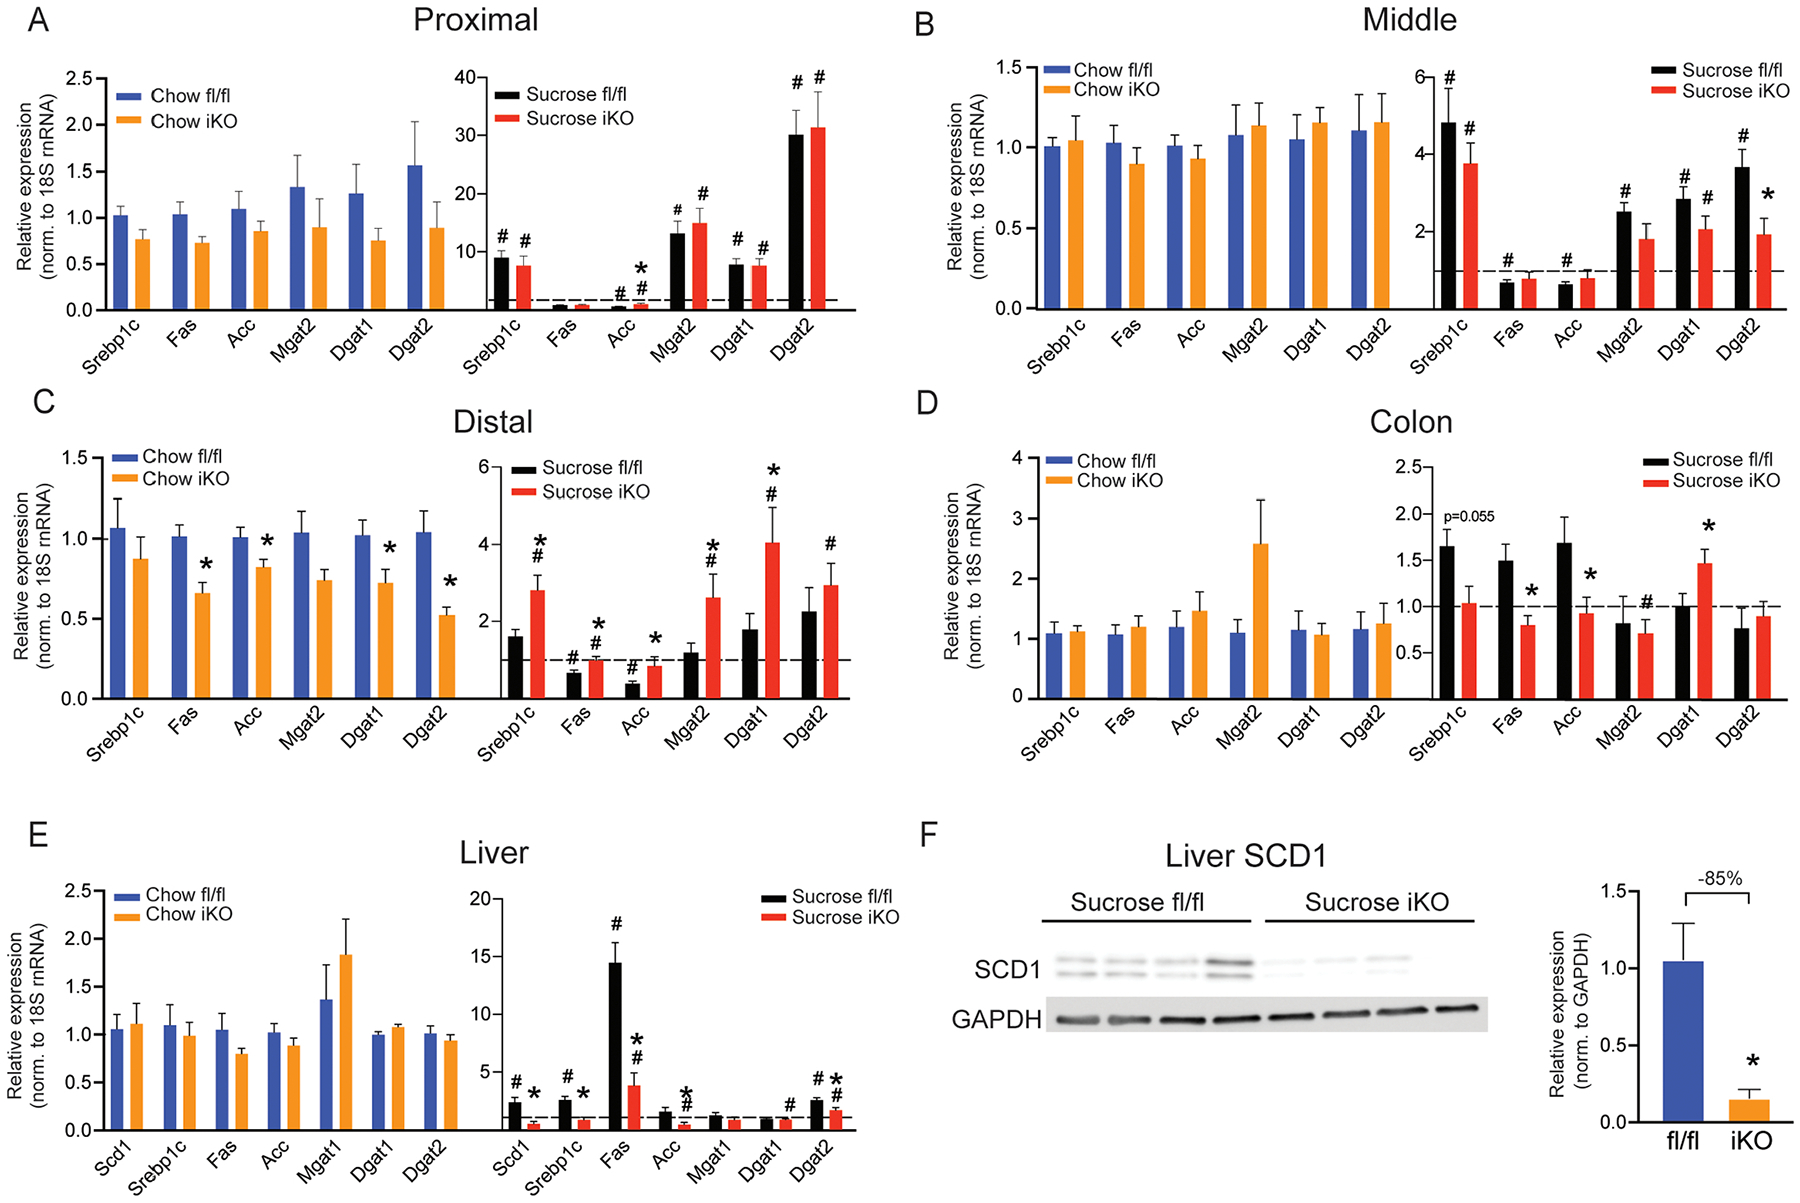
(A-E) Expression of lipogenic genes was measured by qRT-PCR in small intestine, colon, and liver of fl/fl and iKO mice fed a chow or sucrose diet; n=6–9. The dotted line represents a relative expression of 1.0. (F) SCD1 protein expression is reduced in livers of sucrose-fed iKO mice; n=4. Averages ± SEM. *p<0.05 vs. fl/fl; #p<0.05 vs. chow.
3.4. Intestinal SCD1 deletion downregulates hepatic lipogenic gene expression
To determine if the deletion of intestinal SCD1 impacted lipogenic gene expression in the liver, a key lipogenic organ, we measured hepatic lipogenic gene expression. Under chow-fed conditions, there were no significant differences in any of the lipogenic genes measured in livers of fl/fl vs. iKO mice (Figure 4E). As expected, sucrose feeding robustly induced lipogenic genes in livers of fl/fl mice (Figure 4E). Interestingly, hepatic Scd1 was significantly lower in iKO livers, relative to fl/fl livers. Consistent with reduced expression of hepatic Scd1, other hepatic lipogenic genes, including Srebp1c, Acc, and Fas were also significantly lower in sucrose-fed iKO mice. The lower hepatic Scd1 gene expression in iKO mice following sucrose feeding, was also apparent in reduced hepatic SCD1 protein levels in these mice (Figure 4F). These data indicate that the absence of intestinal SCD1 reduces hepatic expression of SCD1 and lipogenic genes, in response to a pro-lipogenic diet, although the mechanisms mediating this communication between the intestine and liver following sucrose feeding are not yet known.
3.5. Intestinal SCD1 alters lipid content and composition of the small intestine
To determine if intestinal SCD1 deletion alters tissue lipid metabolism, we carried out in-depth targeted lipidomic analyses of intestinal segments from fl/fl vs. iKO mice after both dietary paradigms.
3.5.1. Proximal small intestine:
The proximal intestine has relatively low SCD1 expression but is the major site of lipid digestion and absorption. Triacylglycerols were significantly reduced by 47% in chow-fed iKO mice (Figure 5A). In addition, DAGs, FFAs and MAGs were also reduced by 30% each (Figure 5C, D and F), although these did not reach statistical significance due to inherent variability in lipid content between mice. After refeeding a high-sucrose diet, no significant genotypic differences were observed in proximal intestine total lipid content. Interestingly, we observed that while the content of most lipids was similar in chow-fed and sucrose-refed mice, sucrose feeding increased FFA levels by over 15-fold while reducing levels of TAG by 5-fold, relative to chow-fed animals (Figure 5D). While these changes could be attributable to acute increases in rates of de novo lipogenesis following this refeeding paradigm, expression of Fas and Acc were not elevated in the proximal intestine upon sucrose refeeding (Figure 4A). However, these increases in FFA upon acute feeding of a high-glycemic diet warrant further investigations into the potential effects of longer-term consumption of these diets.
Figure 5. Lipidomic changes in proximal intestine of iKO mice.
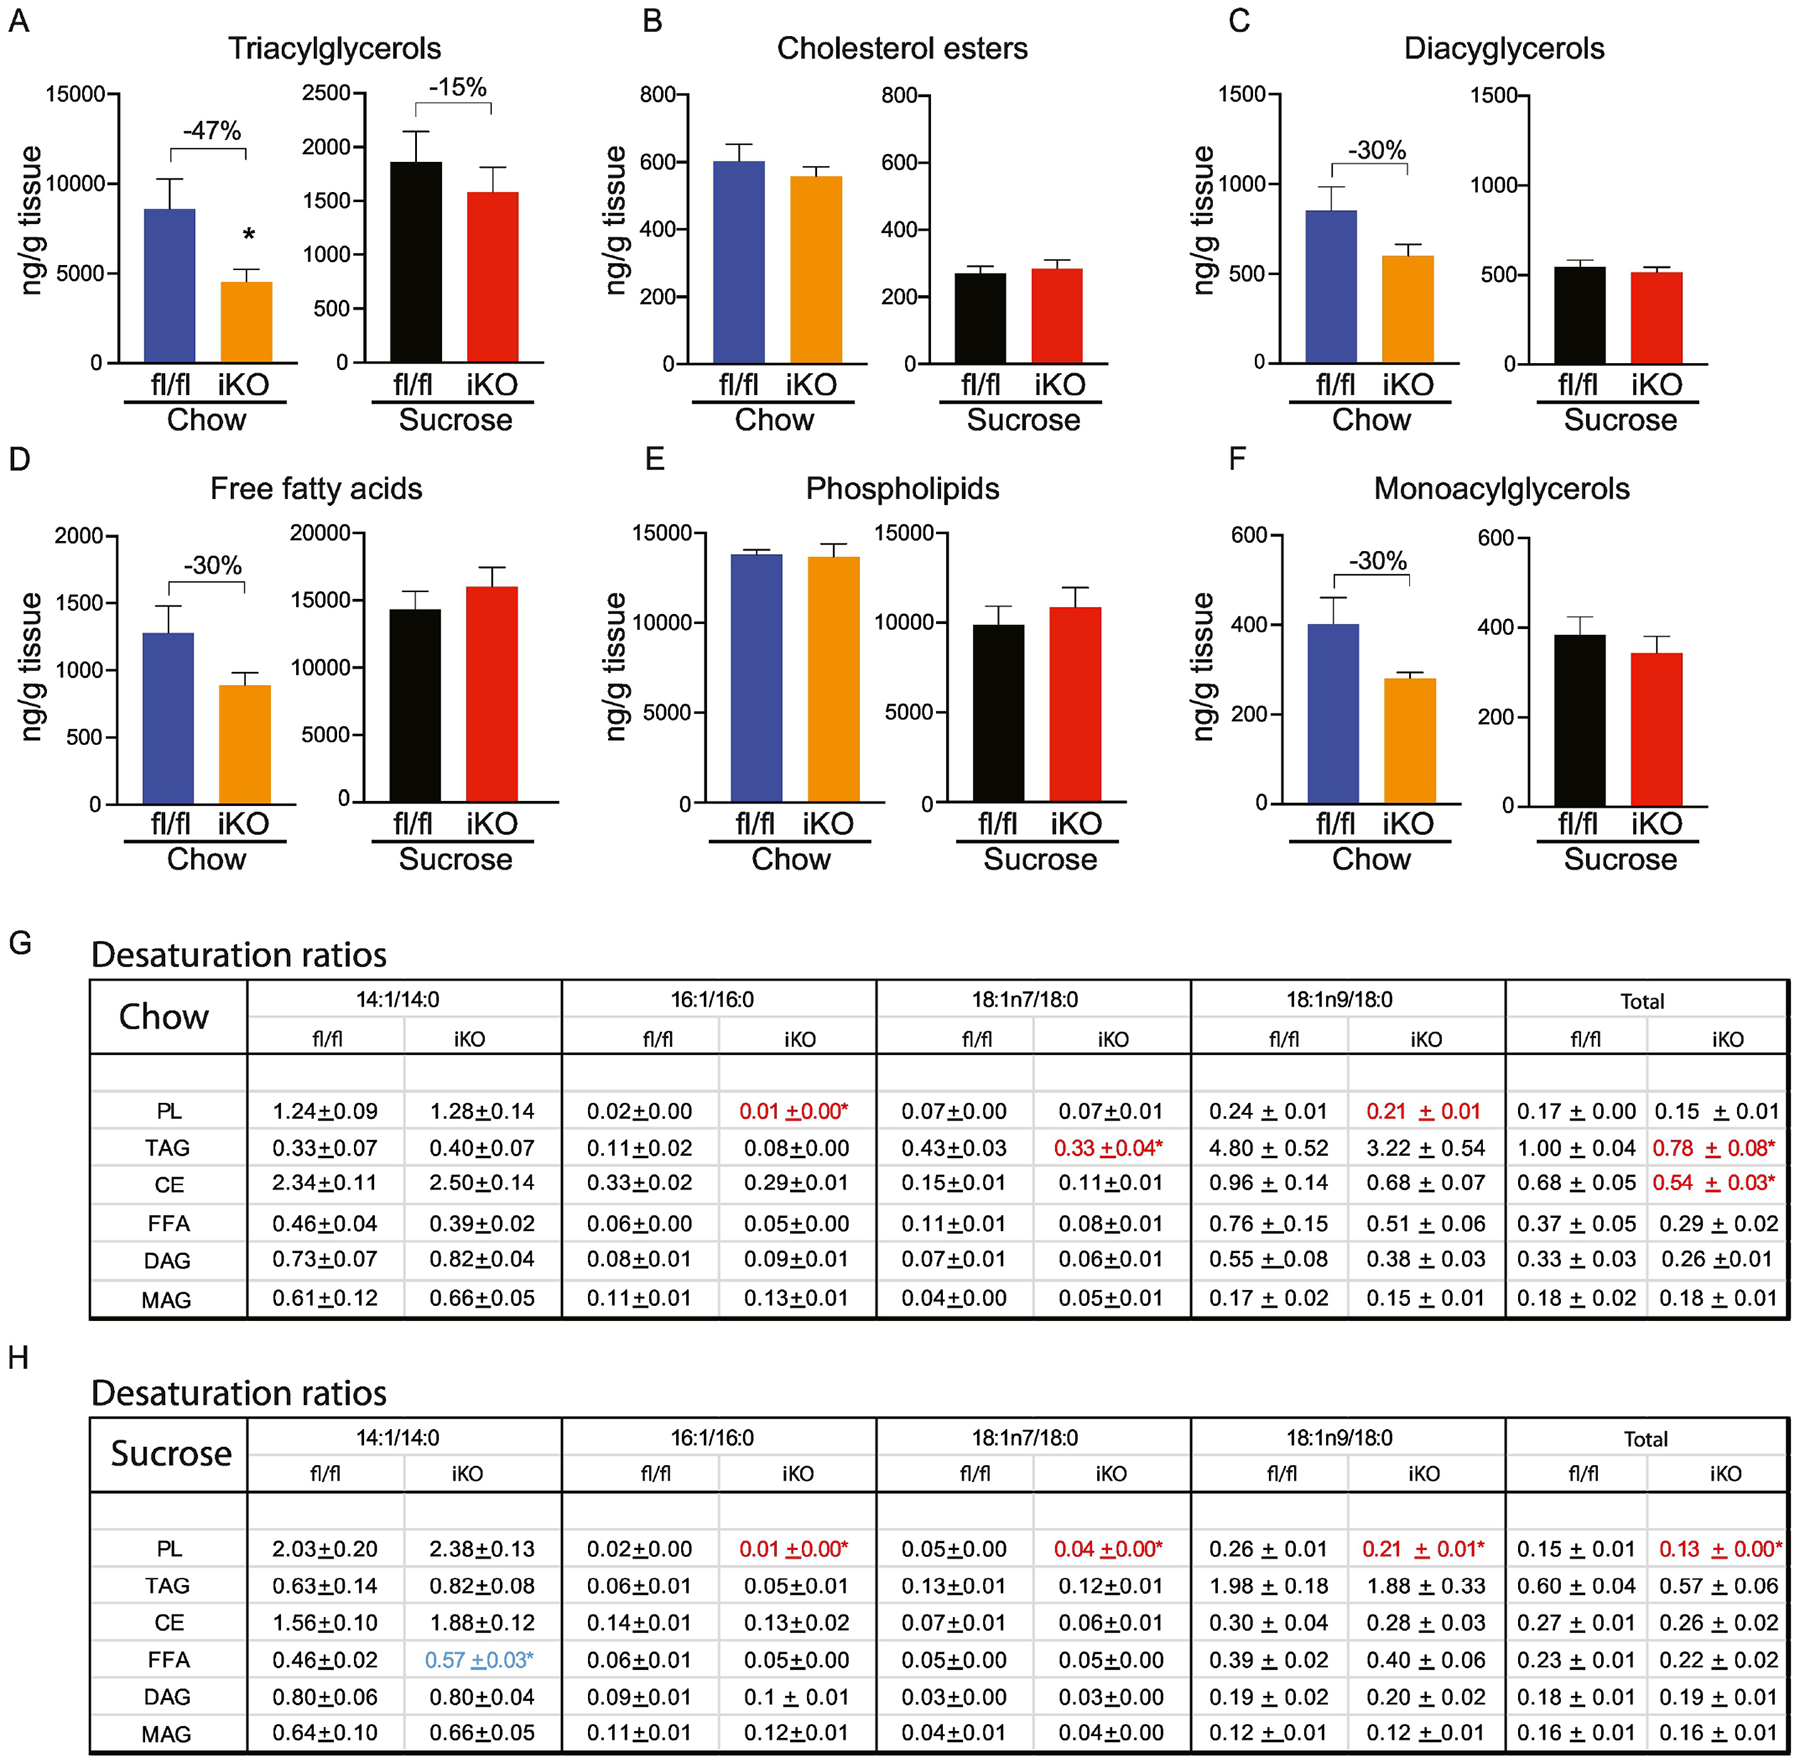
(A-F) Total content of triacylglycerols (TAG), cholesterol esters (CE), diacylglycerols (DAG), free fatty acids (FFA), and phospholipids (PL), and monoacylglycerols was determined by TLC-GC-MS using mucosal scrapings from proximal small intestines. (G, H) Desaturation ratios for 14–18 carbon chain lipid species were calculated for each lipid fraction from chow-fed and sucrose-fed mice. Red text denotes desaturation ratios that were significantly reduced, and blue text denotes desaturation ratios that were significantly increased in iKO mice, relative to diet-matched fl/fl controls. n=6. Averages ± SEM. *p<0.05 vs fl/fl.
We analyzed acyl chain composition of each of the lipid classes (Supplementary Tables 1). These analyses revealed a significant reduction in myristoleic acid (14:1) in TAGs, FFAs, PLs and DAGs in proximal intestine of chow-fed iKO mice. Concomitantly, levels of stearate (18:0), a substrate of SCD1, were increased in the CE fraction, while levels of oleic acid (18:1n9) were reduced in the DAG and MAG fractions of chow-fed iKO mice. Upon refeeding a high-sucrose diet, no genotypic differences in acyl chain composition were noted.
We calculated desaturation ratios as a measure of desaturase activity in the proximal intestine. To do this, content of monounsaturated fatty acids ranging from 14–18 carbons was divided by content of their respective saturated precursors. Four desaturation ratios, 14:1n5/14:0, 16:1n7/16:0, 18:1n7/18:0, and 18:1n9/18:0, as well as a total desaturation ratio were calculated for each fraction. Under chow-fed conditions, the total desaturation ratio was significantly reduced in TAG and CE fractions of iKO mice in the proximal intestine, as a result of relative reductions in the 16:1 and 18:1n7 ratios (Figure 5G). In addition, the PL-16:1 ratio and PL-18:1n9 ratio were reduced in chow-fed iKO mice. After sucrose refeeding, although total lipid content was not different between fl/fl and iKO mice, the total desaturation index was significantly reduced in PL from iKO mice, due to significant reductions in 16:1, 18:1n7, and 18:1n9 ratios (Figure 5H).
3.5.2. Mid-small intestine:
In the middle segments of the small intestine, we did not observe any significant changes between the fl/fl and iKO mice in total TAG, CE, FFA, PL, DAG, or MAG content in either the chow or sucrose-refed conditions (Figure 6A–F; Supplementary Tables 2). Despite this, myristoleic acid content was significantly reduced in DAG from chow-fed iKO mice, relative to fl/fl counterparts (Supplementary Table 2C). However, desaturation ratios were not significantly different between genotypes under either dietary condition in the middle segments of the small intestine, except for a slight increase in the CE-18:n9 ratio in sucrose-fed iKO mice (Figures 6G and H).
Figure 6. Lipidomic changes in in middle intestine of iKO mice.
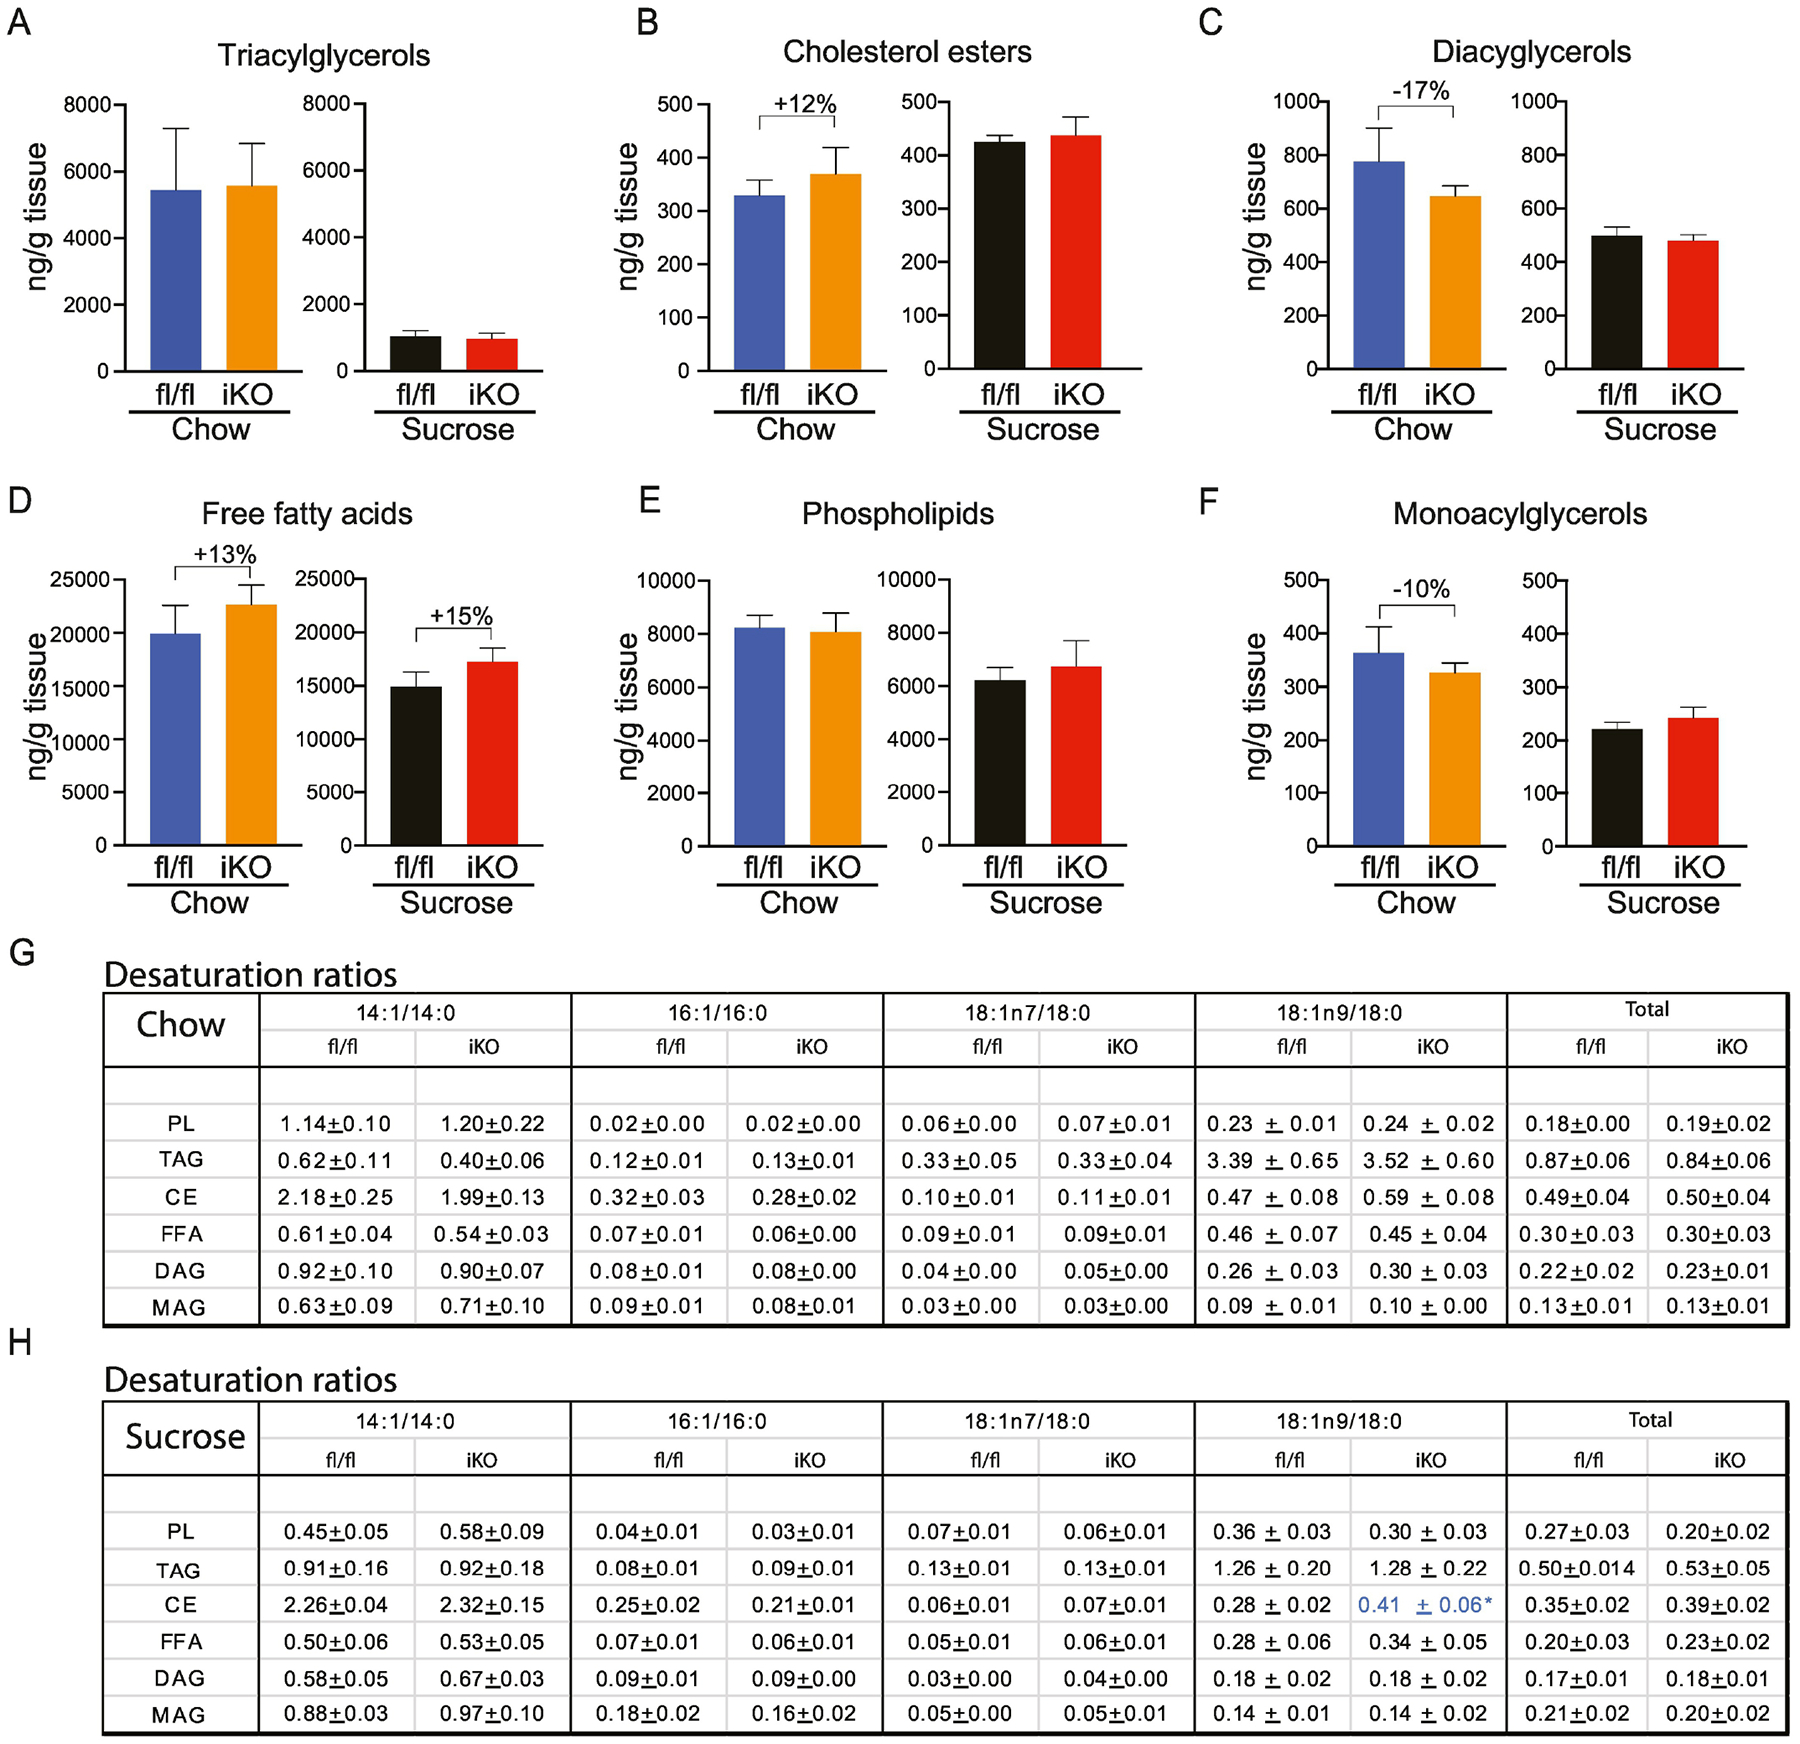
(A-F) Total content of triacylglycerols (TAG), cholesterol esters (CE), diacylglycerols (DAG), free fatty acids (FFA), and phospholipids (PL), and monoacylglycerols was determined by TLC-GC-MS using mucosal scrapings from mid-small intestines. (G, H) Desaturation ratios for 14–18 carbon chain lipid species were calculated for each lipid fraction from chow-fed and sucrose-fed mice. Blue text denotes desaturation ratio that was significantly increased in iKO mice, relative to diet-matched fl/fl controls. n=6. Averages ± SEM. *p<0.05 vs fl/fl.
3.5.3. Distal small intestine:
SCD1 had the highest expression in the distal intestine, so we hypothesized that lipidomic changes would be most apparent in this tissue (Figure 7; Supplementary Tables 3). We observed a remarkable 80% reduction in the TAG content in chow-fed iKO distal intestines (Figure 7A). CE content was also significantly reduced by almost 30% in iKO mice (Figure 7B). Further, there was a 20% reduction in DAG content, but this was not statistically significant (Figure 7C). MAG, FFA, and PL were not changed in iKO mice (Figure 7D–F). The large reduction in TAG levels, along with smaller reductions in other esterified lipids, suggests a reduction in lipid esterification in the distal intestine of iKO mice. In addition, we observed significant reductions in the TAG-18:1n7 and TAG-18:1n9 ratios, as well as the FFA-14:1 ratio in distal intestine of iKO mice (Figure 7G).
Figure 7. Lipidomic changes in distal intestine of iKO mice.
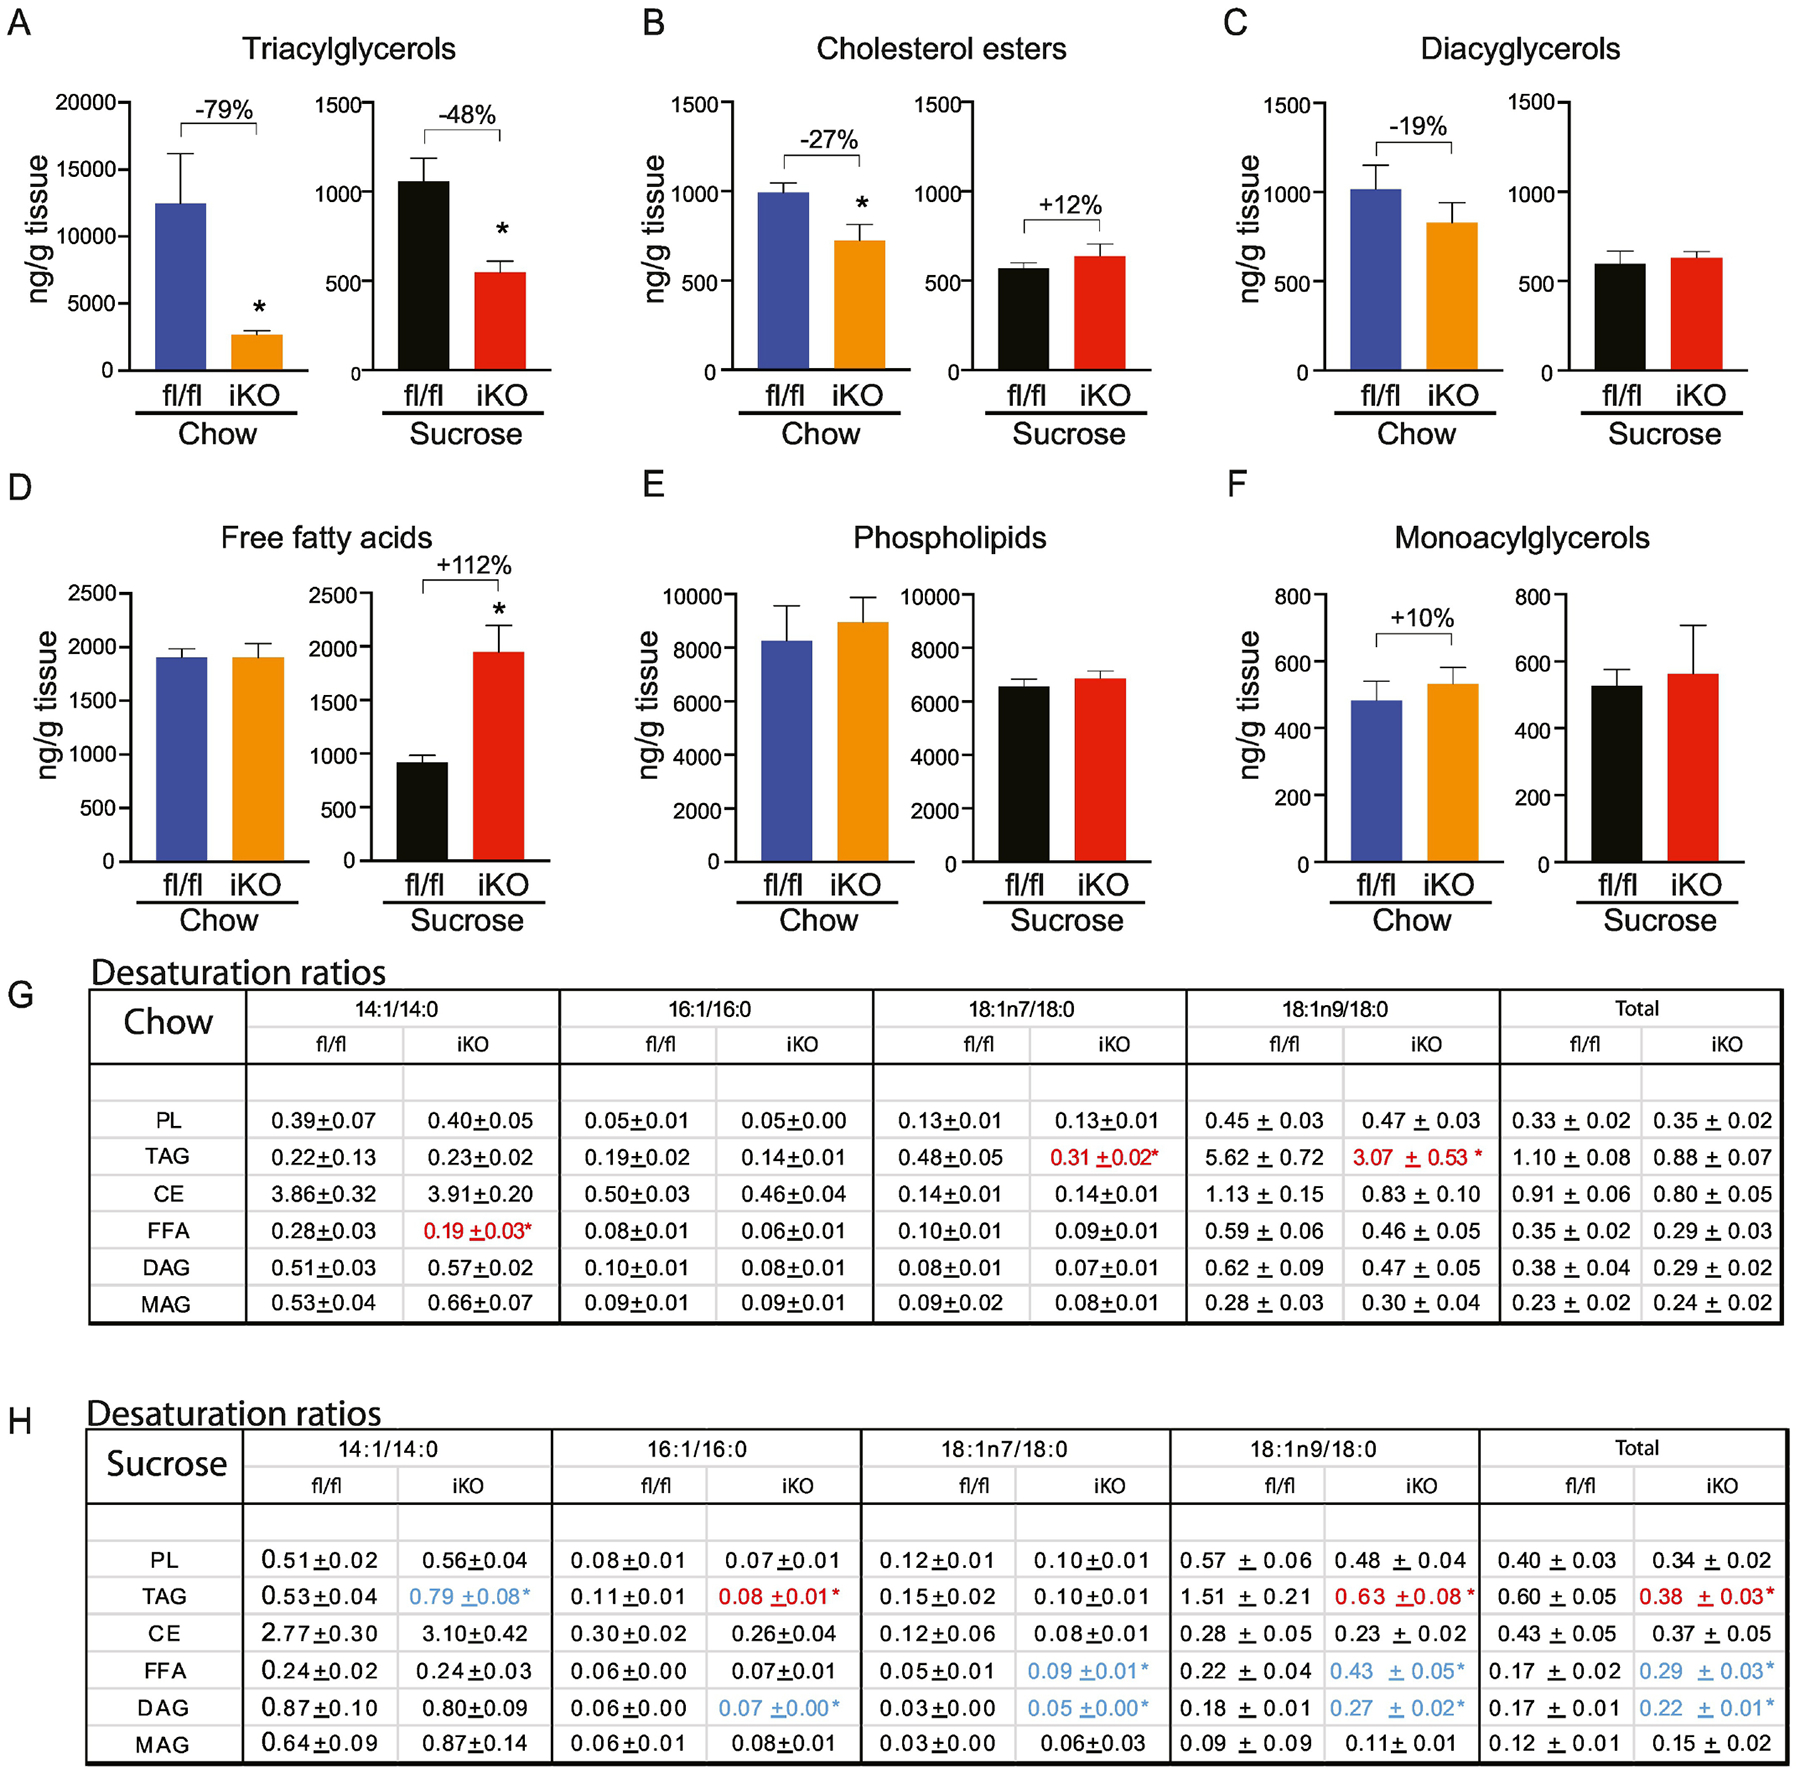
(A-F) Total content of triacylglycerols (TAG), cholesterol esters (CE), diacylglycerols (DAG), free fatty acids (FFA), and phospholipids (PL), and monoacylglycerols was determined by TLC-GC-MS using mucosal scrapings from distal small intestines. (G, H) Desaturation ratios for 14–18 carbon chain lipid species were calculated for each lipid fraction from chow-fed and sucrose-fed mice. Red text denotes desaturation ratios that were significantly reduced, and blue text denotes desaturation ratios that were significantly increased in iKO mice, relative to diet-matched fl/fl controls. n=6. Averages ± SEM. *p<0.05 vs fl/fl.
Upon refeeding a sucrose diet, we observed a remarkable doubling of FFA in the distal intestine of iKO mice, relative to fl/fl controls (Figure 7D). This was only observed in iKO mice, unlike for proximal intestine, where sucrose feeding increased FFA levels in all mice (Figure 5D). This relative increase in FFA in distal intestine of sucrose-fed iKO mice was driven by a significant increases in 15 of the measured fatty acid species (Supplementary Table 3D). Concomitantly, TAG content was significantly reduced by almost 50% in distal intestine of sucrose-refed iKO mice (Figure 7A; Supplementary Table 3A), suggesting a potential inability to esterify FFA to TAG in iKO intestines. In addition, the TAG-16:1, TAG-18:1n9, and TAG-total desaturation ratios were significantly reduced in iKO mice (Figure 7H). Interestingly, the 18:1n7 ratio,18:1n9 ratio, and total desaturation ratios were all significantly increased in the FFA fraction, indicating reduced incorporation of these lipids into the TAG fraction. Total CE, MAG, DAG, and PL content were not significantly altered (Figure 7B, C, E and F). However, many of the acyl chains comprising the DAG fraction were significantly increased in iKO mice (Supplementary Table 3C). Consequently, the DAG-16:1, DAG-18:1n7, DAG-18:1n9, and DAG-total desaturation ratios were all significantly increased in distal DAGs of iKO mice, following sucrose refeeding (Figure 7H).
3.5.4. Colon:
No significant differences were observed between genotypes in the colon under chow-fed conditions, although TAGs were non-significantly reduced by over 30% (Figure 8A–F). Interestingly, upon sucrose refeeding, there was a significant decrease in the DAG content in colon of iKO mice (Figure 8C). Also of note, we observed a 15% increase in colon PL in iKO mice (Figure 8E). Although this increase was not statistically significant, it was the only change in total PL content observed throughout the length of the intestine. Indeed, PL content and composition remains remarkably static upon manipulation of SCD1 in multiple other tissues (15,18). This non-significant increase in PL content was rendered more interesting by the observation that the PL-16:1, PL-18:1n7, PL-18:1n9, and PL-total desaturation ratios were all significantly reduced in colon of sucrose-fed iKO mice (Figure 8H). The relative 15% increase in colon PL of sucrose-fed iKO mice was driven by increases in levels of 18:2n6 and other longer-chained SFAs and polyunsaturated fatty acids (Supplementary Table 4E). Acyl chain analyses revealed relatively few other changes in the colon of iKO mice (Supplementary Tables 4).
Figure 8. Lipidomic changes in colon of iKO mice.
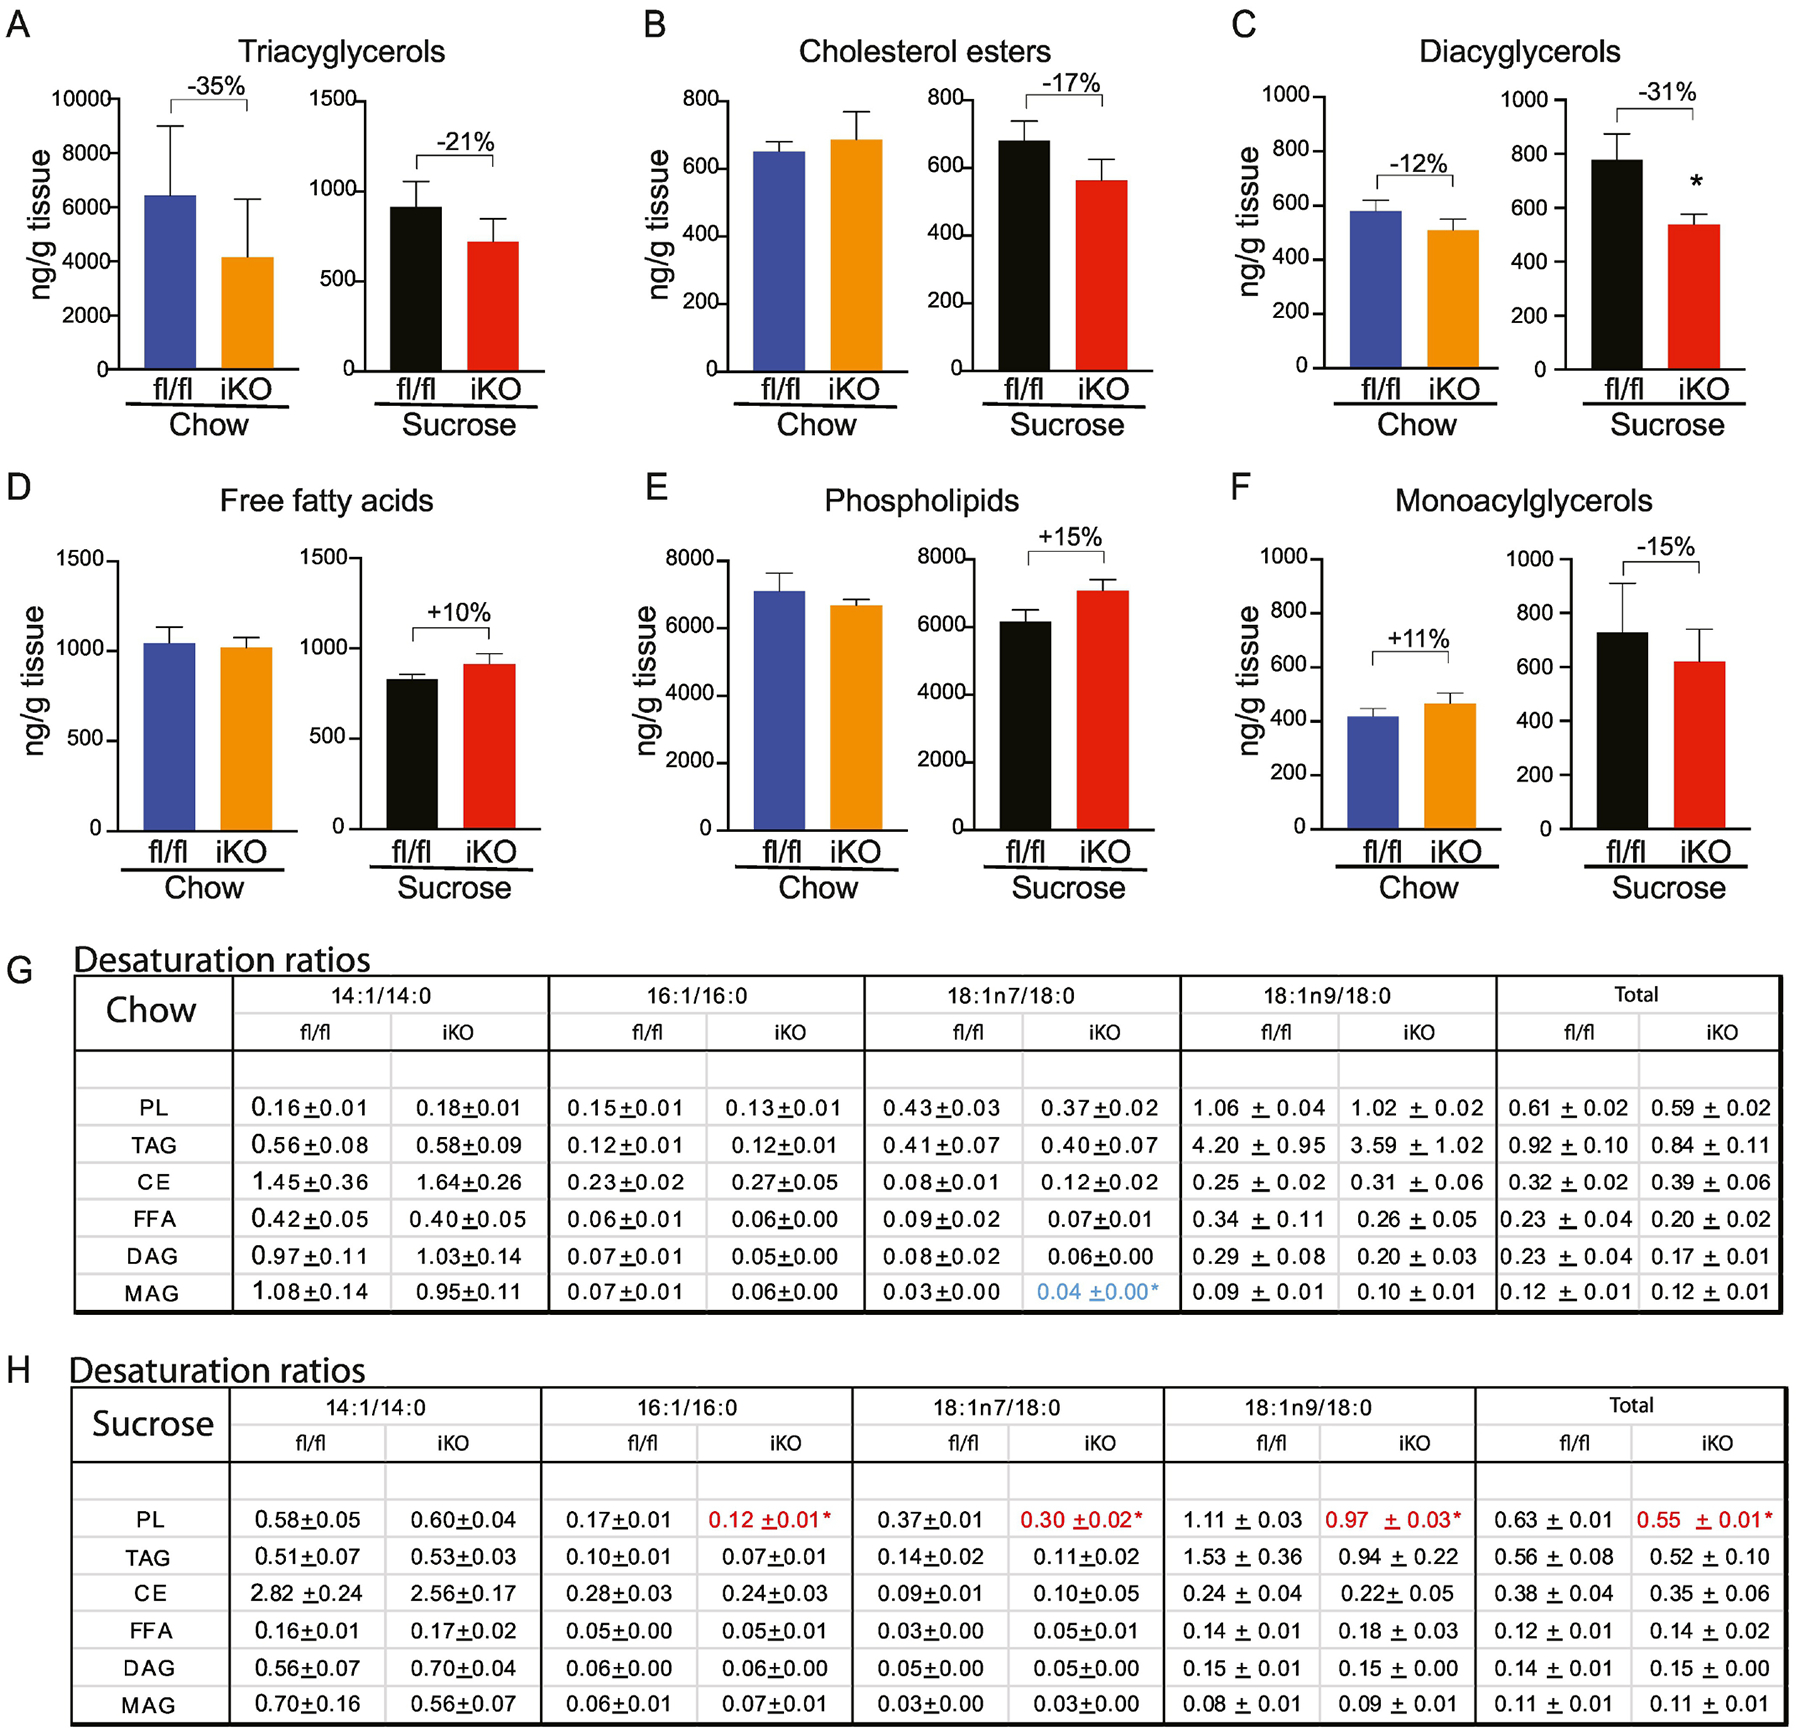
(A-F) Total content of triacylglycerols (TAG), cholesterol esters (CE), diacylglycerols (DAG), free fatty acids (FFA), and phospholipids (PL), and monoacylglycerols was determined by TLC-GC-MS using mucosal scrapings from colon. (G, H) Desaturation ratios for 14–18 carbon chain lipid species were calculated for each lipid fraction from chow-fed and sucrose-fed mice. Red text denotes desaturation ratios that were significantly reduced, and blue text denotes desaturation ratios that were significantly increased in iKO mice, relative to diet-matched fl/fl controls. n=6. Averages ± SEM. *p<0.05 vs fl/fl.
3.5.6. Intestine lipids summary:
Taken as a whole, our lipidomics analyses indicate significant reductions in unsaturated lipids and desaturation ratios in iKO mice, particularly in the distal small intestine, where expression of SCD1 is high. They identify myristoleic acid and the 14:1/14:0 ratio as a novel variable impacted by tissue SCD1 genotype. They also indicate that despite the relatively high colonic expression of SCD1, deletion of SCD1 does not modulate colonic lipid composition to the same extent as in the distal small intestine.
3.6. Deletion of intestinal SCD1 decreases plasma TAG and cholesterol and alters the hepatic lipidome through reductions in myristoleic acid
We next sought to determine if intestinal SCD1 deletion would alter lipid content and composition beyond that of the intestine, implicating a role for intestinal SCD1 in regulating systemic lipid balance. Accordingly, plasma and hepatic lipid content and composition were quantified. Plasma lipid analyses in chow-fed iKO mice revealed many significant reductions in lipid fractions (Figure 9; Supplementary Tables 5). Plasma TAGs were reduced by a remarkable 43% in iKO mice (Figure 9A). In addition, plasma CE levels were reduced by 17% (Figure 9B), plasma PL were reduced by 23% (Figure 9E), and plasma DAGs were reduced by 31% (Figure 9C). Plasma cholesterol was also significantly reduced in chow-fed iKO mice, relative to fl/fl controls (Figure 9F). In addition to changes in total lipid content, significant changes in desaturation ratios (Figure 9G) were observed in the DAG fraction, where the 14:1 ratio was reduced by a remarkable 90% in iKO mice and the DAG-18:1n7 ratio was also significantly reduced. This resulted in a 33% reduction in the DAG-total desaturation ratio in plasma of iKO mice (Figure 9G).
Figure 9. Plasma lipids are reduced in chow-fed iKO mice.
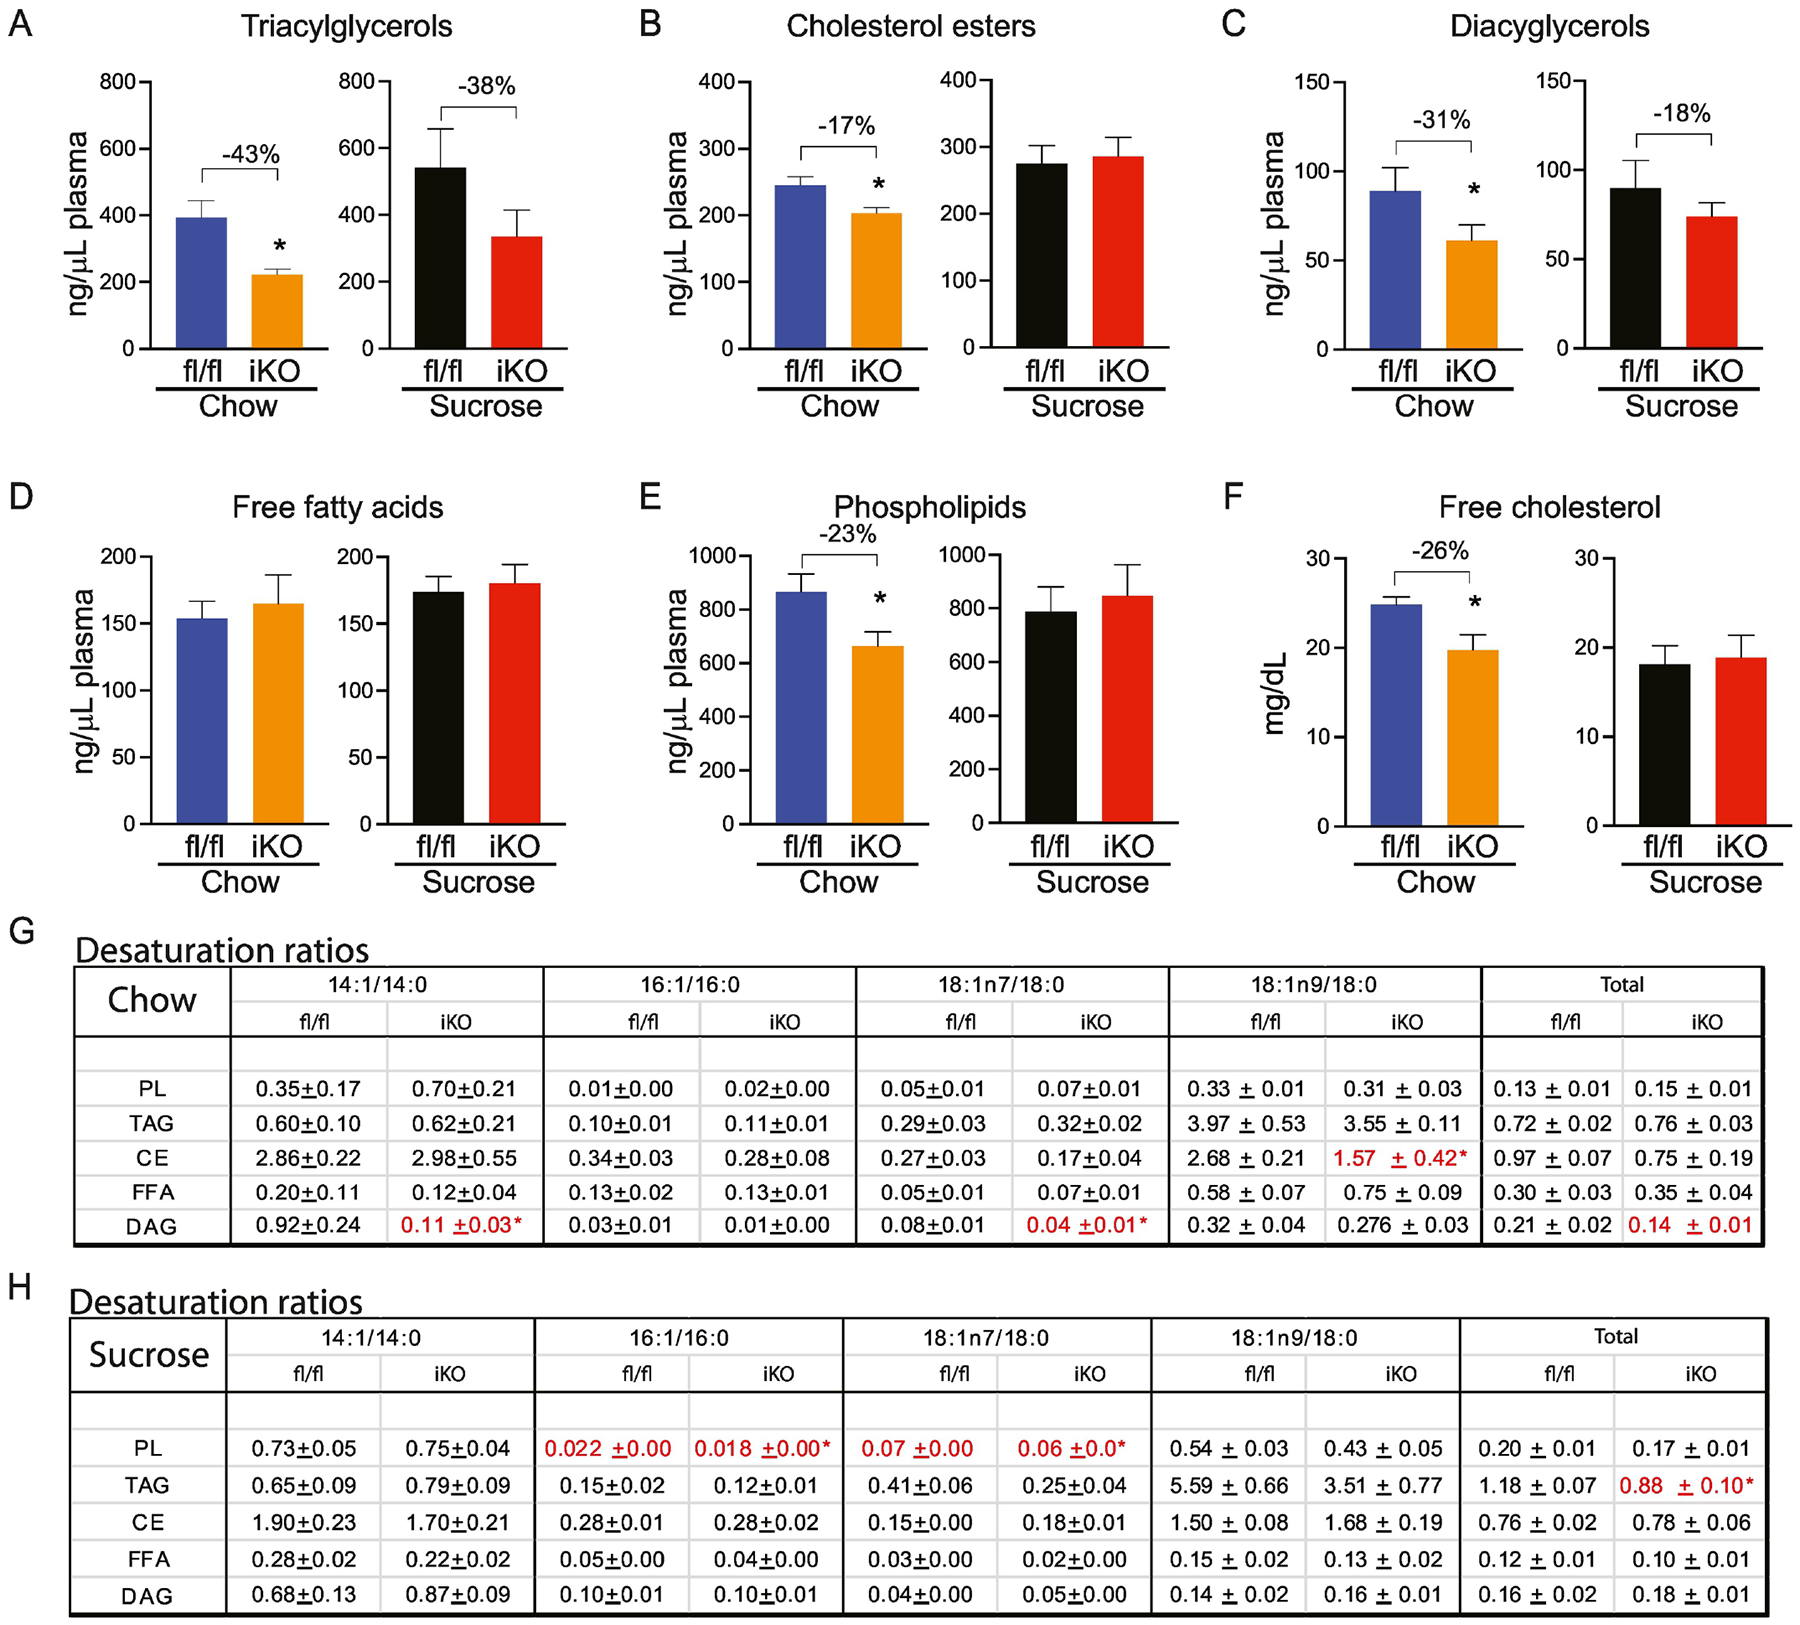
(A-E) Total content of plasma triacylglycerols (TAG), cholesterol esters (CE), diacylglycerols (DAG), free fatty acids (FFA), and phospholipids (PL) were determined by TLC-GC-MS. (F) Plasma free cholesterol was colorimetrically determined. (G, H) Desaturation ratios for 14–18 carbon chain lipid species were calculated for each lipid fraction from chow-fed and sucrose-fed mice. Red text denotes desaturation ratios that were significantly reduced, and blue text denotes desaturation ratios that were significantly increased in iKO mice, relative to diet-matched fl/fl controls. n=6. Averages ± SEM. *p<0.05 vs fl/fl.
In chow-fed iKO mice, hepatic lipid quantification revealed a significant 20% reduction in DAGs (Figure 10C). Concomitantly, the DAG-14:1 content (Supplementary Table 5C) was reduced by over 3-fold and the DAG-14:1/14:0 ratio was greatly reduced in livers of chow-fed iKO mice (Figure 10F). Indeed, despite a lack of other significant changes in total lipid content in any fraction besides DAG, the 14:1 ratio was remarkably and consistently reduced in the TAG (75%), PL (41%), and CE (83%) fractions. The 14:1 ratio was also reduced in the FFA fraction (41%), although this was not statistically significant. These data indicate that deletion of SCD1 in the intestine consistently reduces hepatic 14:1/14:0 ratios across most lipid fractions.
Figure 10. Lipidomic changes in livers of iKO mice.
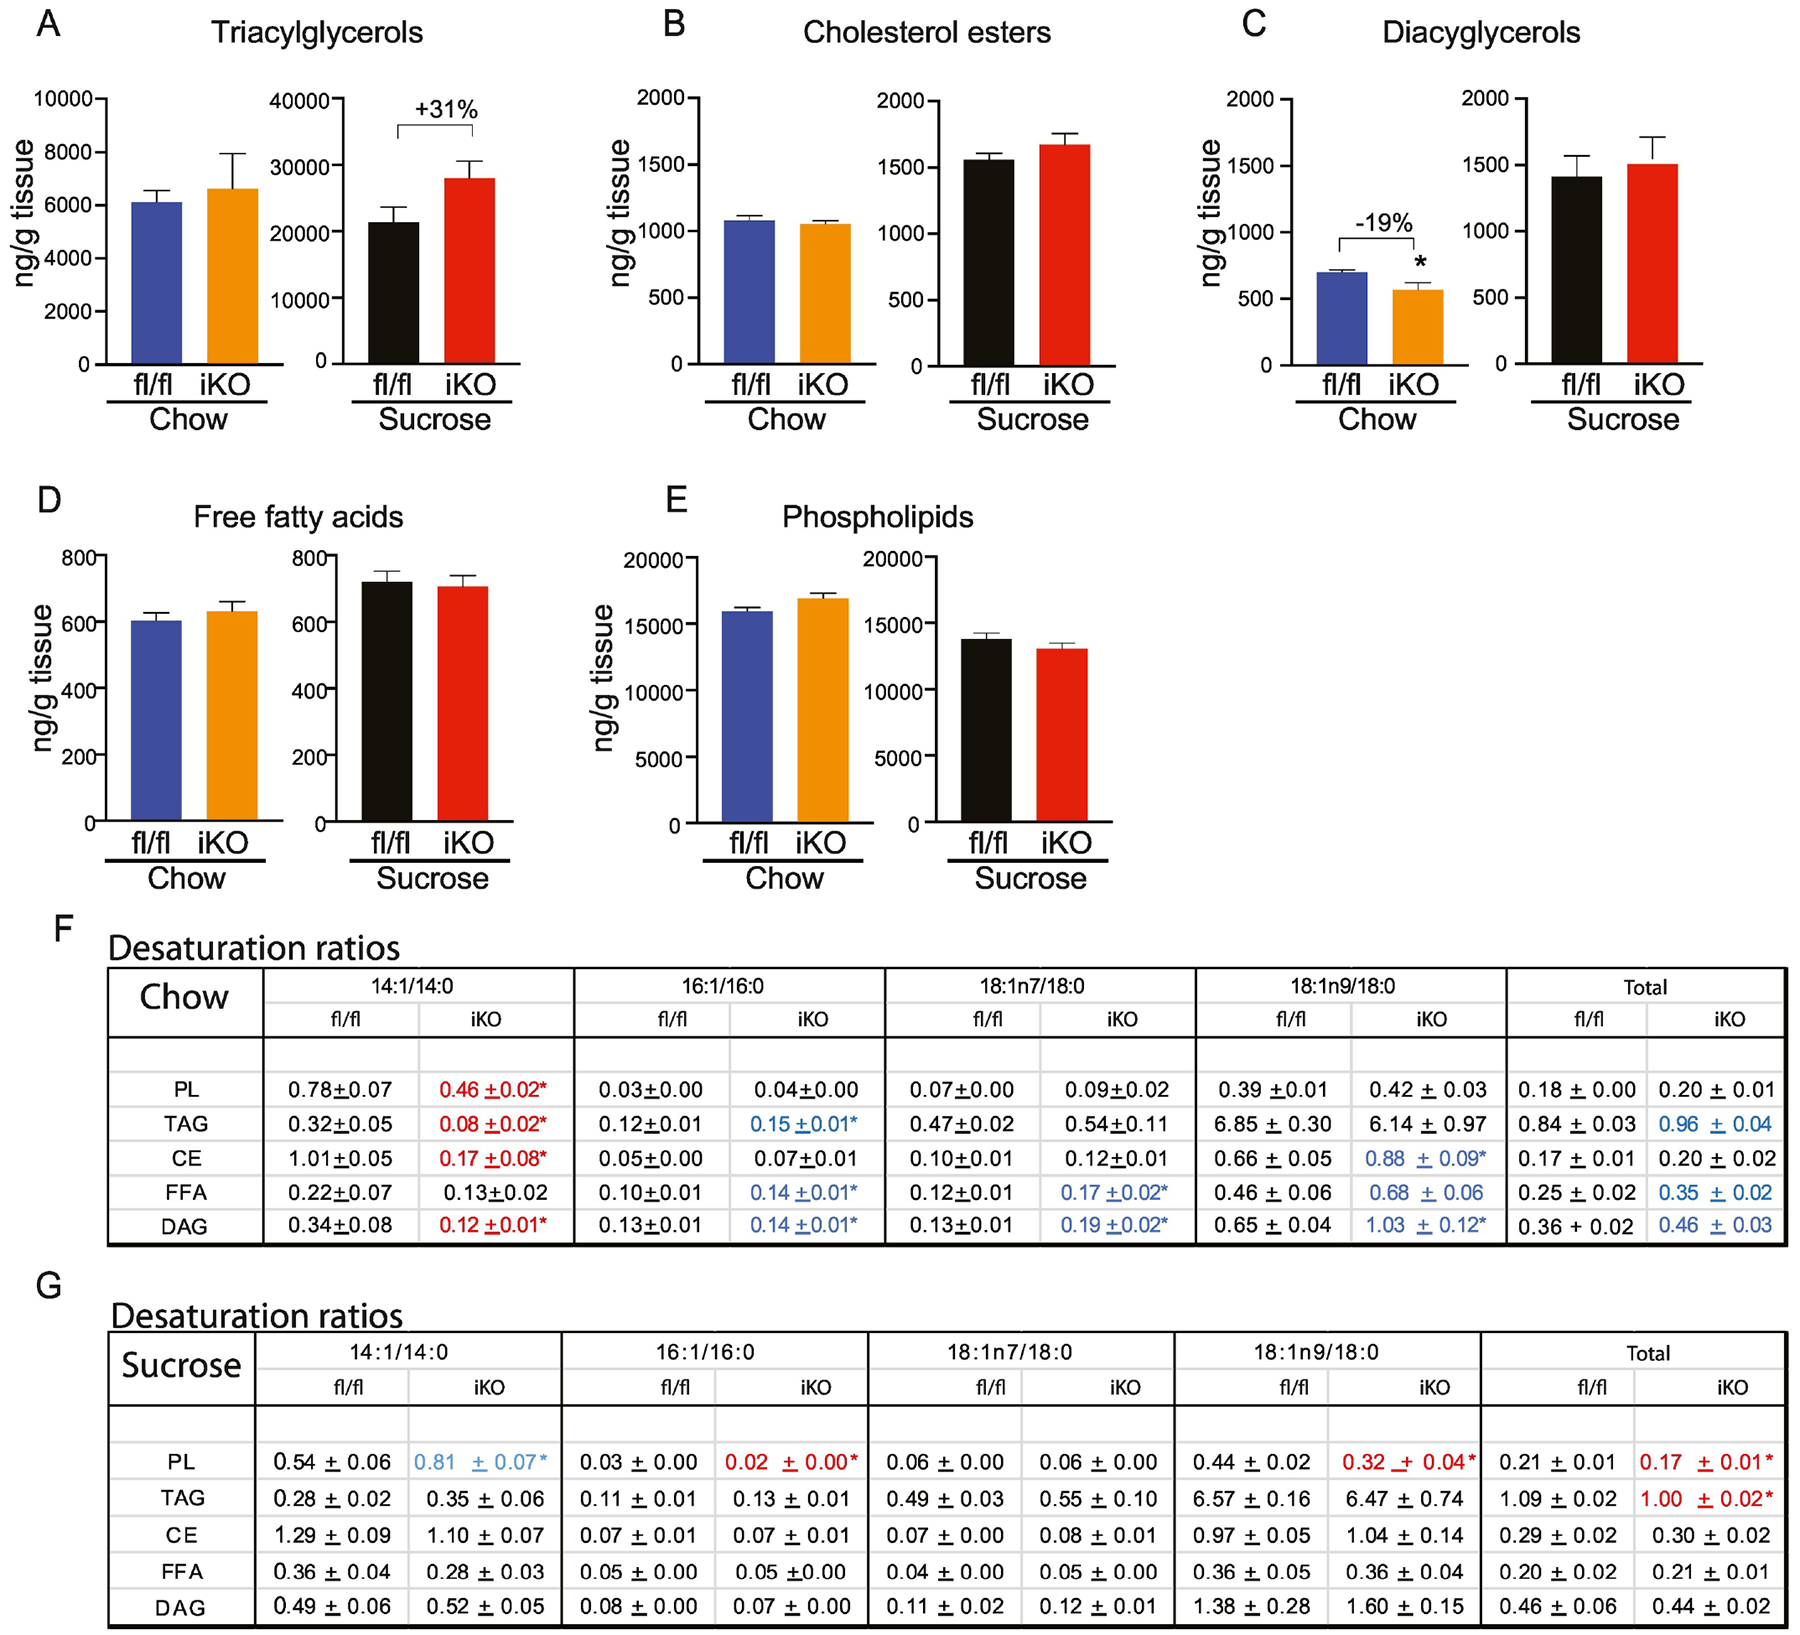
(A-E) Total content of hepatic triacylglycerols (TAG), cholesterol esters (CE), diacylglycerols (DAG), free fatty acids (FFA), and phospholipids (PL) were determined by TLC-GC-MS. (G, H) Desaturation ratios for 14–18 carbon chain lipid species were calculated for each lipid fraction from chow-fed and sucrose-fed mice. Red text denotes desaturation ratios that were significantly reduced, and blue text denotes desaturation ratios that were significantly increased in iKO mice, relative to diet-matched fl/fl controls. n=6. Averages ± SEM. *p<0.05 vs fl/fl.
Thus, beyond impacting intestinal lipid content, deletion of SCD1 in the intestine induced significant reductions in plasma lipid content in chow-fed mice. Further, the analyses of hepatic and plasma lipids indicate consistent reductions in the 14:1/14:0 ratio as a consequence of deletion of intestinal SCD1. To our knowledge, such consistent changes in 14:1 levels have not been previously reported in any dietary or genetic model, making these findings highly significant.
While these changes in hepatic and plasma lipid content were evident in chow-fed iKO mice, upon sucrose refeeding, plasma lipid content was largely similar between genotypes with only a few differences. Notably, the PL-16:1 and PL-18:1n7 ratios were significantly reduced in plasma of sucrose-fed iKO mice (Figure 9H). The significance of these changes is not clear. Similarly, hepatic lipid analyses in sucrose-fed mice revealed not many significantly different changes, except for an increase in the PL-14:1 ratio and a slight decrease in the PL-16:1 ratio, PL-18:1n9 ratio, and PL-total desaturation ratios, as well as a reduction in the TAG-total desaturation ratio in iKO mice (Figure 10G). These data indicate that in the context of an acute high-sucrose diet, hepatic and plasma MUFA content may largely be dependent on changes in SCD1 expression in extra-intestinal tissues such as liver or adipose, rather than on intestinal SCD1 levels. We also note that the high-sucrose diet used in these studies was very low in fat content and was notably lacking in myristate (Supplementary Table 7), which may further explain the lack of changes in 14:1 levels in iKO mice fed this diet. Whether hepatic and plasma lipids would be differentially affected by longer-term feeding of high-glycemic index diets in iKO mice is not yet known.
3.7. Reduced hepatic myristoleate levels are associated with decreased expression of Pgc1α-Sirt1 and their target genes in livers of iKO mice
Recent studies have indicated that hepatic MUFAs directly activate signaling through the NAD-dependent protein deacetylase Sirtuin-1 (SIRT1)- Peroxisome proliferator-activated receptor gamma coactivator 1-alpha (PGC-1α) axis in the liver (42). These effects were demonstrated for both 16:1 and 18:1, but any effects of other MUFAs on SIRT1 activation were not reported (42). Given our observations of consistently reduced 14:1 levels in all but the FFA fraction of hepatic lipids in chow-fed iKO mice (Figure 10F), we asked the question of whether hepatic expression of Sirt1, Pgc-1α, and their classical target genes associated with fatty acid oxidation would be altered in livers of iKO mice. Interestingly, expression of both Pgc-1α and Sirt1, as well as peroxisome proliferator activated receptor-alpha (Pparα), medium-chain acyl-CoA dehydrogenase (Mcad), long-chain acyl-CoA dehydrogenase (Lcad), fatty acid translocase (Cd36), and carnitine palmitoyltransferase-1 (Cpt-1) were all significantly reduced in livers of chow-fed iKO mice, relative to fl/fl counterparts (Figure 11A). Given prior reports on the role of hepatic MUFAs in modulating signaling through the SIRT1-PGC1α, axis, it is tempting to speculate that these reductions in fatty acid oxidation gene expression may be a consequence of reduced levels of myristoleic acid in livers of mice lacking intestinal SCD1. Consistent with this hypothesis, sucrose-fed iKO mice, that show no modulation of hepatic 14:1 levels (Figure 10G), also did not have any significant changes in hepatic expression of Sirt1, Pgc-1α, and fatty acid oxidation genes (Figure 11B).
Figure 11. Hepatic expression of Pgc1α-Sirt1 and their target genes is reduced in chow-fed iKO mice.
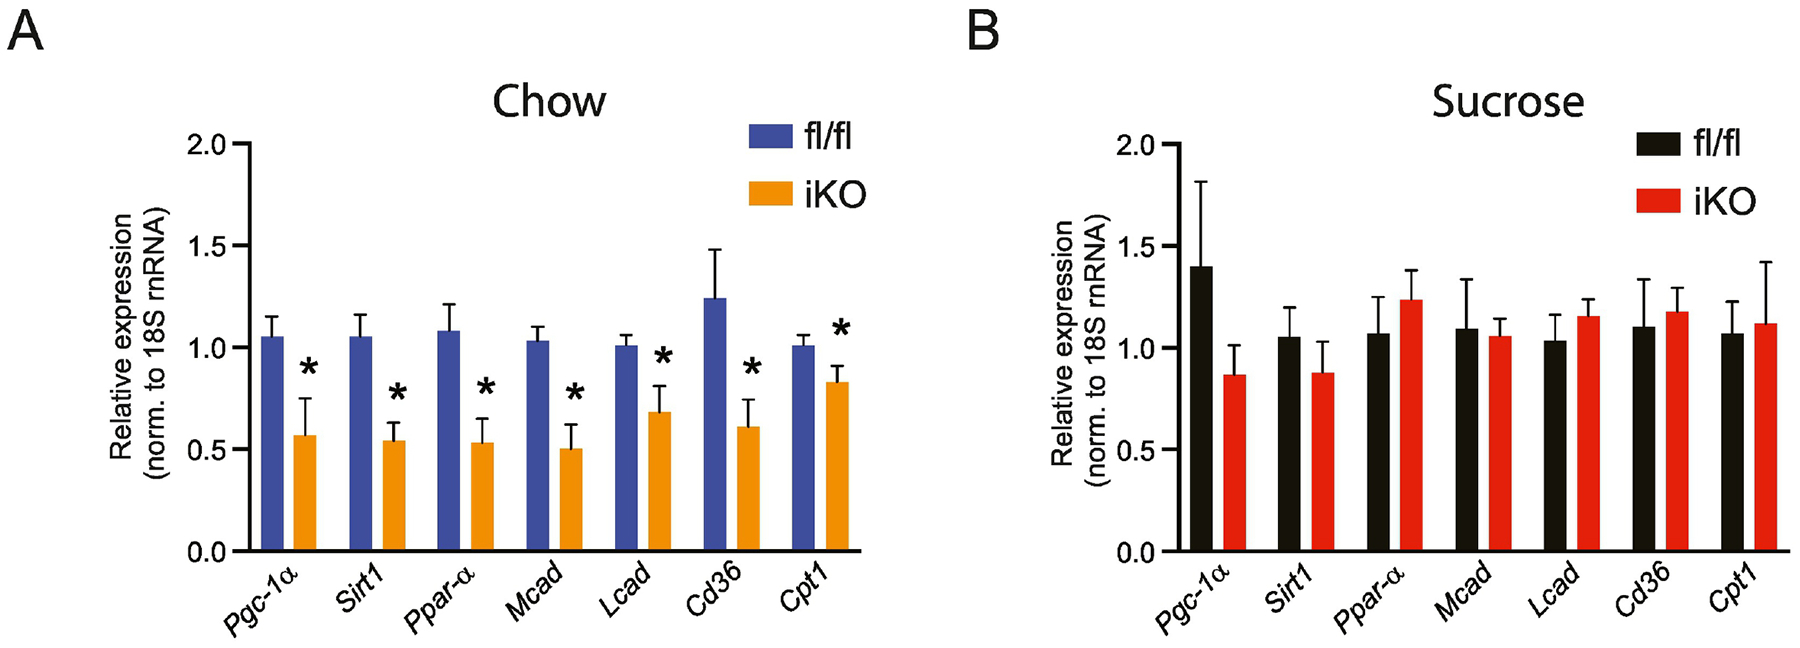
(A,B) Gene expression of Pgc1α-Sirt1 and target genes in chow-fed and sucrose-fed mice. n=7–8. Averages ± SEM. *p<0.05 vs fl/fl
4. Discussion
We report here for the first time the spatial and nutritional regulation of SCD1 in the intestine. Similar to a lipogenic organ such as the liver, intestinal SCD1 is acutely upregulated in response to a high-glycemic sucrose-enriched diet. Interestingly, both basal expression and diet-induced upregulation of SCD1 is most apparent in the distal regions of the small intestine and in the colon. Comprehensive targeted lipidomic analyses also reveal that deletion of SCD1 in the intestine significantly alters lipid content and desaturation ratios not only within the intestine, but also in plasma and liver. These changes are particularly evident in the post-prandial state of chow-fed mice, when dietary fat is present, and less so in mice refed a high-sucrose diet, when hepatic lipid production dominates. These differences speak to the relative importance of intestinal SCD1 in modulating the lipidomic response to various nutritional challenges. Further, the greatest reductions in lipid content were observed in the distal intestines of chow-fed iKO mice, corresponding with the higher expression of SCD1 in this region of the intestine.
Many other proteins that regulate lipid metabolism, including Fatty Acid Synthase (FAS), DGAT, MGAT, and Fatty Acid Binding Protein (FABP), are highly enriched in the proximal small intestine, where the bulk of lipid digestion and absorption occurs (24,27,43–48). In contrast, SCD1 is most highly expressed in the distal small intestine. The greater expression of SCD1 in the ileum is suggestive of potential roles for SCD1 in cell types that may be enriched in these regions of the small intestine. Enteroendocrine cells such as L-cells are known to be concentrated in the ileum (49–51) and are known to respond to intestinal fatty acids of dietary and microbial origin by releasing various compounds that have paracrine and endocrine effects (52,53). While these cells constitute less than 1% of intestinal cells, they represent an important endocrine “organ” and produce over twenty hormones (51,54,55). One of the best studied among these is the incretin hormone GLP-1, secreted by L-cells largely resident in the ileum, which has been shown to regulate diverse processes, including glucose and lipid metabolism, inflammation, and appetite (54,56). Interestingly, one of the most potent stimuli for secretion of the incretin glucagon-like peptide-1 (GLP-1) from L-cells is oleic acid (57–59), a product of SCD1. While stimulation of L-cells by oleate has been examined in vitro, any potential role for SCD activity or MUFAs endogenously synthesized within L-cells has not been explored.
SCD1 expression is increased in several tumor types and correlates with tumor growth and malignancy, notably in colorectal cancers (12,13,60). Concomitantly, high-glycemic diets have been reported to increase incidence of colorectal tumors. Conversely, adherence to a low-glycemic diet is associated with reduced incidence of colorectal cancers (61–64). Interestingly, we observed that SCD1 is acutely stimulated by a high-glycemic sucrose diet in both the small intestine and colon. These data warrant further investigation into a potential role for intestinal SCD1 and its nutritional regulation in modulating risk for GI cancers. Prevalence of colorectal tumors is also associated with the presence of higher levels of inflammation in the colon. A recent report indicated that intestinal SCD1 deficiency combined with long-term dietary oleate restriction, increased intestinal ileal inflammatory gene expression (65). We did not observe any induction of pro-inflammatory genes in ileum of mice fed the sucrose diet, which was also severely restricted in oleate (Burchat and Sampath, unpublished), possibly due to the short duration of sucrose feeding in this study. However, metabolic stress induced by consuming a longer term high-glycemic diet may clarify a role for SCD1 in modulating intestinal inflammation and consequently, risk for GI tumors.
A novel and significant finding revealed by our comprehensive lipidomics analyses was that of consistent reductions in levels of myristoleic acid and the 14:1/14:0 ratio in iKO mice. Indeed, this ratio was reduced across lipid species in the livers of iKO mice (Figure 10F) and greatly reduced in the plasma DAG of iKO animals (Figure 9F). Given the lack of changes in SCD1 expression in livers of chow-fed iKO mice (Figure 2D, E), we hypothesize that the reductions in both plasma and hepatic 14:1 levels are a result of decreased desaturation of 14:0 in the enterocytes of iKO mice. Myristoleic acid is an understudied fatty acid with very little known regarding its production or biological activity. Lipid analyses of the same batch of chow and high-sucrose diets used for these studies indicate that the chow diet contains almost 17 mg myristate (14:0) per 100 g of diet but virtually no myristoleate. The high-sucrose diet, conversely, contains only trace amounts of either fatty acid (Supplementary Table 7). Thus, myristoleate in the intestines, liver, and plasma are likely directly generated by SCD1 in the enterocyte, explaining its consistent reduction in iKO mice fed a chow diet and lack of apparent changes in sucrose-fed iKO animals. A recent report indicated that gut-derived myristoleic acid may mediate crosstalk between the intestine and brown adipose tissue (66). Whether similar interorgan crosstalk between the gut and other tissues, such as the liver, may be mediated by myristoleic acid is not yet known. In this regard, it is intriguing that hepatic expression of Sirt1-Pgc1α and fatty acid oxidation genes was downregulated in livers of mice lacking intestinal SCD1 when they were fed a chow, but not a high-sucrose diet. These changes are directly correlated to alterations or lack thereof in plasma and hepatic 14:1 levels. Therefore, it is tempting to speculate that intestinally-derived myristoleate may play a role in mediating such gut-liver crosstalk, and studies to further test this hypothesis are ongoing.
Atherosclerosis is still a leading cause of death globally. Post-prandial lipemia is a key risk factor for atherosclerosis and heart disease (67–75). We observed that deletion of intestinal SCD1 significantly lowered plasma lipids in the post-prandial state, including reductions in plasma TAGs and cholesterol. These results suggest that modulation of intestinal SCD1 may be of therapeutic benefit in the management of postprandial lipemia. Additional investigations aimed at determining effects of intestinal SCD1 inhibition in management of postprandial lipemia in the context of Western dietary patterns is therefore warranted.
Supplementary Material
Highlights.
Expression of the lipogenic enzyme SCD1 is enriched in the mouse distal small intestine and colon.
Disruptions to intestinal SCD1 decrease intestinal lipids and expression of intestinal lipogenic genes.
Plasma triacylglycerols, diacylglycerols, cholesterol esters and free cholesterol are decreased in mice lacking intestinal SCD1.
Disruptions to intestinal SCD1 lead to decreased hepatic myristoleic acid content, along with decreased activation of the SIRT1-PGC-1α axis.
Acknowledgments
We thank Dr. Laurie Joseph for assistance with IHC measurements and Dr. Priyanka Sharma, Hong Ye, Deeptha Kumaraswamy, Camille Duchamp and other members of the Sampath Lab for technical and editorial assistance on the project. The graphical abstract was created with BioRender.com. This work was funded by a Rutgers Center for Lipid Research Pilot Funding to NAB, NIH grant R01DK118093 to JMN, and American Heart Association grant 20CDA35310305, NIH grant R01DK126963, and a Rutgers IFNH Seed Grant to HS.
Footnotes
Publisher's Disclaimer: This is a PDF file of an unedited manuscript that has been accepted for publication. As a service to our customers we are providing this early version of the manuscript. The manuscript will undergo copyediting, typesetting, and review of the resulting proof before it is published in its final form. Please note that during the production process errors may be discovered which could affect the content, and all legal disclaimers that apply to the journal pertain.
Author Credit Statement
Natalie Burchat: Conceptualization, Data curation, Formal analysis, Investigation, Visualization, Writing - original draft, Writing - review & editing; Tasleenpal Akal: Conceptualization, Data curation, Formal analysis; James M. Ntambi: Resources; Nirali Trivedi: Formal analysis, Investigation; Ranjita Suresh: Formal analysis, Investigation; Harini Sampath: Data curation, Formal analysis, Funding acquisition, Project administration, Supervision, Visualization, Roles/Writing - original draft, Writing - review & editing.
Declaration of interests
The authors declare that they have no known competing financial interests or personal relationships that could have appeared to influence the work reported in this paper.
References
- 1.Dobrzyn A, Ntambi JM. The role of stearoyl-CoA desaturase in the control of metabolism. Prostaglandins, leukotrienes, and essential fatty acids. 2005;73(1):35–41. [DOI] [PubMed] [Google Scholar]
- 2.Man WC, Miyazaki M, Chu K, Ntambi JM. Membrane topology of mouse stearoyl-CoA desaturase 1. The Journal of biological chemistry. 2006;281(2):1251–1260. [DOI] [PubMed] [Google Scholar]
- 3.Sampath H, Ntambi JM. Stearoyl-coenzyme A desaturase 1, sterol regulatory element binding protein-1c and peroxisome proliferator-activated receptor-alpha: independent and interactive roles in the regulation of lipid metabolism. Current opinion in clinical nutrition and metabolic care. 2006;9(2):84–88. [DOI] [PubMed] [Google Scholar]
- 4.Enoch HG, Catala A, Strittmatter P. Mechanism of rat liver microsomal stearyl-CoA desaturase. Studies of the substrate specificity, enzyme-substrate interactions, and the function of lipid. The Journal of biological chemistry. 1976;251(16):5095–5103. [PubMed] [Google Scholar]
- 5.Green CD, Ozguden-Akkoc CG, Wang Y, Jump DB, Olson LK. Role of fatty acid elongases in determination of de novo synthesized monounsaturated fatty acid species. J Lipid Res. 2010;51(7):1871–1877. [DOI] [PMC free article] [PubMed] [Google Scholar]
- 6.Holloway PW, Wakil SJ. Synthesis of Fatty Acids in Animal Tissues. Ii. The Occurrence and Biosynthesis of Cis-Vaccenic Acid. The Journal of biological chemistry. 1964;239:2489–2495. [PubMed] [Google Scholar]
- 7.Miyazaki M, Bruggink SM, Ntambi JM. Identification of mouse palmitoyl-coenzyme A Delta9-desaturase. J Lipid Res. 2006;47(4):700–704. [DOI] [PubMed] [Google Scholar]
- 8.Moon YA, Ochoa CR, Mitsche MA, Hammer RE, Horton JD. Deletion of ELOVL6 blocks the synthesis of oleic acid but does not prevent the development of fatty liver or insulin resistance. J Lipid Res. 2014;55(12):2597–2605. [DOI] [PMC free article] [PubMed] [Google Scholar]
- 9.Igal RA. Stearoyl-CoA desaturase-1: a novel key player in the mechanisms of cell proliferation, programmed cell death and transformation to cancer. Carcinogenesis. 2010;31(9):1509–1515. [DOI] [PubMed] [Google Scholar]
- 10.Miyazaki M, Sampath H, Liu X, et al. Stearoyl-CoA desaturase-1 deficiency attenuates obesity and insulin resistance in leptin-resistant obese mice. Biochemical and biophysical research communications. 2009;380(4):818–822. [DOI] [PMC free article] [PubMed] [Google Scholar]
- 11.Popeijus HE, Saris WH, Mensink RP. Role of stearoyl-CoA desaturases in obesity and the metabolic syndrome. Int J Obes (Lond). 2008;32(7):1076–1082. [DOI] [PubMed] [Google Scholar]
- 12.Ran H, Zhu Y, Deng R, et al. Stearoyl-CoA desaturase-1 promotes colorectal cancer metastasis in response to glucose by suppressing PTEN. J Exp Clin Cancer Res. 2018;37(1):54. [DOI] [PMC free article] [PubMed] [Google Scholar]
- 13.Tracz-Gaszewska Z, Dobrzyn P. Stearoyl-CoA Desaturase 1 as a Therapeutic Target for the Treatment of Cancer. Cancers. 2019;11(7). [DOI] [PMC free article] [PubMed] [Google Scholar]
- 14.Liu X, Miyazaki M, Flowers MT, et al. Loss of Stearoyl-CoA desaturase-1 attenuates adipocyte inflammation: effects of adipocyte-derived oleate. Arteriosclerosis, thrombosis, and vascular biology. 2010;30(1):31–38. [DOI] [PMC free article] [PubMed] [Google Scholar]
- 15.Miyazaki M, Flowers MT, Sampath H, et al. Hepatic stearoyl-CoA desaturase-1 deficiency protects mice from carbohydrate-induced adiposity and hepatic steatosis. Cell metabolism. 2007;6(6):484–496. [DOI] [PubMed] [Google Scholar]
- 16.Miyazaki M, Kim YC, Gray-Keller MP, Attie AD, Ntambi JM. The biosynthesis of hepatic cholesterol esters and triacylglycerols is impaired in mice with a disruption of the gene for stearoyl-CoA desaturase 1. The Journal of biological chemistry. 2000;275(39):30132–30138. [DOI] [PubMed] [Google Scholar]
- 17.Ntambi JM, Miyazaki M, Stoehr JP, et al. Loss of stearoyl-CoA desaturase-1 function protects mice against adiposity. Proceedings of the National Academy of Sciences of the United States of America. 2002;99(17):11482–11486. [DOI] [PMC free article] [PubMed] [Google Scholar]
- 18.Sampath H, Flowers MT, Liu X, et al. Skin-specific deletion of stearoyl-CoA desaturase-1 alters skin lipid composition and protects mice from high fat diet-induced obesity. The Journal of biological chemistry. 2009;284(30):19961–19973. [DOI] [PMC free article] [PubMed] [Google Scholar]
- 19.Zheng Y, Eilertsen KJ, Ge L, et al. Scd1 is expressed in sebaceous glands and is disrupted in the asebia mouse. Nat Genet. 1999;23(3):268–270. [DOI] [PubMed] [Google Scholar]
- 20.Dumas SN, Guo CA, Kim JK, Friedline RH, Ntambi JM. Interleukin-6 derived from cutaneous deficiency of stearoyl-CoA desaturase- 1 may mediate metabolic organ crosstalk among skin, adipose tissue and liver. Biochemical and biophysical research communications. 2019;508(1):87–91. [DOI] [PMC free article] [PubMed] [Google Scholar]
- 21.Dumas SN, Ntambi JM. Increased hydrophilic plasma bile acids are correlated with protection from adiposity in skin-specific stearoyl-CoA desaturase-1 deficient mice. PLoS One. 2018;13(7):e0199682. [DOI] [PMC free article] [PubMed] [Google Scholar]
- 22.Hussain MM. Intestinal lipid absorption and lipoprotein formation. Curr Opin Lipidol. 2014;25(3):200–206. [DOI] [PMC free article] [PubMed] [Google Scholar]
- 23.Ko CW, Qu J, Black DD, Tso P. Regulation of intestinal lipid metabolism: current concepts and relevance to disease. Nat Rev Gastroenterol Hepatol. 2020;17(3):169–183. [DOI] [PubMed] [Google Scholar]
- 24.Yen CE, Nelson DW, Yen MI. Intestinal triacylglycerol synthesis in fat absorption and systemic energy metabolism. J Lipid Res. 2015;56(3):489–501. [DOI] [PMC free article] [PubMed] [Google Scholar]
- 25.Buhman KK, Smith SJ, Stone SJ, et al. DGAT1 is not essential for intestinal triacylglycerol absorption or chylomicron synthesis. The Journal of biological chemistry. 2002;277(28):25474–25479. [DOI] [PubMed] [Google Scholar]
- 26.Hung YH, Carreiro AL, Buhman KK. Dgat1 and Dgat2 regulate enterocyte triacylglycerol distribution and alter proteins associated with cytoplasmic lipid droplets in response to dietary fat. Biochim Biophys Acta Mol Cell Biol Lipids. 2017;1862(6):600–614. [DOI] [PMC free article] [PubMed] [Google Scholar]
- 27.Lee B, Fast AM, Zhu J, Cheng JX, Buhman KK. Intestine-specific expression of acyl CoA:diacylglycerol acyltransferase 1 reverses resistance to diet-induced hepatic steatosis and obesity in Dgat1−/− mice. J Lipid Res. 2010;51(7):1770–1780. [DOI] [PMC free article] [PubMed] [Google Scholar]
- 28.Nelson DW, Gao Y, Yen MI, Yen CL. Intestine-specific deletion of acyl-CoA:monoacylglycerol acyltransferase (MGAT) 2 protects mice from diet-induced obesity and glucose intolerance. The Journal of biological chemistry. 2014;289(25):17338–17349. [DOI] [PMC free article] [PubMed] [Google Scholar]
- 29.Tsuchida T, Fukuda S, Aoyama H, et al. MGAT2 deficiency ameliorates high-fat diet-induced obesity and insulin resistance by inhibiting intestinal fat absorption in mice. Lipids Health Dis. 2012;11:75. [DOI] [PMC free article] [PubMed] [Google Scholar]
- 30.Uchida A, Slipchenko MN, Eustaquio T, Leary JF, Cheng JX, Buhman KK. Intestinal acyl-CoA:diacylglycerol acyltransferase 2 overexpression enhances postprandial triglyceridemic response and exacerbates high fat diet-induced hepatic triacylglycerol storage. Biochim Biophys Acta. 2013;1831(8):1377–1385. [DOI] [PMC free article] [PubMed] [Google Scholar]
- 31.Vujic N, Korbelius M, Sachdev V, et al. Intestine-specific DGAT1 deficiency improves atherosclerosis in apolipoprotein E knockout mice by reducing systemic cholesterol burden. Atherosclerosis. 2020;310:26–36. [DOI] [PMC free article] [PubMed] [Google Scholar]
- 32.Zhang J, Kelley KL, Marshall SM, et al. Tissue-specific knockouts of ACAT2 reveal that intestinal depletion is sufficient to prevent diet-induced cholesterol accumulation in the liver and blood. J Lipid Res. 2012;53(6):1144–1152. [DOI] [PMC free article] [PubMed] [Google Scholar]
- 33.Shi Y, Cheng D. Beyond triglyceride synthesis: the dynamic functional roles of MGAT and DGAT enzymes in energy metabolism. Am J Physiol Endocrinol Metab. 2009;297(1):E10–18. [DOI] [PMC free article] [PubMed] [Google Scholar]
- 34.Yang M, Nickels JT. MOGAT2: A New Therapeutic Target for Metabolic Syndrome. Diseases. 2015;3(3):176–192. [DOI] [PMC free article] [PubMed] [Google Scholar]
- 35.Zambre VP, Khamkar SM, Gavhane DD, et al. Patent landscape for discovery of promising acyltransferase DGAT and MGAT inhibitors. Expert Opin Ther Pat. 2020;30(11):873–896. [DOI] [PubMed] [Google Scholar]
- 36.Livak KJ, Schmittgen TD. Analysis of relative gene expression data using real-time quantitative PCR and the 2(-Delta Delta C(T)) Method. Methods. 2001;25(4):402–408. [DOI] [PubMed] [Google Scholar]
- 37.Folch J, Lees M, Sloane Stanley GH. A simple method for the isolation and purification of total lipides from animal tissues. The Journal of biological chemistry. 1957;226(1):497–509. [PubMed] [Google Scholar]
- 38.Sharma P, Wu G, Kumaraswamy D, et al. Sex-Dependent Effects of 7,8-Dihydroxyflavone on Metabolic Health Are Associated with Alterations in the Host Gut Microbiome. Nutrients. 2021;13(2). [DOI] [PMC free article] [PubMed] [Google Scholar]
- 39.Gajda AM, Zhou YX, Agellon LB, et al. Direct comparison of mice null for liver or intestinal fatty acid-binding proteins reveals highly divergent phenotypic responses to high fat feeding. The Journal of biological chemistry. 2013;288(42):30330–30344. [DOI] [PMC free article] [PubMed] [Google Scholar]
- 40.Rogowski MP, Flowers MT, Stamatikos AD, Ntambi JM, Paton CM. SCD1 activity in muscle increases triglyceride PUFA content, exercise capacity, and PPARdelta expression in mice. J Lipid Res. 2013;54(10):2636–2646. [DOI] [PMC free article] [PubMed] [Google Scholar]
- 41.Sampath H, Miyazaki M, Dobrzyn A, Ntambi JM. Stearoyl-CoA desaturase-1 mediates the pro-lipogenic effects of dietary saturated fat. The Journal of biological chemistry. 2007;282(4):2483–2493. [DOI] [PubMed] [Google Scholar]
- 42.Najt CP, Khan SA, Heden TD, et al. Lipid Droplet-Derived Monounsaturated Fatty Acids Traffic via PLIN5 to Allosterically Activate SIRT1. Mol Cell. 2020;77(4):810–824 e818. [DOI] [PMC free article] [PubMed] [Google Scholar]
- 43.Agellon LB, Toth MJ, Thomson AB. Intracellular lipid binding proteins of the small intestine. Mol Cell Biochem. 2002;239(1–2):79–82. [PubMed] [Google Scholar]
- 44.Chen M, Yang Y, Braunstein E, Georgeson KE, Harmon CM. Gut expression and regulation of FAT/CD36: possible role in fatty acid transport in rat enterocytes. Am J Physiol Endocrinol Metab. 2001;281(5):E916–923. [DOI] [PubMed] [Google Scholar]
- 45.Gao Y, Nelson DW, Banh T, Yen MI, Yen CE. Intestine-specific expression of MOGAT2 partially restores metabolic efficiency in Mogat2-deficient mice. J Lipid Res. 2013;54(6):1644–1652. [DOI] [PMC free article] [PubMed] [Google Scholar]
- 46.Iqbal J, Hussain MM. Intestinal lipid absorption. Am J Physiol Endocrinol Metab. 2009;296(6):E1183–1194. [DOI] [PMC free article] [PubMed] [Google Scholar]
- 47.Kushwaha RS, Rosillo A, Rodriguez R, McGill HC Jr. Expression levels of ACAT1 and ACAT2 genes in the liver and intestine of baboons with high and low lipemic responses to dietary lipids. J Nutr Biochem. 2005;16(12):714–721. [DOI] [PubMed] [Google Scholar]
- 48.Yen CL, Stone SJ, Koliwad S, Harris C, Farese RV Jr. Thematic review series: glycerolipids. DGAT enzymes and triacylglycerol biosynthesis. J Lipid Res. 2008;49(11):2283–2301. [DOI] [PMC free article] [PubMed] [Google Scholar]
- 49.Latorre R, Sternini C, De Giorgio R, Greenwood-Van Meerveld B. Enteroendocrine cells: a review of their role in brain-gut communication. Neurogastroenterol Motil. 2016;28(5):620–630. [DOI] [PMC free article] [PubMed] [Google Scholar]
- 50.Gribble FM, Reimann F. Function and mechanisms of enteroendocrine cells and gut hormones in metabolism. Nat Rev Endocrinol. 2019;15(4):226–237. [DOI] [PubMed] [Google Scholar]
- 51.Gribble FM, Reimann F. Enteroendocrine Cells: Chemosensors in the Intestinal Epithelium. Annu Rev Physiol. 2016;78:277–299. [DOI] [PubMed] [Google Scholar]
- 52.McCauley HA. Enteroendocrine Regulation of Nutrient Absorption. J Nutr. 2020;150(1):10–21. [DOI] [PubMed] [Google Scholar]
- 53.Meijerink J The Intestinal Fatty Acid-Enteroendocrine Interplay, Emerging Roles for Olfactory Signaling and Serotonin Conjugates. Molecules. 2021;26(5). [DOI] [PMC free article] [PubMed] [Google Scholar]
- 54.Campbell JE, Drucker DJ. Pharmacology, physiology, and mechanisms of incretin hormone action. Cell metabolism. 2013;17(6):819–837. [DOI] [PubMed] [Google Scholar]
- 55.Psichas A, Reimann F, Gribble FM. Gut chemosensing mechanisms. J Clin Invest. 2015;125(3):908–917. [DOI] [PMC free article] [PubMed] [Google Scholar]
- 56.Drucker DJ. Mechanisms of Action and Therapeutic Application of Glucagon-like Peptide-1. Cell metabolism. 2018;27(4):740–756. [DOI] [PubMed] [Google Scholar]
- 57.Clara R, Langhans W, Mansouri A. Oleic acid stimulates glucagon-like peptide-1 release from enteroendocrine cells by modulating cell respiration and glycolysis. Metabolism. 2016;65(3):8–17. [DOI] [PubMed] [Google Scholar]
- 58.Iakoubov R, Ahmed A, Lauffer LM, Bazinet RP, Brubaker PL. Essential role for protein kinase Czeta in oleic acid-induced glucagon-like peptide-1 secretion in vivo in the rat. Endocrinology. 2011;152(4):1244–1252. [DOI] [PubMed] [Google Scholar]
- 59.Poreba MA, Dong CX, Li SK, Stahl A, Miner JH, Brubaker PL. Role of fatty acid transport protein 4 in oleic acid-induced glucagon-like peptide-1 secretion from murine intestinal L cells. Am J Physiol Endocrinol Metab. 2012;303(7):E899–907. [DOI] [PMC free article] [PubMed] [Google Scholar]
- 60.Chen L, Ren J, Yang L, et al. Stearoyl-CoA desaturase-1 mediated cell apoptosis in colorectal cancer by promoting ceramide synthesis. Sci Rep. 2016;6:19665. [DOI] [PMC free article] [PubMed] [Google Scholar]
- 61.Choi Y, Giovannucci E, Lee JE. Glycaemic index and glycaemic load in relation to risk of diabetes-related cancers: a meta-analysis. Br J Nutr. 2012;108(11):1934–1947. [DOI] [PubMed] [Google Scholar]
- 62.Galeone C, Pelucchi C, La Vecchia C. Added sugar, glycemic index and load in colon cancer risk. Current opinion in clinical nutrition and metabolic care. 2012;15(4):368–373. [DOI] [PubMed] [Google Scholar]
- 63.Sieri S, Agnoli C, Pala V, et al. Dietary glycemic index, glycemic load, and cancer risk: results from the EPIC-Italy study. Sci Rep. 2017;7(1):9757. [DOI] [PMC free article] [PubMed] [Google Scholar]
- 64.Turati F, Galeone C, Gandini S, et al. High glycemic index and glycemic load are associated with moderately increased cancer risk. Mol Nutr Food Res. 2015;59(7):1384–1394. [DOI] [PubMed] [Google Scholar]
- 65.Ducheix S, Peres C, Hardfeldt J, et al. Deletion of Stearoyl-CoA Desaturase-1 From the Intestinal Epithelium Promotes Inflammation and Tumorigenesis, Reversed by Dietary Oleate. Gastroenterology. 2018;155(5):1524–1538 e1529. [DOI] [PubMed] [Google Scholar]
- 66.Quan LH, Zhang C, Dong M, et al. Myristoleic acid produced by enterococci reduces obesity through brown adipose tissue activation. Gut. 2020;69(7):1239–1247. [DOI] [PubMed] [Google Scholar]
- 67.Ansar S, Koska J, Reaven PD. Postprandial hyperlipidemia, endothelial dysfunction and cardiovascular risk: focus on incretins. Cardiovasc Diabetol. 2011;10:61. [DOI] [PMC free article] [PubMed] [Google Scholar]
- 68.Kolovou GD, Watts GF, Mikhailidis DP, et al. Postprandial Hypertriglyceridaemia Revisited in the Era of Non-Fasting Lipid Profile Testing: A 2019 Expert Panel Statement, Narrative Review. Curr Vasc Pharmacol. 2019;17(5):515–537. [DOI] [PubMed] [Google Scholar]
- 69.Lindman AS, Veierod MB, Tverdal A, Pedersen JI, Selmer R. Nonfasting triglycerides and risk of cardiovascular death in men and women from the Norwegian Counties Study. Eur J Epidemiol. 2010;25(11):789–798. [DOI] [PMC free article] [PubMed] [Google Scholar]
- 70.Nordestgaard BG, Benn M, Schnohr P, Tybjaerg-Hansen A. Nonfasting triglycerides and risk of myocardial infarction, ischemic heart disease, and death in men and women. JAMA. 2007;298(3):299–308. [DOI] [PubMed] [Google Scholar]
- 71.Perez-Martinez P, Alcala-Diaz JF, Kabagambe EK, et al. Assessment of postprandial triglycerides in clinical practice: Validation in a general population and coronary heart disease patients. J Clin Lipidol. 2016;10(5):1163–1171. [DOI] [PMC free article] [PubMed] [Google Scholar]
- 72.Pirillo A, Norata GD, Catapano AL. Postprandial lipemia as a cardiometabolic risk factor. Curr Med Res Opin. 2014;30(8):1489–1503. [DOI] [PubMed] [Google Scholar]
- 73.Rahman F, Blumenthal RS, Jones SR, Martin SS, Gluckman TJ, Whelton SP. Fasting or Non-fasting Lipids for Atherosclerotic Cardiovascular Disease Risk Assessment and Treatment? Curr Atheroscler Rep. 2018;20(3):14. [DOI] [PubMed] [Google Scholar]
- 74.Stampfer MJ, Krauss RM, Ma J, et al. A prospective study of triglyceride level, low-density lipoprotein particle diameter, and risk of myocardial infarction. JAMA. 1996;276(11):882–888. [PubMed] [Google Scholar]
- 75.Zhao Y, Liu L, Yang S, et al. Mechanisms of Atherosclerosis Induced by Postprandial Lipemia. Front Cardiovasc Med. 2021;8:636947. [DOI] [PMC free article] [PubMed] [Google Scholar]
- 76.Nagahisa T, Yamaguchi S, Kosugi S, et al. Intestinal Epithelial NAD+ Biosynthesis Regulates GLP-1 Production and Postprandial Glucose Metabolism in Mice. Endocrinology. 2022;163(4). [DOI] [PubMed] [Google Scholar]
Associated Data
This section collects any data citations, data availability statements, or supplementary materials included in this article.


