

Abstract
Interventions involving dietary fibers are known to benefit host health. A leading contribution of gut microbiota is commonly recognized with production of short chain fatty acids (SCFA) suspected to play a key role. However, the detailed mechanisms are largely unknown, and apart from a well-described bifidogenic effect of some fibers, results for other bacterial taxa are often incongruent between studies. We performed pooled analyses of 16S rRNA gene data derived from intervention studies (n = 14) based on three fibers, namely, inulin-type fructans (ITF), resistant starch (RS), and arabinoxylan-oligosaccharides (AXOS), harmonizing the bioinformatics workflow to reveal taxa stimulated by those substrates, specifically focusing on the SCFA-production potential. The results showed an increased butyrate production potential after ITF (p < 0.05) and RS (p < 0.1) treatment via an increase in bacteria exhibiting the enzyme butyryl-CoA:acetate CoA-transferase (but) that was governed by Faecalibacterium, Anaerostipes (ITF) and Agathobacter (RS) respectively. AXOS did not promote an increase in butyrate producers, nor were pathways linked to propionate production stimulated by any intervention. A bifidogenic effect was observed for AXOS and ITF, which was only partly associated with the behavior of but-containing bacteria and largely represented a separate response. Low and high Ruminococcus abundances pre-intervention for ITF and RS, respectively, promoted an increase in but-containing taxa (p < 0.05) upon interventions, whereas initial Prevotella abundance was negatively associated with responses of butyrate producers for both fibers. Collectively, our data demonstrate targeted stimulation of specific taxa by individual fibers increasing the potential to synthesize butyrate, where gut microbiota composition pre-intervention strongly controlled outcomes.
Subject terms: Microbiome, Bacteria
Introduction
Numerous studies have reported the role of gut microbiota in host health and disease, and developing strategies to manipulate dysbiosed microbiota toward a beneficial state is a collective research effort1. The focus often lies on the application of dietary fibers, which are non-digestible carbohydrates of more than three monomers that show beneficial physiological effects2. For a subset of fibers, the so-called prebiotics, a microbial role was specifically included in their definition as they are “selectively utilized by host microorganisms conferring a health benefit”3,4. The most well-known prebiotics are inulin-type fructans (ITF), polymers of fructose linked by ß-2,1 bonds with a terminal glucose, where a bifidogenic effect, that is selective growth of Bifidobacteria spp., has been demonstrated several decades ago5. While initial procedures targeting bacteria during intervention studies were based on culturing and selective molecular methods, broad-scale applications of next-generation sequencing techniques enabled comprehensive profiling of gut microbiota composition, providing insights on a community-wide level. Consequently, next to Bifidobacteria also other members of the microbiota have been found to be targeted by ITF and other fibers in many studies, with largely incongruent results (recently reviewed by Swanson and colleagues that investigated dietary intervention outcomes from studies based on various fibers and found that apart from the bifidogenic effect, results were highly variable between studies and no assertive conclusions were drawn for other taxa)2.
There is a broad consensus that dietary fibers act, at least partly, by (selectively) stimulating microbiota growth and activity2. However, the detailed mechanisms underlying the associated health benefits are only partially understood6. In addition to differences in study design, subject-specific responses, primarily due to distinct microbiota compositions before intervention, have been emphasized to contribute to heterogeneity7,8. Given the discrepancies between studies, it is largely unknown which bacterial taxa are selectively stimulated by what substance. In this context, it should be noted that microbe – host interactions are usually not determined by individual taxa, but are governed by microbial functions, where functional redundancy plays a key role9. For instance, short chain fatty acids (SCFA) that are microbiota-derived fermentation end products and have been ascribed to gut homeostasis and host health, making their synthesis a primary goal for dietary interventions1,10. The main SCFA are acetate, butyrate and propionate; the former is produced by the vast majority of gut bacteria, whereas butyrate and propionate are only formed by certain members that generally form separate groups11,12. SCFA act on various targets throughout the body and have been shown to ameliorate various diseases13,14. In fact, it is believed that the bifidogenic effect of fiber supplementation is probably not per se causing benefits for the host. Rather, it has been proposed that Bifidobacteria-derived lactate fuels the production of butyrate via cross-feeding mechanisms, promoting beneficial effects15,16.
While in vitro studies and animal models help to unravel the degradation mechanisms of fibers in detail and to reveal particular physiological properties of the host metabolism6, the most relevant data can be derived from human subjects, in particular from dietary intervention studies that focus on the effects of specific fibers2. Intervention studies are complex and can vary in many parameters from the initial design and subject characteristics to methods applied for gut microbiota profiling and bioinformatics procedures as well as subsequent data analysis strategies, all contributing to heterogeneity. While study setups and choices of wet-lab procedures cannot be changed retrospectively, approaches for bioinformatics and data analysis are harmonizable17. The aim of the present study was to perform a pooled analysis of raw 16S rRNA gene sequencing data derived from placebo-controlled intervention studies by applying uniform bioinformatics procedures, thereby reducing overall variability between studies. We focused on interventions based on common substrates, namely, ITFs and resistant starches (RS); studies applying the more recently used arabinoxylan-oligosaccharides (AXOS) were included as well. Next to infer taxa selectively stimulated by those substrates, we were specifically interested in gaining insights into key functions of microbiota, namely, the potential to produce SCFA, by applying our recently developed procedure to predict the abundances of butyrate and propionate forming pathways from 16S rRNA gene sequencing data12.
Results
In total, 14 studies were finally included in our analyses, with n = 7 for ITF, n = 5 for RS, and n = 2 for AXOS (Figure S1). Intervention designs along with other characteristics are shown in Table 18,18–29. For simplicity, studies involving ITF were not stratified according to chain length; per definition, inulin has at least 10 sugar monomers, whereas shorter molecules are termed fructo-oligosaccharides (FOS). All studies that applied RS were analyzed together irrespective of the RS type; interventions with RS derived from different sources in studies C and K were treated as separate studies. Furthermore, intervention designs differed between studies and data were put into a cross-sectional manner for all studies, subsequently comparing the data of the intervention group with those derived from a placebo control group. The bioinformatics workflow was harmonized for all studies, and linear mixed-effect models (lm) that included studies as a random effect (random intercept and random slope; lmer) were applied. All results are expressed as changes of the fiber intervention in comparison to the placebo group. In the main Figures results based on relative response data, that is, values post intervention relative to pre-intervention data (RR) are given, whereas those based on changes in relative abundance (RA) are provided as supplementary information. Results are expressed as the estimate from linear models, representing the mean difference between intervention and placebo groups, along with their 95% confidence intervals given in squared brackets.
Table 1.
Major characteristics of studies included in the pooled analyses
| Acrn | Reference | Prebiotic | Dose [g d-1] | Subjects | Design | Plc | Int period | 16S rRNA |
|---|---|---|---|---|---|---|---|---|
| A | Healey et al.,18 | Inulin (chicory root) | 16 | Healthy adults (n = 20) | Pre vs. plc, cross-over | Mdex | 3 weeks | V3-V4 |
| B | Sloan et al.,19 | FOS | 14 | Healthy adults (n = 37) | Pre vs. plc, parallel | Mdex | 1 week | V3-V4 |
| C | Baxter et al.,20 | Inulin (chicory root) | 20 | Healthy adults (n = 174) | Pre vs. plc, parallel | Asps | 2 weeks | V4 |
| D | Ford et al.,21 | Inulin (chicory root) | 5,6 | Healthy women (n = 26) | Pre vs. plc, cross-over | Mdex | 2 weeks | V4 |
| E | Hiel et al.,22 | Inulin (chicory root) | 16 | Healthy obese adults (n = 106) | Pre vs. plc, parallel | Mdex | 3 months | V5-V6 |
| F | Li et al.,23 | Inulin & FOS | 10 | Patients on dialysis (n = 15) | Pre vs. plc, cross-over | Mdex | 12 weeks | V3-V4 |
| G | Reimer et al.,24 | Inulin (chicory root) | 3 vs. 7 | Healthy adults (n = 25) | Pre vs. plc, cross-over | Whlgr | 4 weeks | V3-V4 |
| C_m, C_p | Baxter et al.,20 | RS (maize, potato) | 20 | Healthy adults (n = 174) | Pre vs. plc, parallel | Asps | 2 weeks | V4 |
| I | Upadhyaya et al.,25 | RS4 | 30% v/v | Patients Metab. Syn. (n = 20) | Pre vs. plc, cross-over | Flour | 12 weeks | V4 |
| J | Maier et al.,26 | RS (maize) | 48 | Patients Insul. Res. (n = 39) | Pre vs. plc, cross-over | L-RS | 2 weeks | V4-V6 |
| K_m, K_p, K_t | Deehan et al.,27 | RS4 (maize, potato, tapioca) | 10, 20, 35, 50 (w-increase) | Healthy adults (n = 40) | Pre vs. plc, parallel | Corn Starch | 4 weeks | V5-V6 |
| L | Kemp et al.,28 | RS2 | 16 | Patients H-dialysis (n = 20) | Pre vs. plc, parallel | Flour | 4 weeks | V4-V5 |
| M | Chung et al.,8 | AXOS | 15 | Healthy adults > 60 (n = 21) | Pre vs. plc, cross-over | Mdex | 10 days | V1-V2 |
| N | Mueller et al.,29 | AXOS | 15 | Healthy adults (n = 48) | Pre vs. plc, parallel | Mdex | 12 weeks | V4 |
For studies C and K, RS derived from different sources were treated separately. Mdex maltodextrin, Asps amylase-accessible corn starch, Whlgr wholegrain, Acrn acronym.
Our focus was on investigating the effect of fibers on the SCFA-producing potential of gut microbiota. Figure 1a provides an overview of the major pathways leading to butyrate and propionate synthesis, along with the main taxa involved. The butyrate synthesizing acetyl-CoA pathway (AcCoA) is fed by carbohydrates and involves many different taxa, mainly Firmicutes. The final step involves two different routes, either via acetate kinase (buk) or via butyryl-CoA:acetate CoA-transferase (but), which requires acetate as a co-substrate. For propionate, two main pathways exist: the succinate (Suc) pathway linked to major members of gut microbiota belonging to Bacteroidetes and some minor contributors of Firmicutes, and the propanediol (Pdiol) pathway, which primarily consists of Firmicutes taxa. The most abundant genera producing primarily acetate (and lactate) as fermentation end products were also included. The relative pathway abundances for all studies before intervention are shown in Figs. 1b and 1c. On average, 31.57% ± 12.41 of bacteria were predicted to exhibit the AcCoA pathway, with 24.17% ± 10.11 and 6.84% ± 6.48 carrying but and buk, respectively. The relative abundances of propionate pathways were 25.42% ± 21.17 (Suc) and 12.15% ± 10.40 (Pdiol). The relative abundances of butyrate pathways were in a similar range for all studies, except for Study B, which showed higher values, whereas those for propionate pathways varied considerably between studies (Supplementary Figure 2).
Fig. 1. Overview of major butyrate- and propionate-forming pathways and main taxa (on genus level) involved.
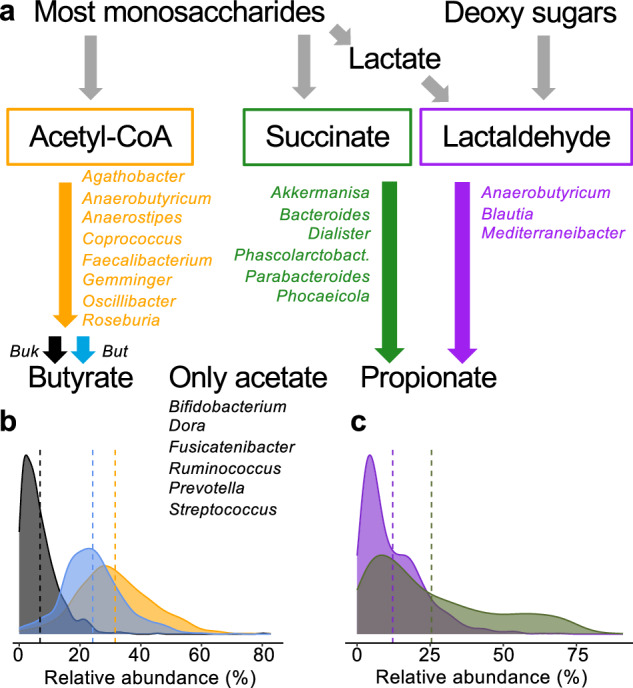
The Acetyl-CoA pathway (orange) represents the main route for butyrate synthesis and is characterized by two distinct terminal enzymes, namely, butyrate kinase (Buk (black)) and butyryl-CoA:acetate CoA-transferase (But (light blue)); propionate is mainly formed via the Succinate pathway (green) and the Propandiol pathway (Pdiol) (panel a). Most abundant taxa that do not form either SCFA are given as well. In panels b and c the relative abundances of predicted pathways pre-intervention (all studies together) are given.
Intervention outcomes for studies applying ITF
Our pooled analysis of the relative response data revealed that ITF treatment did not significantly alter the overall cumulative abundance of AcCoA-exhibiting bacteria (Fig. 2a). However, significant relative increases in bacteria carrying the enzyme but (9.15 [1.56, 16.76]; p < 0.05 (lmer)) were detected compared to the placebo group, which was mainly driven by Anaerostipes (41.19 [22.96, 59.44]; p < 0.01 (lmer)) and Faecalibacterium (16.71 [4.33, 29.09]; p < 0.05 (lmer)), whereas other major taxa from this group were not affected or declined, such as Roseburia (-13.19 [-27.92, 1,53]; p < 0.1 (lmer)) (Fig. 2c). Buk-carrying members declined (-28.20 [-45.84, -10.56]; p < 0.05 (lmer)), including its main contributor, Coprococcus (-28.05 [-44.43, -11.67]; p < 0.05 (lmer)). Analyses of relative abundances gave a similar picture with Faecalibacterium and Anaerostipes significantly increased in individuals treated with ITF compared with placebo (1.42 [0.48, 2.36]; p < 0.01 (lmer), and 1.48 [0.60, 2.36]; p < 0.05 (lmer), respectively), along with cumulative but-carrying taxa that trended to increase (1.58 [0.14, 3.02]; p < 0.1 (lmer)); the overall AcCoA abundance was not affected, whereas buk-exhibiting taxa declined (Supplementary Figure 3a and c). Results from individual datasets largely followed the pooled outcome with a positive response of but-carrying bacteria (except for study B); however, results of individual studies did not reach statistical significance, only pooled analyses allowed to uncover this effect (Fig. 2a and Supplementary Table 1). Butyrate concentrations measured in the original studies followed the same pattern, increasing in all studies and decreasing in study B; however, similar to microbiota data the values did not reach statistical significance in individual studies (Supplementary Table 2). We found that the major drivers Anaerostipes and Faecalibacterium were significantly or trended increased in four and two (RR) and five and three (RA) studies, respectively (Supplementary Table 3). Similar results were not reported in the original studies (Supplementary Table 2). Bacteria exhibiting buk significantly declined in three studies (RR and RA), with Coprococcus declining in four (RR) and three (RA) studies (Supplementary Table 3).
Fig. 2. Intervention outcomes based on inulin-type fructans (ITF).

Panel a shows the response (compared with placebo) based on values relative to pre-intervention (RR) of the main butyrate pathway (orange) along with the two terminal enzymes but (light blue) and buk (black). Responses of the two propionate-forming pathways (Suc: green and Pdiol: violet) are given in panel b. sum: results based on pooled analyses. For detailed characteristics of individual studies see Table 1. Below (panel c) relative abundances pre-intervention and responses relative to pre-intervention (compared with placebo) (d) of major taxa associated with individual pathways are given. The estimated effect sizes from linear mixed effect models including studies as a random effect (lmer) along with their 95% confidence intervals are given. *, +: p < 0.05, p < 0.1 compared with placebo.
In the case of propionate, the Suc pathway abundance was unaffected, and only a minor member, Parabacteroides (RR), responded in decreasing its concentrations (Fig. 2c and Supplementary Figure 3). In contrast, the Pdiol pathway showed a significant negative response to ITF interventions compared with placebo groups in the pooled analysis (-24.91 [-37.65, -12.16]; p < 0.05 (lmer)) (Fig. 2b), which was supported by the individual results of five studies (Supplementary Table 1). Fecal propionate concentrations were found to increase in some studies, but not at significant levels (Supplementary Table 2). For its main associated members overall negative response were detected (Blautia: -17.45 [-31.55, -3.35]; p < 0.1 (lmer), Mediterraneibacter: -27.10 -48.23, -5.97]; p < 0.5 (lmer) (Fig. 2c), which is in agreement with the individual results of several studies (Supplementary Table 3). When considering the relative abundance changes, the Pdiol pathway was not significantly affected, nor were Blautia and Mediterraneibacter (Supplementary Figure 3).
A bifidogenic effect was detected with Bifidobacterium strongly positively responding to ITF treatment, increasing its relative abundance compared with placebo (57.81 [34.56, 81.07]; p < 0.01 (RR; lmer) and 5.19 [2.24, 8.13]; p < 0.01 (RA; lmer)) (Fig. 2c), which was supported by the individual results of five studies (Supplementary Table 3); the same five studies also originally reported an increase of this taxon (Supplementary Table 2). Ruminococcus (-18.42 [-31.77, -5.07]; p < 0.01 (RR; lmer)) declined, whereas other major non-butyrate, non-propionate-synthesizing taxa of gut microbiota did not react differently to ITF compared with the placebo groups.
Pooled analyses (comparing pre- and post-intervention values) on all placebo/control groups, as well as on only those using maltodextrin (n = 7), did not yield significant changes for any pathways and any revealed key taxa (p > 0.1; lmer; data not shown).
Intervention outcomes for studies applying RS
Overall, resistant starches trended to trigger but-containing bacteria compared to placebo (8.70 [-0.97, 18.37]; p < 0.1 (lmer)) (Fig. 3a), which was in line with a significant increase in measured butyrate in several individual studies (Supplementary Table 2). Bacteria carrying buk and the total AcCoA pathway abundance did not change significantly. In contrast to ITF, this increase was primarily governed by Agathobacter (26.20 [2.87, 49.54]; p < 0.1 (lmer)), whereas major players in the case of ITF, namely, Faecalibacterium and Anaerostipes were not affected or declined (-31.95 [-47.14, -16.03]; p < 0.01 (lmer)), respectively (Fig. 3c). The buk-containing Coprococcus also declined (-26.88 [-41.38, -12.38]; p < 0.01 (lmer)). Based on the relative abundance changes, the same trends were observed; however, the significance for the but pathway was slightly above 0.1 (p = 0.101; lmer) (Figure S4a); Agathobacter increased (1.73 [0.31, 3.16]; p < 0.05 (lmer)) (Fig. 3c). Individual datasets supported the pooled results displaying a positive response of but-carrying bacteria to RS (except for studies L and K_p (only RR)); however, apart from study K_m, this did not reach significance (Fig. 3a and Supplementary Figure 4a; Supplementary Table 4). Study I was an exception, where the AcCoA pathway trended to increase (p < 0.1 (RA; lm)), which was triggered by buk-containing bacteria (Fig. 3a), based on relative abundance data (Supplementary Figure 4a). Agathobacter was significantly increased in two (RR) and three (RA) studies (Supplementary Table 5). Two original studies have reported an increase in Eubacterium rectale (now Agathobacter rectale).
Fig. 3. Intervention outcomes based on resistant starches (RS).

Panel a shows the response (compared with placebo) based on values relative to pre-intervention (RR) of the main butyrate pathway (orange) along with the two terminal enzymes but (light blue) and buk (black). Responses of the two propionate-forming pathways (Suc: green and route: violet) are given in panel b. sum: results based on pooled analyses. For study C and K groups treated with starches from different sources (m: maize; p: potato; t; tapioca) were included as separate studies; for detailed characteristics of individual studies see Table 1. Below (panel c) relative abundances pre-intervention and responses relative to pre-intervention (compared with placebo) (d) of major taxa associated with individual pathways are given. The estimated effect sizes from linear mixed effect models including studies as a random effect (lmer) along with their 95% confidence intervals are given. *, +: p < 0.05, p < 0.1 compared with placebo.
In the case of propionate, the Pdiol pathway significantly declined in the analyses based on RR (-23.19 [-39.33, -7.05]; p < 0.05 (lmer); Fig. 3b) and RA (-1.06 [-1.80, -0,32]; p < 0.01 (lmer); Supplementary Figure 4b), which was governed by Blautia (-26.02 [-39.56, -12.49]; p < 0.01 (RR; lmer), -0.73 [-1.26, -0.20]; p < 0.05 (RA; lmer)) (Fig. 3c). The Suc pathway and its main associated taxa were hardly affected (Fig. 3 and Supplementary Figure 4). The fecal propionate concentrations showed a mixed pattern (Supplementary Table 2).
The concentrations of Bifidobacterium increased but did not reach significance (Fig. 3c and Supplementary Figure 4c). None of the original studies have reported an increase in this taxon (Supplementary Table 2). The non-butyrate, non-propionate-synthesizing Dorea (-26.82 [-41.54, -12.09]; p < 0.01 (RR; lmer)) and Streptococcus (-31.47 [-49.26, -13.68]; p < 0.01 (RR; lmer), (-1.06 [-1.88, -0.23]; p < 0.05 (RA; lmer)) declined upon RS intervention compared to placebo (Fig. 3c and Supplementary Figure 4c).
Intervention outcomes for studies applying AXOS
AXOS treatment had no overall effect on the butyrate-producing potential of gut microbiota (Fig. 4 and Supplementary Figure 5). For study M, both the AcCoA pathway (-16.42 [-29.99, -2.85]; p < 0.05 (RR; lm) and -3.63 [-6.60, -0.65]; p < 0.05 (RA; lm)) along with but-carrying taxa (-15.65 [-32.22, 0.92]; p < 0.1 (RR; lm), and -2.60 [-5.18, -0.02]; p < 0.05 (RA; lm)) were significantly decreased (respective RA data of study N trended decreased (AcCoA: -6.73 [-14.06, 0.60]; p < 0.1 (lm), but: -5.42 [-11.42, 0.59]; p < 0.1 (lm)) compared to the control groups (Supplementary Table 6). The relative abundance of Faecalibacterium decreased (-1.71 [-3.44, -0.03]; p < 0.1 (lmer)) (Supplementary Figure 5 and Supplementary Table 7). SCFA measurements in study M suggested a slight, non-significant increase in fecal butyrate levels, whereas the metabolite was unaffected in study N (Supplementary Table 2).
Fig. 4. Intervention outcomes based on arabinoxylan-oligosaccharides (AXOS).

Panel a shows the response (compared with placebo) based on values relative to pre-intervention (RR) of the main butyrate pathway (orange) along with the two terminal enzymes but (light blue) and buk (black). Responses of the two propionate-forming pathways (Suc: green and Pdiol: violet) are given in panel b. sum: results based on pooled analyses. For detailed characteristics of individual studies see Table 1. Below (panel c) relative abundances pre-intervention and responses relative to pre-intervention (compared with placebo) (d) of major taxa associated with individual pathways are given. The estimated effect sizes from linear mixed effect models including studies as a random effect (lmer) along with their 95% confidence intervals are given. *, +: p < 0.05, p < 0.1 compared with placebo.
For propionate, the Pdiol pathway responded negatively in the pooled analysis (-49.96 [-74.15, -25.77]; p < 0.01 (lmer)) and in both individual studies (Fig. 4 and Supplementary Table 6). The two major taxa linked to the pathway also responded significantly (Blautia: -45.19 [-73.23, -17.16], p < 0.01 (lmer); Mediterraneibacter: -35.96 [-63.46, -8.46], p < 0.05 (lmer)) (Fig. 4c; Supplementary Table 7). Based on the pooled analysis, the relative abundance did not change for this pathway or for associated major taxa (Supplementary Figure 5).
AXOS displayed a strong increase in Bifidobacteria which was, however, only significant in RA data (10.96 [4.37, 17.55]; p < 0.05 (lmer)) and was supported by the results of the two individual studies; for study M, the taxon also increased based on RR (Supplementary Table 7). These results were congruent with those of the original studies (Supplementary Table 2). Dorea decreased in the pooled analyses (-59.26 [-87.75, -30.77]; p < 0.01 (RR; lmer)) and in both individual studies (RR and RA).
Bacterial composition pre-intervention influenced intervention outcomes
We investigated whether the bacterial composition pre-intervention influenced the increase in but-containing bacteria. We focused on Prevotella and Ruminococcus which have been reported to play key roles in substrate degradation and represent signature taxa of the so-called enterotypes. Furthermore, associations between the bifidogenic effect and the responses of but-containing taxa upon intervention were analyzed. For ITF, lower Ruminococcus and Prevotella relative abundances pre-intervention triggered a response in but-containing bacteria in stratified analyses (Fig. 5). But-containing taxa significantly increased compared to the controls (17.25 [4.84, 29.66]; p < 0.05 (lmer)) only in the group characterized by initial Ruminococcus abundances below the median (Fig. 5a); stratifications based on quartiles underlined the observed effect. In the case of Prevotella only the group of subjects exhibiting the taxon abundance below 1% pre-intervention responded (11.28 [2.46, 20.09]; p < 0.1 (lmer)) (Fig. 5b). Similar results were obtained for the RA data (Figure S6). The increase in Bifidobacterium correlated with the responses of Anaerobutyricum (only RR), Anaerostipes, and Faecalibacterium (only RR), however, no correlation with the cumulative outcome of but-containing taxa was observed (Table 2).
Fig. 5. Relative abundances of Ruminococcus and Prevotella pre-intervention affecting increase of but-containing bacteria upon ITF and RS treatment.
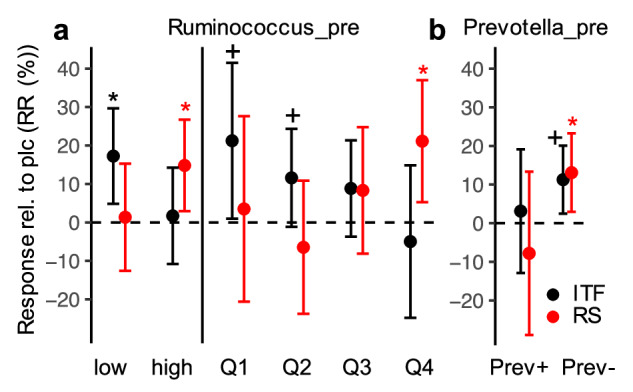
Panel a give results after stratification by Ruminococcus abundance based on median abundances (low: below median, high: above median) and quartile abundances (Q1-Q4), whereas panel b shows outcomes after stratification for Prevotella abundance, where Prev+ refers to samples comprising >= 1% Prevotella relative abundance pre-intervention (Prev- represent all other samples). Results display responses of but-exhibiting bacteria relative to pre-intervention (RR) compared with placebo. Stratifications were performed for each study individually. The estimated effect sizes from linear mixed effect models including studies as a random effect (lmer) along with their 95% confidence intervals are given. *, +: p < 0.05, p < 0.1 compared with placebo.
Table 2.
Correlations between responses of Bifidobacterium and butyrate producers
| Bifidobacterium_ITF | Bifidobacterium_RS | Bifidobacterium_AXOS | |
|---|---|---|---|
| but (RR) | n.s. | n.s. | 0.00 |
| but (RA) | n.s. | 0.08 | 0.00 |
| Agathobacter (RR) | n.s. | n.s. | n.s. |
| Agathobacter (RA) | n.s. | n.s. | n.s. |
| Anaerostipes (RR) | 0.00 | 0.00. | n.s. |
| Anaerostipes (RA) | 0.02 | n.s. | 0.08 |
| Anaerobutyricum (RR) | 0.00 | 0.00 | n.s. |
| Anaerobutyricum (RA) | n.s. | 0.00 | 0.00 |
| Faecalibacterium (RR) | 0.08 | n.s. | 0.10 |
| Faecalibacterium (RA) | n.s. | 0.01 | 0.00 |
Results (p-values based on linear mixed-effect models (lmer)) for cumulative but-containing taxa as well as associated key members revealed in this study are shown. Normal font: positive association; italic font: negative association; n.s. not significant, RR response relative to pre-intervention, RA response based on relative abundance change.
In contrast to ITF, high Ruminococcus relative abundances pre-intervention promoted but-containing bacteria (14.81 [2.92, 26.71]; p < 0.05 (RR; lmer) and 2.44 [-0.10, 4.98]; p < 0.1 (RA; lmer)) upon intervention with RS (Supplementary Figure 5a and Supplementary Figure 6a). In line with ITF, low initial Prevotella abundance was associated with increased responses in this group (13.09 [2.93, 23.26]; p < 0.05 (RR; lmer) and 2.13 [-0.05, 4.32]; p < 0.1 (RA; lmer)). While responses of Bifidobacterium were correlated with those of Anaerostipes (only RR) and Anaerobutyricum they trended to be negatively associated with those of Faecalibacterium and overall but-containing taxa (both only RA) (Table 2). In the case of AXOS, the bifidogenic effect was negatively associated with the butyrate production potential and associated taxa.
Discussion
Our pooled analyses demonstrated distinct target spectra for individual fibers that selectively promoted the growth of different members of gut microbiota. To perform pooled microbiome analyses, harmonization of data and associated analysis strategies is essential, which is exemplified by applying the same taxonomy for all studies under investigation. Bacterial classification can differ substantially between major databases, such as RDP30 and SILVA31. Furthermore, taxonomies are not constant, but are regularly adjusted based on new findings; the reclassification of Eubacterium rectale to Agathobatcer rectale as well as the separation of Phocaeicola taxa from Bacteroides are more recent examples32. In addition, bioinformatic procedures often vary between studies influencing results. While OTU based approaches were performed earlier by applying various sequence similarity cut-offs, more modern approaches yield amplicon sequence variants that provide a higher resolution33. Unfortunately, harmonization of studies is only possible to a certain degree, primarily encompassing bioinformatics and data analysis. Thus, whether the remaining discrepancies, such as the vast differences in abundances of propionate pathways in pre-intervention data observed, resulted from wet lab procedures applied or reflected true biological differences, such as individual subject characteristics, is unknown. For example age, that is known to affect microbial composition. We excluded studies solely focusing on children, however, no upper age limit was set due to a lack of data and any potential impact of age was, hence, not investigated here.
Based on our results, ITF and AXOS triggered a bifidogenic effect that has already been reported in the literature, also in the studies included here. Bifidobacteria have a high capacity to degrade polysaccharides34 and in vitro experiments verified their growth on ITF and AXOS 35,36. Hence, the bifidogenic effect is probably due to the direct utilization of the applied fibers. However, we showed that it was not a universal response to fibers (no increase upon RS treatment) and substantially differed in magnitude with higher stimulation in AXOS-treated individuals compared to results from interventions applying ITF. Those data suggest additional mechanisms are involved, such as nutrient competition with other members of gut microbiota, and stress the need to obtain quantitative insights in order to compare outcomes and comprehensively assess a fiber’s potential to stimulate certain taxa34.
Importantly, apart from substantiating the well-known bifidogenic effect, we discerned signals linked to key functions known to be beneficial for the host, namely, the production of the SCFA butyrate. Multiple studies have shown a butyrogenic effect of ITF and RS37 and our results suggest that this effect is due to the selective propagation of but-containing taxa. While both substrates triggered the proliferation of bacteria exhibiting this pathway, the individual taxa targeted were distinct, demonstrating the importance of taking functional redundancy into account when investigating host – microbe interactions38. A combination of two taxa, Faecalibacterium and Anaerostipes, primarily governed the response to ITF, whereas Agathobacter explained the butyrogenic effect of RS. Other butyrate producers, even those exhibiting but, were unaffected or declined. Selective stimulation of certain butyrate-producing taxa is more complex than that of Bifidobacteria and can occur at several levels. For instance, ITF is known to be degraded by Faecalibacterium strains rendering them direct targets for the prebiotic39. However, Roseburia decreased upon intervention despite its ability to grow on inulin in pure culture35 exemplifying that in vitro-based results are not always applicable to real-world settings. It should be noted that 16S rRNA gene-based results only allow investigations at the genus level and responses at the species/strain level, where degradation capabilities of specific substrates can greatly vary, were blind to our analyses. Additional stimulation of butyrate-producing taxa can be triggered by cross-feeding mechanisms. As mentioned in the introduction, it is known that Bifidobacteria-derived lactate can be consumed by certain taxa to produce butyrate and might be one explanation for Anaerostipes growth upon ITF treatment15, the responses of the two taxa on ITF were also positively correlated in the pooled analysis of this study. In the case of RS, where no bifidogenic effect was observed, the relative abundance of Anaerostipes declined and correlated with responses of Bifidobacterium as well. For AXOS, the abundance of Anaerostipes was unaffected despite the highest stimulation of Bifidobacterium. The model organism for the conversion of lactate to butyrate, Anaerobutyricum (formerly classified as Eubacterium (hallii))40, did not increase in its relative abundance in any study, and associations with responses of Bifidobacterium were incongruent between intervention types. The role of Bifidobacterium-derived lactate in stimulating a butyrogenic effect in treatments with ITF (and other substances), hence need further investigations. In general, lactate is a major fermentation end product of many bacteria and readily consumed by others, where its conversion to butyrate, and to propionate via the Pdiol pathway, are considered the major routes. Minor pathways such as the formation of propionate via the acrylate pathway41 or production of acetate during dissimilatory sulfate reduction exist as well16. More detailed analyses on a functional level focusing on lactate production as a whole and subsequent consumption need to be performed in order to provide quantitative answers on the fate of lactate in vivo upon interventions with prebiotics.
Another important metabolic cross-feeding mechanism in the context of this study is the need for extracellular acetate supply for the functioning of But and subsequent growth of taxa encoding this enzyme. It has been shown that major but-exhibiting taxa are net-acetate consumers, where acetate concentrations in media controlled the enzyme activity and growth rates of those bacteria42. Thus, the production of acetate by non-butyrate and non-propionate producers probably plays a major role in stimulating butyrate synthesis upon fiber treatment, as suggested earlier7. It is likely that increases in Bifidobacterium contribute to this effect40; however, it only represents one of many acetogenic members of gut microbiota, explaining why its responses did not directly correlate with the butyrate production potential. A third important mechanism for stimulating the growth of butyrogenic taxa is the availability of breakdown products derived from the extracellular degradation of fibers by so-called primary degraders. This is particularly important in the case of RS, where R. bromii and certain Bifidobacteria species, including B. adolescentis were demonstrated to act on those substrates, rendering them available to other taxa7,38,43. We speculate that the increase in Agathobacter was promoted by such a cross-feeding mechanism. The taxon can multiply on starch35 but cannot act on its resistant forms and, hence, most probably relies on the activity of primary degraders. The abundance of Ruminococcus did not significantly increase upon RS treatment, however, we found that higher concentrations of this taxon pre-intervention were key for but-exhibiting bacteria to increase in abundance. Interestingly, the opposite pattern was observed for ITF, where low initial Ruminococcus relative abundances were associated with a positive response of but-containing bacteria. These results suggest that Ruminococcus, in contrast to studies that applied RS, did not act as a cross-feeder in the case of ITF. The initial Prevotella concentrations were negatively correlated with an increase in the butyrogenic potential for both ITF and RS. The exact mechanism is unknown, however, it is likely that Prevotella acts as a direct nutrient competitor given its high ability to degrade diverse polysaccharides44. Nutrient competition might also explain the significant (p < 0.05, p < 0.1 (lmer)) negative association between responses of this taxon with but-containing bacteria on both ITF and RS (data not shown). In summary, our data indicate that Ruminococcus and Prevotella predispose individuals to respond to ITF and RS in terms of the butyrate production potential. The bifidogenic effect was barely correlated and largely represented a separate response.
The abundance of the entire AcCoA pathway was hardly affected by any intervention, and the route via buk even declined in several cases. However, but-carrying taxa are the most potent butyrate producers, especially when compared with bacteria that exhibit the AcCoA pathway lacking both but and buk as terminal enzymes. The latter taxa are often linked to protein degradation yielding less butyrate45,46. Stratifications based on the terminal enzyme are important to properly assess the butyrate production potential. Detailed in vitro studies will further specify the contributions of each of the three biochemically distinct groups to overall butyrate production in quantitative terms.
For propionate, no convincing signals were detected in the pooled analyses. The Suc pathway was hardly affected by the interventions, along with its main members; the Pdiol pathway strongly declined with all fiber treatments. Production of butyrate is tightly linked to the pathway presence in bacteria, especially for those carrying but, whereas propionate synthesis is more prone to metabolic flexibility, particularly for the Pdiol pathway, which does not represent an essential biochemical route for the respective bacteria12. Thus, our analyses should not be interpreted as the inability of fibers to act on propionate production, but should encourage investigations on multi(omics) levels to discern mechanisms in detail, taking bacterial physiology into account26,47.
We and others have demonstrated that data on relative abundances of SCFA pathways and respective taxa correlated with SCFA composition in vitro and in vivo12,48. Furthermore, a recent meta-analysis performed by LaBouyer and colleagues showed that the proportion of butyrate increases as total fecal SCFA concentrations increase due to elevated overall fermentation of fibers49. The authors explained this phenomenon by a decrease in pH that stimulates production of butyrate through acetate consumption of but-containing taxa and is in line with results presented in Kircher and colleagues12. Unfortunately, information on SCFA proportions during interventions were only available from two studies (Supplementary Figure 2). In this context it should also be noted that fecal SCFA concentrations might only partly reflect overall production as the majority of SCFAs ( > 95%) is readily consumed by the host and other bacteria and residual levels in feces is confounded by other factors such as transit time. On this line, it was demonstrated that fecal and plasma concentrations of SCFA do not correlate50. Thus, obtaining comprehensive insights into SCFA production in vivo and how this is governed by gut microbiota functioning in quantitative terms remains a challenging task.
In conclusion, our results demonstrated that ITF and RS selectively stimulated bacterial taxa, increasing the butyrate production potential, whereas a strong bifidogenic effect was observed for AXOS. Furthermore, our results provide crucial information on the common understanding that stratification based on microbiota composition is key to providing effective, personalized treatment. These findings will stimulate intervention designs by applying hypothesis-driven stratification of individuals. Coupling in vivo insights with comprehensive in vitro testing and advanced metagenomic procedures that allow the linkage of functions at the genome level will further progress the field.
Methods
Literature searching strategy
A review by Swanson and colleagues (2020)2 served as a guideline for searching eligible studies; additional string searches were performed on the PubMed Central database in Spring 2022, systematically searching dietary intervention studies, where microbiota composition was monitored. All studies until (including) 2021 were considered. The inclusion criteria were as follows: (1) human intervention study applying a single defined fiber; (2) (randomized) human trials including a placebo/control group; (3) adults; and (4) 16S rRNA gene sequencing data derived from an Illumina platform. Raw sequencing data and associations with interventions were retrieved from the European Nucleotide Archive (ENA). If the respective data were not available, queries to the corresponding authors were sent and, if required, queries were resent after a few weeks. Finally, only studies that encompassed at least two individual studies of a fiber type were included.
Bioinformatics
The obtained data were treated with DADA2 (v1.20), yielding amplicon sequence variants (ASVs) that were classified based on RDP30,33. ASVs were agglomerated at the genus level, which represents the lowest taxonomic resolution possible to compare studies targeting distinct variable regions of the 16S rRNA gene. Furthermore, predictions of SCFA-forming pathways, including terminal genes but and buk were performed as described previously12. All data are expressed as relative abundance data. To focus our analyses on the most relevant (abundant) aspects, analyses of individual taxa were only conducted for major members associated with each pathway based on12 as well as the most abundant non-butyrate, non-propionate-synthesizing taxa.
Data analysis
Before comparing outcomes of studies, data were harmonized to be represented by two time points (pre- and post-intervention for each subject) for the intervention and placebo/control groups. Cross-over designs were not considered; average values were calculated for studies that obtained several samples during the intervention period. For Maier et al. (2017)26 we regarded the low RS dose as the control group. For Healey et al. (2018)18 and Reimer et al. (2020)24 only the groups receiving high and moderate doses, respectively, were considered. Subjects receiving probiotics were omitted from the study of Ford et al. (2019)21.
Subsequently, changes post-intervention relative to the pre-intervention data were calculated, referred to as relative response (RR) data that were capped at +/- 100% in order to lower variances. The absolute change post- versus pre-intervention based on relative abundance data, defined as the relative abundance change (RA), was also calculated. Outcomes of the intervention group compared to the respective placebo/control group were then analyzed in R (v4.2.2) using linear mixed-effect models (function lmer of the lme4 package (v1.1–27.1)) including studies as a random effect (random intercept and random slope). The results of the two groups of individual studies were compared using the lm function. Results are expressed as the estimated effect size (regression coefficient) along with 95% confidence intervals that were retrieved via the confint function. Data were visualized via the package ggplot2 (v3.3.5). Stratifications of Ruminococcus relative abundance pre-intervention (based on the median and quartiles) were performed for each study individually. Similar for Prevotella, where data were stratified into two groups based on their relative abundance (cut-off of 1%) pre-intervention.
The institutional review board of Hannover Medical School approved the waiver of informed consent as this study is based on secondary analyses of already published data without any patient reference.
Supplementary information
Acknowledgements
We greatly thank all authors of the individual studies who initially (or upon request) made their data available to us. This study would not have been possible without it – thank you. This work was funded by the DFG (project #456214861) and DZIF (TTU_06_910 TIPINF study). Marius Vital was additionally funded by HiChol (01GM2204).
Author contributions
M.V. and T.V.W. conceived the study. T. V. W. retrieved the data and performed data harmonization. M.V. performed bioinformatics analyses. M.V. and T.V.W. performed the data analysis and interpreted the results. M.V. and T.V.W. wrote the manuscript.
Funding
Open Access funding enabled and organized by Projekt DEAL.
Competing interests
The authors declare no competing interests.
Footnotes
Publisher’s note Springer Nature remains neutral with regard to jurisdictional claims in published maps and institutional affiliations.
Supplementary information
The online version contains supplementary material available at 10.1038/s41522-024-00533-5.
References
- 1.Makki, K., Deehan, E. C., Walter, J. & Bäckhed, F. The Impact of Dietary Fiber on Gut Microbiota in Host Health and Disease. Cell Host Microbe23, 705–715 (2018). 10.1016/j.chom.2018.05.012 [DOI] [PubMed] [Google Scholar]
- 2.Swanson, K. S. et al. Effect of fructans, prebiotics and fibres on the human gut microbiome assessed by 16S rRNA-based approaches: a review. Benef. Microbes11, 101–129 (2020). 10.3920/BM2019.0082 [DOI] [PubMed] [Google Scholar]
- 3.Gibson, G. R. et al. Expert consensus document: The International Scientific Association for Probiotics and Prebiotics (ISAPP) consensus statement on the definition and scope of prebiotics. Nat. Rev. Gastroenterol. Hepatol.14, 491–502 (2017). 10.1038/nrgastro.2017.75 [DOI] [PubMed] [Google Scholar]
- 4.Scott, K. P. et al. Developments in understanding and applying prebiotics in research and practice-an ISAPP. Conf. Pap. J. Appl. Microbiol.128, 934–949 (2020). 10.1111/jam.14424 [DOI] [PubMed] [Google Scholar]
- 5.Gibson, G. R., Beatty, E. R., Wang, X. & Cummings, J. H. Selective stimulation of bifidobacteria in the human colon by oligofructose and inulin. Gastroenterology108, 975–982 (1995). 10.1016/0016-5085(95)90192-2 [DOI] [PubMed] [Google Scholar]
- 6.Deehan, E. C. et al. Elucidating the role of the gut microbiota in the physiological effects of dietary fiber. Microbiome10, 77 (2022). 10.1186/s40168-022-01248-5 [DOI] [PMC free article] [PubMed] [Google Scholar]
- 7.Vital, M. et al. Metagenomic insights into the degradation of resistant starch by human gut microbiota. Appl. Environ. Microbiol.84, 1–13 (2018). 10.1128/AEM.01562-18 [DOI] [PMC free article] [PubMed] [Google Scholar]
- 8.Chung, W. S. F. et al. Relative abundance of the Prevotella genus within the human gut microbiota of elderly volunteers determines the inter-individual responses to dietary supplementation with wheat bran arabinoxylan-oligosaccharides. BMC Microbiol20, 283 (2020). 10.1186/s12866-020-01968-4 [DOI] [PMC free article] [PubMed] [Google Scholar]
- 9.Rath, S., Rud, T., Karch, A., Pieper, D. H. & Vital, M. Pathogenic functions of host microbiota. Microbiome6, 174 (2018). 10.1186/s40168-018-0542-0 [DOI] [PMC free article] [PubMed] [Google Scholar]
- 10.Ríos-Covián, D. et al. Intestinal Short Chain Fatty Acids and their Link with Diet and Human Health. Front. Microbiol.7, 185 (2016). 10.3389/fmicb.2016.00185 [DOI] [PMC free article] [PubMed] [Google Scholar]
- 11.Louis, P. & Flint, H. J. Formation of propionate and butyrate by the human colonic microbiota. Environ. Microbiol.19, 29–41 (2017). 10.1111/1462-2920.13589 [DOI] [PubMed] [Google Scholar]
- 12.Kircher, B. et al. Predicting butyrate- and propionate-forming bacteria of gut microbiota from sequencing data. Gut Microbes14, 2149019 (2022). 10.1080/19490976.2022.2149019 [DOI] [PMC free article] [PubMed] [Google Scholar]
- 13.Parada Venegas, D. et al. Short Chain Fatty Acids (SCFAs)-Mediated Gut Epithelial and Immune Regulation and Its Relevance for Inflammatory Bowel Diseases. Front. Immunol.10, 277 (2019). 10.3389/fimmu.2019.00277 [DOI] [PMC free article] [PubMed] [Google Scholar]
- 14.Dalile, B., Van Oudenhove, L., Vervliet, B. & Verbeke, K. The role of short-chain fatty acids in microbiota–gut–brain communication. Nat. Rev. Gastroenterol. Hepatol.16, 461–478 (2019). 10.1038/s41575-019-0157-3 [DOI] [PubMed] [Google Scholar]
- 15.Rivière, A., Selak, M., Lantin, D., Leroy, F. & De Vuyst, L. Bifidobacteria and Butyrate-Producing Colon Bacteria: Importance and Strategies for Their Stimulation in the Human Gut. Front. Microbiol.7, 979 (2016). 10.3389/fmicb.2016.00979 [DOI] [PMC free article] [PubMed] [Google Scholar]
- 16.Louis, P., Duncan, S. H., Sheridan, P. O., Walker, A. W. & Flint, H. J. Microbial lactate utilisation and the stability of the gut microbiome. Gut Microbiome3, 1–16 (2022). 10.1017/gmb.2022.3 [DOI] [Google Scholar]
- 17.Kleine Bardenhorst, S. et al. Gut microbiota dysbiosis in Parkinson disease: A systematic review and pooled analysis. Eur. J. Neurol.30, 3581–3594 (2023). 10.1111/ene.15671 [DOI] [PubMed] [Google Scholar]
- 18.Healey, G. et al. Habitual dietary fibre intake influences gut microbiota response to an inulin-type fructan prebiotic: A randomised, double-blind, placebo-controlled, cross-over, human intervention study. Br. J. Nutr.119, 176–189 (2018). 10.1017/S0007114517003440 [DOI] [PubMed] [Google Scholar]
- 19.Sloan, T. J. et al. A low FODMAP diet is associated with changes in the microbiota and reduction in breath hydrogen but not colonic volume in healthy subjects. PLoS One13, e0201410 (2018). 10.1371/journal.pone.0201410 [DOI] [PMC free article] [PubMed] [Google Scholar]
- 20.Baxter, N. T. et al. Dynamics of human gut microbiota and short-chain fatty acids in response to dietary interventions with three fermentable fibers. MBio10, e02566–18 (2019). 10.1128/mBio.02566-18 [DOI] [PMC free article] [PubMed] [Google Scholar]
- 21.Ford, A. L. et al. Microbiota Stability and Gastrointestinal Tolerance in Response to a High-Protein Diet with and without a Prebiotic, Probiotic, and Synbiotic: A Randomized, Double-Blind, Placebo-Controlled Trial in Older Women. J. Acad. Nutr. Diet. 120, 500-516.e10 (2020). [DOI] [PubMed]
- 22.Hiel, S. et al. Link between gut microbiota and health outcomes in inulin -treated obese patients: Lessons from the Food4Gut multicenter randomized placebo-controlled trial. Clin. Nutr.39, 3618–3628 (2020). 10.1016/j.clnu.2020.04.005 [DOI] [PubMed] [Google Scholar]
- 23.Li, L. et al. Inulin-type fructan intervention restricts the increase in gut microbiome-generated indole in patients with peritoneal dialysis: a randomized crossover study. Am. J. Clin. Nutr.111, 1087–1099 (2020). 10.1093/ajcn/nqz337 [DOI] [PubMed] [Google Scholar]
- 24.Reimer, R. A. et al. Effect of chicory inulin-type fructan-containing snack bars on the human gut microbiota in low dietary fiber consumers in a randomized crossover trial. Am. J. Clin. Nutr.111, 1286–1296 (2020). 10.1093/ajcn/nqaa074 [DOI] [PubMed] [Google Scholar]
- 25.Upadhyaya, B. et al. Impact of dietary resistant starch type 4 on human gut microbiota and immunometabolic functions. Sci. Rep.6, 28797 (2016). 10.1038/srep28797 [DOI] [PMC free article] [PubMed] [Google Scholar]
- 26.Maier, T. V. et al. Impact of dietary resistant starch on the human gut microbiome, metaproteome, and metabolome. MBio8, e01343–17 (2017). 10.1128/mBio.01343-17 [DOI] [PMC free article] [PubMed] [Google Scholar]
- 27.Deehan, E. C. et al. Precision Microbiome Modulation with Discrete Dietary Fiber Structures Directs Short-Chain Fatty Acid Production. Cell Host Microbe27, 389–404.e6 (2020). 10.1016/j.chom.2020.01.006 [DOI] [PubMed] [Google Scholar]
- 28.Kemp, J. A. et al. The Impact of Enriched Resistant Starch Type-2 Cookies on the Gut Microbiome in Hemodialysis Patients: A Randomized Controlled Trial. Mol. Nutr. Food Res.65, e2100374 (2021). 10.1002/mnfr.202100374 [DOI] [PubMed] [Google Scholar]
- 29.Müller, M. et al. Effect of wheat bran derived prebiotic supplementation on gastrointestinal transit, gut microbiota, and metabolic health: a randomized controlled trial in healthy adults with a slow gut transit. Gut Microbes12, 1704141 (2020). 10.1080/19490976.2019.1704141 [DOI] [PMC free article] [PubMed] [Google Scholar]
- 30.Cole, J. R. et al. Ribosomal Database Project: data and tools for high throughput rRNA analysis. Nucleic Acids Res42, D633–D642 (2014). 10.1093/nar/gkt1244 [DOI] [PMC free article] [PubMed] [Google Scholar]
- 31.Quast, C. et al. The SILVA ribosomal RNA gene database project: improved data processing and web-based tools. Nucleic Acids Res. 41, D590-6 (2013). [DOI] [PMC free article] [PubMed]
- 32.García-López, M. et al. Analysis of 1,000 Type-Strain Genomes Improves Taxonomic Classification of Bacteroidetes. Front. Microbiol.10, 2083 (2019). 10.3389/fmicb.2019.02083 [DOI] [PMC free article] [PubMed] [Google Scholar]
- 33.Callahan, B. J. et al. DADA2: High-resolution sample inference from Illumina amplicon data. Nat. Methods13, 581–583 (2016). 10.1038/nmeth.3869 [DOI] [PMC free article] [PubMed] [Google Scholar]
- 34.Pokusaeva, K., Fitzgerald, G. F. & van Sinderen, D. Carbohydrate metabolism in Bifidobacteria. Genes Nutr.6, 285–306 (2011). 10.1007/s12263-010-0206-6 [DOI] [PMC free article] [PubMed] [Google Scholar]
- 35.Scott, K. P., Martin, J. C., Duncan, S. H. & Flint, H. J. Prebiotic stimulation of human colonic butyrate-producing bacteria and bifidobacteria, in vitro. FEMS Microbiol. Ecol.87, 30–40 (2014). 10.1111/1574-6941.12186 [DOI] [PubMed] [Google Scholar]
- 36.Saito, Y. et al. Multiple Transporters and Glycoside Hydrolases Are Involved in Arabinoxylan-Derived Oligosaccharide Utilization in Bifidobacterium pseudocatenulatum. Appl. Environ. Microbiol.86, e01782–20 (2020). 10.1128/AEM.01782-20 [DOI] [PMC free article] [PubMed] [Google Scholar]
- 37.Topping, D. L. & Clifton, P. M. Short-chain fatty acids and human colonic function: roles of resistant starch and nonstarch polysaccharides. Physiol. Rev.81, 1031–1064 (2001). 10.1152/physrev.2001.81.3.1031 [DOI] [PubMed] [Google Scholar]
- 38.Vital, M., Karch, A. & Pieper, D. H. Colonic Butyrate-Producing Communities in Humans: an Overview Using Omics Data. mSystems2, e00130–17 (2017). 10.1128/mSystems.00130-17 [DOI] [PMC free article] [PubMed] [Google Scholar]
- 39.Lopez-Siles, M. et al. Cultured representatives of two major phylogroups of human colonic Faecalibacterium prausnitzii can utilize pectin, uronic acids, and host-derived substrates for growth. Appl. Environ. Microbiol.78, 420–428 (2012). 10.1128/AEM.06858-11 [DOI] [PMC free article] [PubMed] [Google Scholar]
- 40.Belenguer, A. et al. Two routes of metabolic cross-feeding between Bifidobacterium adolescentis and butyrate-producing anaerobes from the human gut. Appl. Environ. Microbiol.72, 3593–3599 (2006). 10.1128/AEM.72.5.3593-3599.2006 [DOI] [PMC free article] [PubMed] [Google Scholar]
- 41.Reichardt, N. et al. Phylogenetic distribution of three pathways for propionate production within the human gut microbiota. ISME J.8, 1–13 (2014). [DOI] [PMC free article] [PubMed] [Google Scholar]
- 42.Duncan, S. H., Barcenilla, A., Stewart, C. S., Pryde, S. E. & Flint, H. J. Acetate utilization and butyryl coenzyme A (CoA): acetate-CoA transferase in butyrate-producing bacteria from the human large intestine. Appl. Environ. Microbiol.68, 5186–5190 (2002). 10.1128/AEM.68.10.5186-5190.2002 [DOI] [PMC free article] [PubMed] [Google Scholar]
- 43.Ze, X. et al. Unique organization of extracellular amylases into amylosomes in the resistant starch-utilizing human colonic Firmicutes bacterium Ruminococcus bromii. MBio6, e01058–15 (2015). 10.1128/mBio.01058-15 [DOI] [PMC free article] [PubMed] [Google Scholar]
- 44.Gálvez, E. J. C. et al. Distinct Polysaccharide Utilization Determines Interspecies Competition between Intestinal Prevotella spp. Cell Host Microbe28, 838–852.e6 (2020). 10.1016/j.chom.2020.09.012 [DOI] [PubMed] [Google Scholar]
- 45.Louis, P. et al. Restricted distribution of the butyrate kinase pathway among butyrate-producing bacteria from the human colon. J. Bacteriol.186, 2099–2106 (2004). 10.1128/JB.186.7.2099-2106.2004 [DOI] [PMC free article] [PubMed] [Google Scholar]
- 46.Vital, M., Howe, A. & Tiedje, J. Revealing the bacterial butyrate synthesis pathways by analyzing (meta) genomic data. MBio5, e00889–14 (2014). 10.1128/mBio.00889-14 [DOI] [PMC free article] [PubMed] [Google Scholar]
- 47.Benítez-Páez, A. et al. A Multi-omics Approach to Unraveling the Microbiome-Mediated Effects of Arabinoxylan Oligosaccharides in Overweight Humans. mSystems4, e00209–e00219 (2019). 10.1128/mSystems.00209-19 [DOI] [PMC free article] [PubMed] [Google Scholar]
- 48.Reichardt, N. et al. Specific substrate-driven changes in human faecal microbiota composition contrast with functional redundancy in short-chain fatty acid production. ISME J.12, 610–622 (2018). 10.1038/ismej.2017.196 [DOI] [PMC free article] [PubMed] [Google Scholar]
- 49.LaBouyer, M. et al. Higher total faecal short-chain fatty acid concentrations correlate with increasing proportions of butyrate and decreasing proportions of branched-chain fatty acids across multiple human studies. Gut Microbiome3, 1–14 (2022). 10.1017/gmb.2022.1 [DOI] [Google Scholar]
- 50.Müller, M. et al. Circulating but not faecal short-chain fatty acids are related to insulin sensitivity, lipolysis and GLP-1 concentrations in humans. Sci. Rep.9, 12515 (2019). 10.1038/s41598-019-48775-0 [DOI] [PMC free article] [PubMed] [Google Scholar]
Associated Data
This section collects any data citations, data availability statements, or supplementary materials included in this article.