Abstract
This study introduces an experimental investigation of a novel direct trend evaporative cooler based on a ground-air heat exchanger (GAHE) using porous clay vessels as an evaporation media under a variety of operational conditions, including air flow rate, inlet air temperature, temperature of inlet water, and in air humidity. The evaluation of the GAHE performance was based on the air-cooling effect, wet-bulb and dew-point efficiencies, energy efficiency ratio, water evaporation rate, specific water evaporation, specific cooling capacity, specific total cost, and CO2 emission rate. The influences of dry-bulb temperature, the incoming air's relative humidity (RH), and six air flow rates ranging from 11 to 25 L/s on the performance are investigated and discussed. Results indicated that increasing the air flow rate leads to an increase in the cooling capacity. Energy efficiency ratio (EER) reaches the highest value of about 25.5 recorded at 3:00 PM with air flow rate = 11 L/s. The lowest EER value is approximately 7.2 when the measured inlet and outlet temperatures are the closest at 7:00 PM, with a flow rate of 25 L/s. Increasing the air flow rate from 11 to 17 L/s increased the wet bulb efficiency, and the airflow rate was inversely proportional to wet-bulb efficiency. The maximum and minimum average dew-point efficiencies are 64% and 58% at 17 L/s and 22 L/s respectively. The water evaporation rate increases by 182.1%, increasing the air flow rate from 11 to 25 L/s.
Keywords: Clay vessels, Ground heat exchanger, Evaporative cooler, Eco-friendly building
Subject terms: Geothermal energy, Environmental sciences
Introduction
Building energy requirements have significantly increased in recent years due to an expanding population and improved living conditions. About 33% of global energy consumption is used for space cooling and heating1,2. Due to the relatively high indoor air temperatures in the summer, air conditioning is mainly used for cooling, which results in considerable energy consumption in residential buildings. It is essential to look at alternative passive heating and cooling methods. A passive technology for cooling and heating is the GAHE. However, it provides advantages for the environment and the economy. It makes use of the thermal potential of the subterranean earth. A dependable soil depth has a steady temperature that serves as a winter and summer energy source and sink3. To optimize the design of GAHE, thermal performance testing is accurate and crucial.
The procedure considers the pipe's length, material, heat exchanger type, buried depth, and air flow rate through the pipe. Porous Clay Vessels (PCVs) for GAHE systems come in various designs and configurations, each tailored to suit specific applications and performance requirements. He et al.4 investigated the cooling effects of a porous, water-absorbent ceramic material for passive evaporative cooling. The passive cooling approach is intended to reduce summertime surface temperatures and establish cooler urban environments. The majority of research on clay as a membrane material focused on pillared clays5–7. Just recently, research on membranes made wholly from clay began8,9. The modification of membrane material and membrane surface has a significant effect on separation properties. The surface of the membrane material was modified to enhance its hydrophilicity. Typically, ceramic membranes were made from metal oxides such as alumina, zirconia, and titania, as well as organic clay powder constituted primarily of metal oxides. These materials are initially permeable due to surface hydroxyl (–OH) groups, which can readily link water molecules10,11. Extensive research has been conducted on the mechanism of heat and mass transport inside the planar membrane humidifier. Wang et al.12 studied a porous plate's heat and water transmission process within a fuel cell's self-humidifying system. The results demonstrated that the transfer of heat and transmission of water was increased by using a countercurrent flow and raising the humidifying gas's inlet temperature and RH. It is possible to simultaneously improve the water recovery rate by utilizing a countercurrent flow, raising the humidifying gas's intake temperature, and lowering the RH. Increasing the degree of the medium porosity can also facilitate water transfer. A heat and mass transportation model of evaporative refrigerators made of clay pots for storing vegetables was evaluated by Rehman et al.13. Results indicated that despite the boost in convection heating, an increase in local wind speed has a net beneficial impact on refrigeration efficiency.
Using porous clay vessels for GAHE with a focus on evaporative cooling is an intriguing application that combines traditional materials with innovative cooling techniques. Evaporative cooling takes advantage of the natural water evaporation process to cool the incoming air, making it an energy-efficient way to provide comfort in hot and dry climates14. Dogramacı and Aydın15 presented an Experimental comparison of evaporative cooling applications in arid climates. The combination of evaporative cooling with contemporary architecture was evaluated by Ibrahim et al.16. The Investigation employed porous clay materials as wet media, integrated with heat pipe heat exchangers; the supply air and operating air flows were staged in separate channels and in opposite directions. Results indicated that supply air would be chilled below the wet-bulb temperature to achieve a significant cooling effect and efficiency.
Using evaporative cooling to achieve thermal comfort in buildings was reviewed by17–22. Bora et al.23 presented the performance enhancement techniques of evaporative air coolers. Results revealed that Evaporative air coolers have been discovered to be superior to air conditioners.
Geothermal energy (GE) is an extensive and prospective renewable energy source for building cooling, ventilation, and heating24. Soni et al.25 reviewed the GE application integrated with GAHE. Globally, the GAHE systems technology is widely recognized. Lekhal et al.26 investigated the performance of a residential house integrated with solar floor and GAHE. Results indicated that the combination of solar floor and GAHE saved power needs for heating and cooling by 70, and 66%, respectively. The annual cooling energy saving of 9.6% for Houston and 13.8% for Dallas was analyzed by Do et al.27. The performance evaluation of GAHE in Egyptian claymate was investigated by Serageldin et al.3. The optimal depth for submerging GAHE pipelines is 3 m when the ground temperature is 32 °C in the summer and 29 °C in the winter28. Mathur et al.29 performed a Comparative study of straight and spiral GAHE systems operated in cooling and heating modes. The cooling and heating COP were 5.94 and 6.24 in summer 1.92 and 2.11 in winter, respectively. Soni et al.30 used GE to save the consumed energy for a 1.5 TR window air-conditioner. The evaluation of using GAHE under the climate condition of India was studied by Tiwari et al.31. Karabacak et al.32 investigated the cooling performance of the ground source heat pump system under the climates of Denizli, Turkey. Results revealed that the COP ranged between 3.1 and 4.8.
As a result of global warming, the electrical power consumption of cooling appliances is on the rise, increasing carbon emissions33. Earth contact cooling technologies are one of the potential solutions to this issue. Several investigations have been conducted on this topic. Ozgener and Ozgener34 conducted an exergoeconomic assessment of the Earth-Air Heat Exchanger (EAHE) system employed for greenhouse cooling in one of the research investigations on cooling. The investigation of a novel passive air conditioning system was performed by Li et al.35. The integration of EAHEs with solar collector-enhanced solar chimneys was their primary focus, to enhance the cooling system's overall efficiency. The system's ability to maintain indoor thermal comfort within a favorable range was demonstrated by the results, which demonstrated that the simultaneous augmentation of geothermal and solar energy can result in significant energy savings in the construction industry and reduce peak electricity demand during the summer. By incorporating an air supply static pressure chamber, Yang et al.36 mitigated temperature variations and enhanced cooling capacity. Their results indicated that the suggested technique, which employs EAHE, can effectively mitigate the temperature and variations in the outlet air, thereby offering a low-emission solution to enhance the thermal environment of structures. Li et al.37 demonstrated that implementing a sprinkler system in an EAHE increases COP and cooling capacity. They also developed a novel fresh air supply system that offers independent and dependable refrigeration with EAHE in their studies.
According to a review of all the cooling technique literature and an analysis of the current cooling techniques, the following findings were concluded:
Cooling efficiency: Most studies report significant reductions in indoor temperatures, ranging from 5 to 18 °C, depending on system design and local climate conditions.
Energy savings: Energy savings in HVAC applications are consistently reported, with reductions ranging from 25 to 30%.
Key Findings: The consistent theme across studies is that GAHE systems, when optimized and integrated properly, significantly enhance energy efficiency and provide effective climate control in eco-friendly buildings.
In addition to that, an air conditioner's installation and operating costs are too high, and it also releases environmentally harmful greenhouse gases. On the other hand, the classic evaporative air cooler is less expensive than an air conditioner but has some cooling limits. Hence, these findings underscore the potential of GAHE systems with porous clay vessels in achieving sustainable and energy-efficient building designs. The current study aims to introduce a novel eco-friendly direct evaporative cooler based on GAHE using porous clay vessels as an evaporation media. The suggested system is examined to determine the influence of operating conditions on its performance, such as flow rate, temperature of inlet air, water temperature, and humidity of inlet air. As evaluation criteria, the metrics of air-cooling effect, wet-bulb and dew-point efficiencies, energy efficiency ratio, water evaporation rate, specific water evaporation, specific cooling capacity, specific total cost, and CO2 emission rate.
Experimental work and measurement devices
Experimental setup
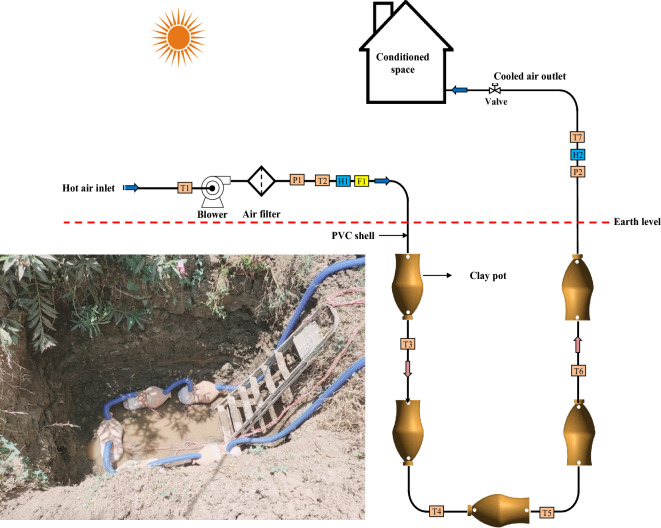
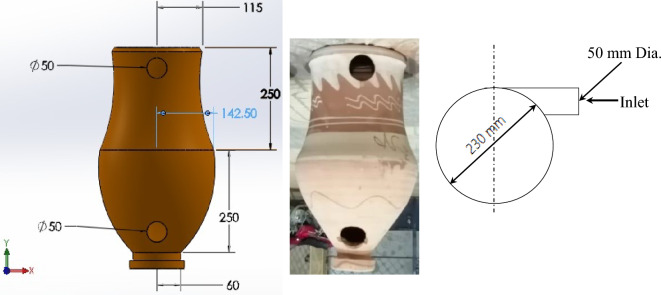
Figure 1 shows the schematic drawing and photographs of the suggested test rig utilized to evaluate the performance of porous clay vessels (PCV), while Fig. 2 shows a photograph of the PCV with dimensions. The ground heat exchanger was established and tested under the climates of Birkat Elsab City, Monufia, Egypt (Latitude of 30° 38′ 19.28'' N, Longitude of 31° 4′ 52'' E), and the system operates through 11 h, starting at 08:00 AM from 9 Sep. to 13 Oct. 2022. As shown in Fig. 1, the GAHE system consists of the ground and air supply circuits. The heat exchanger is composed of three burial parts with a 9 m total length of PVC pipe with five PCVs; 2 m vertical (inlet pipe) plus 5 m horizontal plus 2 m vertical (outlet pipe)) and inner diameter 0.0508 m (2 in.) (Table 1). The PCV geometry, which was used in all experiments and was built of very porous red clay with an 8 mm thickness, is shown in Fig. 2a in both a photograph and a schematic diagram. The upper cylindrical section and bottom frustum formed the PCV, which possessed cylindrical symmetry. Its total surface area, including the top and base, is 0.9 m2. Table 2 contains the properties of PCV. The PVC pipes were fixed with the clay vessel pipes with the help of circular holes at specific locations in U arrangement as presented in Fig. 1. The appropriate distance equal to 45 cm was maintained between the clay vessels for proper circulation of air inside the GAHE as shown in Fig. 1. Four bends connect the buried PVC pipes. Due to the vessel's porosity, a thin layer of water generated on the interior surface of the clay jar is used in the current experiment setup to interchange sensible and latent heat with the moving air. Therefore, a water-circulating pump, a vital element of any traditional evaporative air cooler, is unnecessary. As shown in Fig. 2b, A swirl tube uses a tube tangential entrance with fins to considerably improve the wall heat transfer by increasing the turbulent mixing close to the wall. Strong swirling flow is produced circumferentially by the swirl tube with fins.
Figure 1.
Schematic drawing and photographs of the suggested test rig.
Figure 2.
PCV and feeding method.
Table 1.
The main results summary of earth-air heat exchanger.
Table 2.
Properties of the PCV41.
| Property | Units | Quantity |
|---|---|---|
| Density | kg/m3 | 2250 |
| Specific heat | J/kg. °C | 900 |
| Thermal conductivity | W/m. °C | 1.3 |
| Porosity | % | 0.775 |
The inlet end of the GAHE pipe connected to an air blower has an axial fan with a rated power 710 W, a maximum flow rate of 4 m3/min, and a top speed of 14,000 RPM, which is adjusted manually to manipulate air velocity. The airflow rate in these experiments varies from 11 to 25 l/s. The outlet end of the GAHE pipe is connected to a test room (conditioned space) with dimensions of 3.5 m × 3.5 m × 3 m (L × W × H), its roof and walls are thermally insulated and fully exposed to the open environment. A trough with dimensions of 1.5 × 2 × 2 m3 is dug. The GAHE was buried at a depth of 2 m, as shown in Fig. 1. To ensure better and uniform performance and avoid pores clogging of the porous media material by impurities in the water, after installing the pipes, the removed soil will be replaced with Loamy sand as an isotropic soil with homogeneous thermal conductivity.
Measurement devices
In Fig. 1, F, T, H, and P demonstrate the locations for measuring flow rate, temperature, RH, and pressure. Airflow velocity is measured with a flow meter. At the inlets, between the PCVs, and at the outlets, sensors were installed to measure temperature and humidity to evaluate the heat and water transfer through the GAHE. In the experimental runs, the ambient air temperature and relative humidity (T1 and RH1) were recorded by instruments having 0.2% and 3% (full scale, FS) using a thermometer and a Hygrometer (HMT330), respectively. Sensor T1 simultaneously measures and logs the ambient temperature (Tam). T2 and T7 thermocouples were placed at the inlet and outlet of GAHE. Four temperature sensors, T3 to T6, were mounted at a depth of 2 m from the ground surface and fixed with the assistance of PVC pipes to measure the time-varying air temperature, as depicted in Fig. 1. To measure the airflow rate (F1), a Rotameter was installed in series with the airflow line. The control of the discharge rates was accomplished by varying their speeds. Saturated, moist air is expelled from the test section. In addition to the ambient air temperature and RH, the efficacy of the characteristics of the test section at different operating conditions was also evaluated using these variables. Before determining the sensitivity of the probe, all sensors were calibrated. A graduation pressure gauge decided the pressure difference between the air inlet and exhaust. Table 3 presents the comprehensive technical details of the sensors and probes.
Table 3.
Sensor and probe technical details.
| Sensor-Type | Ref | Detail | Accuracy |
|---|---|---|---|
| Thermocouple K-type | Zhejiang | Temperature | ± 1% |
| HTC-2 (− 50– + 70 °C) and (10%-99% RH) | Selectech | Temperature and Humidity | ± 1% |
| DS 120 | MGE | Solar radiation | ± 1% |
| LZs-125 (15–150 m3/h) | SENTEC | Rotameter | ± 4% |
| UT-212 | Telenin | Pressure gauge | ± 1.8% |
The following steps are the experimental testing apparatus operating: (i) run the air blower at a pace that discharges the air flow rate required; (ii) measure the ambient and flowing air temperatures and RH reaching steady conditions; (iii) record the temperatures of flowing air and water and RH at steady state.
All case studies tested conditions are shown in Table 4.
Table 4.
Test case conditions.
| Date | Air flow rate (L/s) |
|---|---|
| 13–10-2022 | 11 |
| 12–10-2022 | 13 |
| 10–10-2022 | 17 |
| 08–10-2022 | 20 |
| 07–10-2022 | 22 |
| 09–09-2022 | 25 |
Performance assessment
In the investigations, the following parameters were measured hourly (each 1 h).
The ambient temperature
The temperature of the inlet and exit flowing air.
The relative humidity of air at the inlet and outlet flow rate: RH1 and RH2.
Ground temperatures: T3 to T6.
Solar radiation.
Pressure loss in GAHE.
When considering the performance of a direct evaporative cooler, the temperature of the air output, the pressure drop, and the cooling efficiency (ηco) are the primary factors considered. The energy efficiency ratio (EER) is dependent on the pressure decrease through PCV, which is proportional to the consumed power required to operate the fan.
Thermal analysis
Wet-bulb efficiency () is the ratio of the temperature difference between the inlet and outlet of cooling air to the temperature difference between the inlet and moist bulb of cooling air42. The data measured, such as the inlet and exit air temperatures, determines the heat transfer efficiency in the absence of condensation in the primary air stream. The wet bulb efficiency is defined by Eq. (1):
| 1 |
where Td,in and Td,out are the temperatures of dry channel inlet and outlet air, and Td,wb is the temperature of wet-bulb air entering the dry channel.
On the other hand, the dew point effectiveness is the ratio of the difference between ambient air temperature and its dew point temperature. Mathematically, the expression for dew-point efficiency is as42:
| 2 |
Qc, the cooling capacity.
Equation (3) determines the sensible cooling of GAHE43:
| 3 |
where Cp,a is the specific heat of air and is the flow rate of air in kg/s.
The air temperature drop () or cooling effect was determined by considering the inlet and exit temperatures of the flowing air, as shown in Eq. (4)8:
| 4 |
The air blower power consumption Wblower is the only power supplied to a GAHE. The total power (WT) is determined by Eq. (5)44:
| 5 |
where Δp is the pressure loss across the GAHE and ηblower is the fan motor efficiency which is assumed as 0.945.
The industry devised the energy efficiency ratio (EER) to evaluate the energy consumption rate of air conditioning units. EER is determined by dividing the input electrical power (in watts) by the quantity of cooling produced (in British Thermal Units or BTU) under a single set of conditions46:
| 6 |
As shown in Eq. (7), the water evaporation rate (WER) in the GAHE system is calculated by multiplying the mass flow rate and absolute humidity difference of air (Δω).
| 7 |
Cooling capacity (Qc), specific cooling capacity (SCC), and specific water evaporation (SWE) can be calculated from47:
| 8 |
| 9 |
where is logarithmic mean temperature difference.
| 10 |
Energy's quantity is not as valuable as its quality, or the work that can be accomplished with a given level of energy, which is referred to as exergy (available work or availability). Exergy is the maximum quantity of work that a subsystem can perform as it reaches equilibrium with its surroundings in a reversible process, defined from a thermodynamic perspective48. Based on the second law of thermodynamics, the exergy analysis encompasses the entire exergy inflow, exergy outflow, and exergy destructed from the system. The general exergy balance of a system can be expressed as49:
| 11 |
Considering the same control volume as for the energy Eq. (11) becomes50:
| 12 |
Substituting each exergy term by its corresponding formula, (12) becomes50:
| 13 |
To is the reference temperature, which is the mean temperature of the selected environment. Tw is the tube wall temperature, determined by the median of the three wall temperature readings obtained along the tube. Note that in other investigations, the wall temperature Tw was measured at a single point51 or determined by utilizing the constant temperature of undisturbed soil52.
The mechanical power delivered by the fan to the air is defined by.
| 14 |
ψi and ψo are the specific flow exergies, which are determined using the humid air flow exergy formulated by53:
| 15 |
Such that n is any point along the flow and T0, P0, and ω0 are the reference values of the temperature, pressure, and humidity ratios, respectively.
Based on its capabilities, exergetic efficiency is employed to determine a more accurate evaluation of the system. : The exergetic efficacy of the entire EAHE system is determined by:
| 16 |
The rapid depletion of resources is a consequence of the utilization of power and the advancement of technologies. The concept of sustainability guarantees the equitable utilization of resources without jeopardizing the future. A performance measure and comparison tool is the sustainability index (SI)54. The following is the method used to calculate the index:
| 17 |
Economic analysis
For economic analysis, the initial and operating costs of the cooler are estimated for GAHE cooler. GAHE's primary components are a heat exchanger and an airflow fan. The entire cost of the GAHE is the sum of its operating and capital costs (initial costs). The total cost is computed as follows:
| 18 |
where Cop is the operating cost; it includes energy, operating personnel, and raw materials management. Cmain is the maintenance cost and consists of technicians, maintenance facility costs, testing supplies, support for maintenance and processing costs, and maintenance spares and repair parts. Cc is the capital (initial) cost; the price of each component is shown in Table 4.
The costs are incurred in Egypt and converted to USDs using the current exchange rate. The USD is a universally recognized currency, which assists readers from all over the world in comprehending the economic analysis of GAHE. The cost of operation is determined by the amount of energy (electricity) required to operate the air turbine. The electricity consumption fee is estimated to be 0.039 USD/kWh globally. The operating cost of the system is computed based on 10 working hours daily for one year. The specific total cost (STC) is the total cost per unit cooling rate55 (Table 5).
| 19 |
Table 5.
Cost of capital expenditures for GAHE, including installation expenses.
| Item description | Unit | Unit price (USD) | Qty | Price (USD) |
|---|---|---|---|---|
| Pottery vessels | No | 3 | 5 | 15 |
| Air blower | No | 20 | 1 | 20 |
| Pipes, fittings | m | 1 | 9 | 9 |
| Excavation and filling costs | m3 | 5 | 6 | 30 |
| Measuring and control devices | – | – | –– | 25 |
| Installation cost | – | – | –– | 15 |
| Accessories | – | – | – | 6 |
| Total cost | 120 | – | – | – |
Environmental analysis
Energy extraction from traditional sources has adverse environmental effects, including ozone depletion, acid rain, and carbon emissions. Electricity is utilized to power the fan and compressor. Coal is burned in electric substations to generate electricity. The carbon emission factor can be used to estimate the carbon emissions (CE) associated with electricity production. The CO2 emission is calculated by56,
| 20 |
where is the mass by kg of carbon and is the emission factor for carbon. This factor varies from country to country based on the electricity generation methodologies. The carbon emission factor for Egypt is 0.5 kgCO2/kWh57. The Wblower is the power consumption throughout operating hours, measured in kilowatts, and tOp is the device's operating hours, measured in yearly hours.
Uncertainty analysis
For any measured or calculated parameter (y) as a function of independent variables , the uncertainty value (u) was calculated as follows58:
The uncertainty (uy) can be determined as follows:
| 21 |
where u1, u2, ….. are the uncertainties in As presented in Table 6.
Table 6.
Uncertainty values.
| Parameter | Value |
|---|---|
| Temperature | ± 0.43 °C |
| Cooling effect | ± 0.43 °C |
| EER | ± 7. 6% |
| Wet-bulb efficiency | ± 5.4% |
| Dew-point efficiency | ± 0.83% |
| Specific cooling capacity | ± 2.4% |
| Specific water evaporation | ± 2.3% |
| Exergy efficiency | ± 3.7% |
| Sustainability index | ± 3.7% |
Results and discussions
There were six investigations conducted with airflow rates ranging from 11 to 25 L/s. The performance factors are evaluated using the values of air DBT at the outflow of the GAHE, outlet RH, and blower energy consumption. In addition, three major influences are investigated and discussed: dry-bulb temperature of the incoming air, RH of the incoming air, and airflow rate. Figure 3 presents hourly variation of solar radiation intensity and ambient RH. This Fig. shows that the values of the inlet air conditions depend on the solar radiation intensity. For all test cases, Fig. 3a shows that the solar radiation intensity reaches the maximum values at 13:00 PM by about 1190 W/m2 when the air flow rate is 25 L/s. Also, Fig. 3b illustrates that the maximum values of RH are in the morning at 08:00 AM by about 65% and minimum at 13:00 PM by 27%. These findings prove the dependency of humidity values and temperature on solar intensity.
Figure 3.
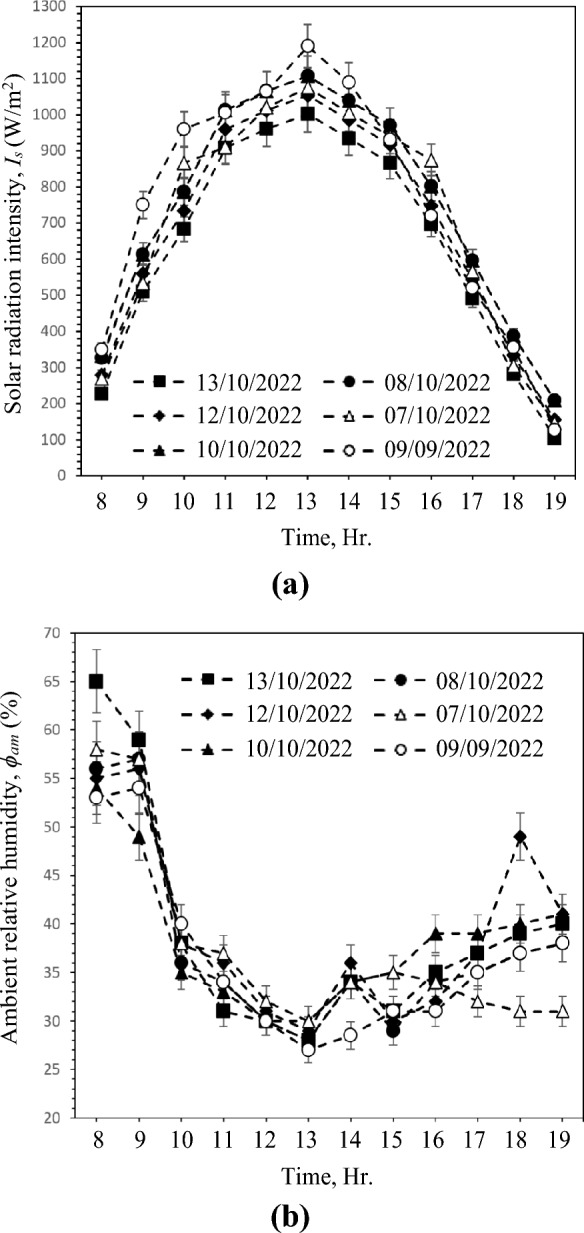
Hourly variation of (a) Solar radiation intensity and (b) Ambient RH.
Cooling effect
The effect of porous clay vessels on the air-cooling impact was analyzed. Figure 4 depicts the average air temperature difference between the inlet and outlet of the test section of the porous clay vessels as a function of the air flow rate of 11L/s to 25L/s. Due to forced convective heat and mass transfer between clay vessels and moving air, the clay vessels' cooling effect is responsible for the temperature decrease across the test section. According to the proposed system design and structure and related heat and mass transfer processes, It is anticipated that as air mass flow rate increases, temperature decline will increase, most likely due to the increasing rate of water evaporation with the increase in airflow rate and the decreased retention time of air and clay vessel surface contact. However, with a high airflow rate, the clay vessels are predicted to get saturated in a shorter time; thus, the air temperature reduction could last shorter at high air flow rates. Also, a portion of air will pass by the clay containers without making contact, resulting in decreased water evaporation. On the other hand, the cooling impact of GAHE depends on the rate of evaporation and the internal conditions of the cooler. Temperature and humidity of incoming air have the greatest environmental impact on evaporation. Therefore, when the inlet temperature is high enough, significant evaporation can occur, and when the inlet RH is low enough, more water vapor can be absorbed by the air. According to Fig. 3, inlet temperature and air humidity vary depending on the solar radiation intensity. In Fig. 4a, the temperature difference between GAHE inlet and exit with a flow rate of 25 L/s shows the highest value of about 19.3 °C at solar radiation intensity = 1056 W/m2 and inlet RH = 30%, as shown in Fig. 3. Also, Fig. 4a demonstrates that the temperature gradient is high at a modest air flow rate of 11L/s and decreases as the airflow rate increases. The inlet air wet-bulb depression (WBD) is the difference between DBT and WBT at the inlet. It may significantly affect the exit air temperature. The cooling effect increases with the increase of inlet air temperature and vise versa.
Figure 4.
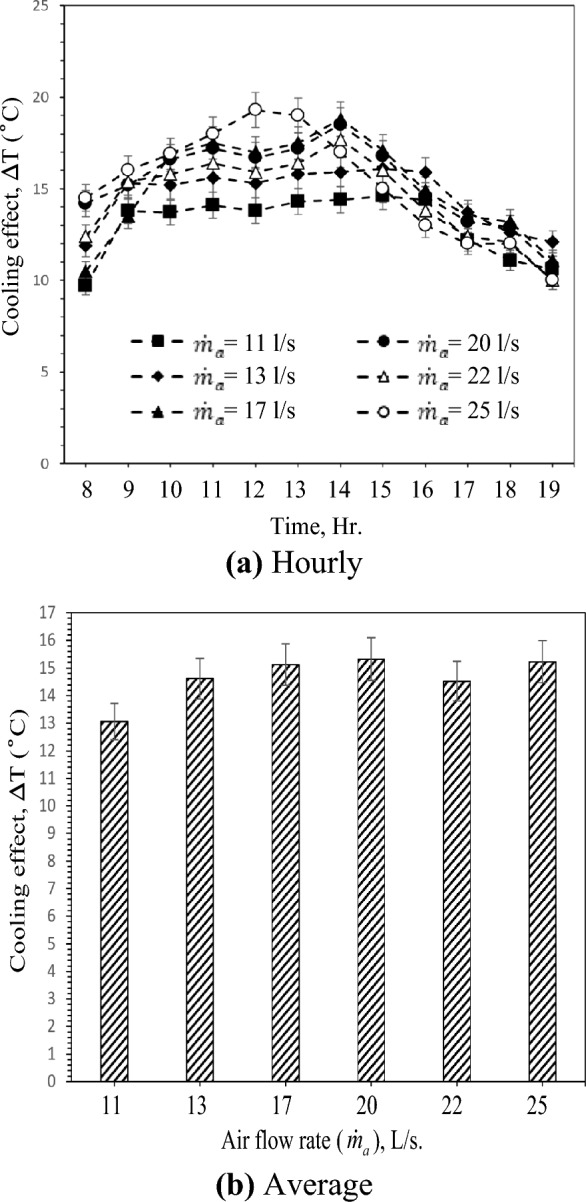
Hourly and average variation of cooling effect with different air flow rates.
In addition, as the temperature difference between the vessels' interior and exterior (soil) increased, the sensible heat exchange increases and the exit air temperature decreases. This result indicated that the system is ideally suited to warmer climates. The hourly cooling effect varied between 9.7 and 14.6 °C, 11.9 and 16.1 °C, 10.5 and 18.8 °C, 14.2 and 18.5 °C, 12.4 and 17.7 °C, and 14.5 and 19.3 °C, for the air flow rates of 11, 13, 17, 20, 22, and 25 L/s, respectively. The average cooling effect variation for different air flow rates is demonstrated in Fig. 4b. Cooling effect values (ΔT) 13.1 °C at 38.9% of inlet air average relative humidity, 14.6 °C at 39.2% of R.H., 15.1 °C at 38.3% of R.H., 15.3 °C at 37.3% of R.H., 14.5 °C at 37.4% of R.H., and 15.2 °C at 36.5% of R.H. for the air flow rates of 11, 13, 17, 20, 22, and 25 L/s, respectively. Furthermore, without the consideration of cooling capacity, decreasing the air flow rate reduced the exhaust air temperature, decreased the fan's energy consumption, and made the system more energy-efficient. Due to the reduced RH, the moisture on the wet surface was more likely to evaporate into the secondary air, resulting in a significant increase in latent heat transfer. Therefore, the proposed system has a more effective cooling effect in an environment with low RH. In other words, the cooling and dehumidification process via the suggested system can reduce the exit air temperature during hot and humid summer in hot arid climates.
Energy efficiency ratio (EER)
EER is the ratio between the cooling capacity and the fan power. It varies based on the heat transfer rate variation, which varies with ambient temperature. Figure 5 shows the hourly and average variation of EER with different air flow rates. EER is affected by operating parameters such as inlet air temperature and RH, solar radiation intensity, and ventilation rate. As stated in the preceding section, increasing the air flow rate increases cooling capacity. Increasing the air flow rate simultaneously increases the fan's output. Figure 5 a depicts the increase in EER with increasing solar radiation intensity and inlet air temperature, followed by a decrease in EER as solar radiation intensity increases towards the end of the day. This indicates that before 10:00 AM, the percent increase in cooling capacity with solar radiation intensity is more significant than the percent increase in fan power with solar radiation intensity and inlet air temperature due to the effect of heat added to the air viscosity and vice versa after 14:00 PM. Figure 5b demonstrates that the EER improves as the flow rate rises for all test cases. This can be ascribed to the increment of the cooling capacity with the increment of the airflow rates, which is a percent higher than the percent of the rise of the fan power. This variation is depicted in Fig. 5a, where EER reaches the highest value of approximately 25,5 at 15:00 PM with an airflow rate of 11 L/s. The lowest EER value is about 7.2 when the inlet and outlet temperatures are measured to be the closest at 19:00 PM with an airflow rate of 25 L/s. In general, EER increases between 09:00 AM and 16:00 PM and reaches its maximum at 14:00 PM as the ambient temperature is maximum related to high soil and water temperatures.
Figure 5.
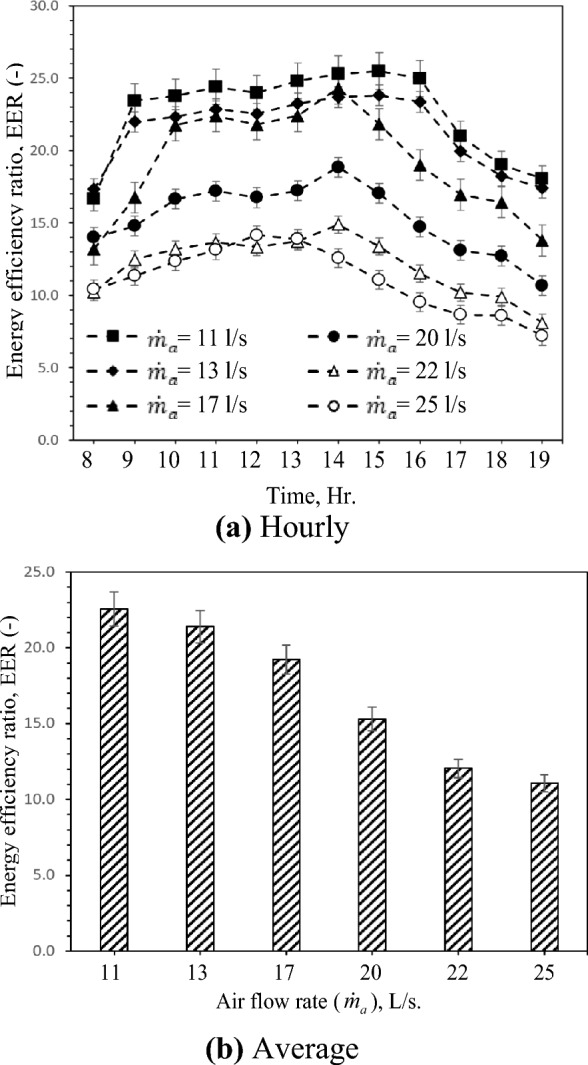
Hourly and average variation of EER with different air flow rates.
The inverse occurs during the remainder of the day when the EER reduces to its lowest point. When ambient temperature variation is considerable, EER variation is also high. As shown in Fig. 5b, the highest and lowest average EER values that can be attained at 11 L/s and 25 L/s air flow rate are 25.6 and 11.7, respectively, i.e., the EER increased by 103.8% when 14 L/s decreased the air flow rate. This is due to the increment and reduction in cooling capacity as the air and water inlet temperatures rise and reduce, respectively.
Wet-bulb or cooling efficiency
As presented in the above sections, The temperature of the air drops and the RH rises as it passes through the clay vessels. It is worth noting that the cooling effect with different air flow rates, as an essential and direct parameter to evaluate the evaporative coolers performance, is not enough to assess the suitability of the proposed system in different regions reasonably due to the different meteorological conditions of the test days. Thus, the regional adaptability of GAHE can be quantitatively analyzed by a performance parameter such as wet bulb efficiency, which is affected more by air humidity than other air parameters. Figure 6 shows the performance evaluation of the GAHE based on wet bulb or cooling efficiency. From Fig. 6a, the results indicate that GAHE has the highest wet-bulb efficiency of 0.95 for 13 L/s air flow rate. Theoretically, if the process is considered adiabatic saturation and the test section is wholly insulated, this efficiency should be 100%. Figure 6 a demonstrates that the efficiency of a wet bulb will exceed 95%. This indicates that the actual process differs slightly from the adiabatic saturation process, particularly at higher inlet water temperature (from the heated soil at 18:00) and low airflow rate. With the increase of inlet air WBD, Increases, as concluded in Fig. 6a,b indicate that with increasing the air flow rate from 11 to 17 L/s, wet bulb efficiency increased, and then the airflow rate was inversely proportional to wet-bulb efficiency. It is due to high heat and mass transfer between air to water and low-pressure drop until 17 L/s air flow rate with high retention time at lower air flow rate.
Figure 6.
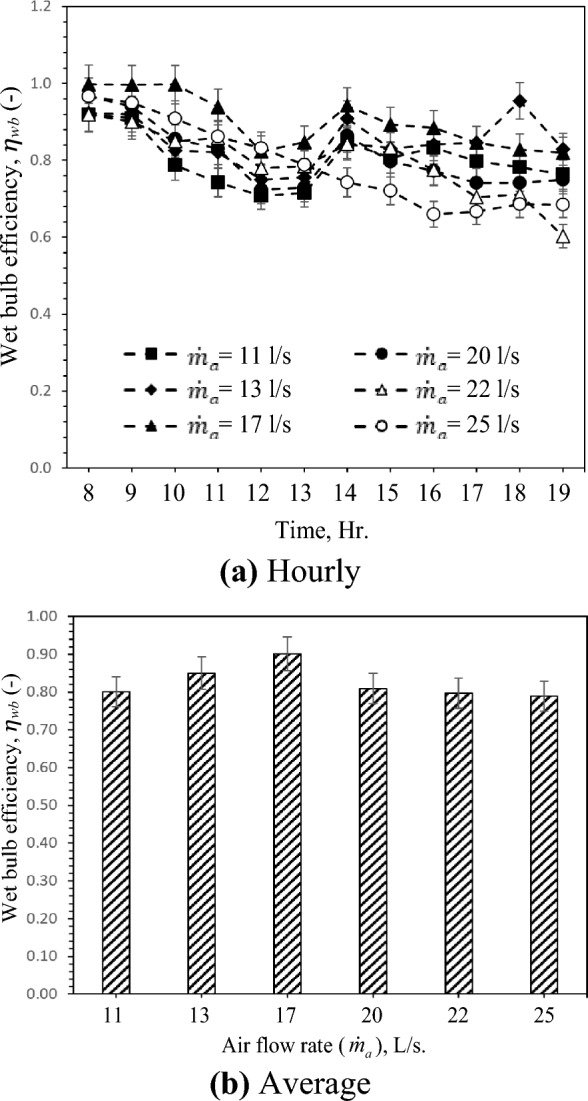
Hourly and average variation of wet-bulb efficiency with different air flow rate.
Dew-point efficiency
The dew point efficiency is determined using Eq. 2 based on air temperatures. From Fig. 7, it can be observed that the dew point efficiency varies qualitatively with the air temperatures approximately as wet bulb efficiency. Based on solar radiation intensity values and the varying inlet air temperatures in the experiment, the dew point efficiency ranges between 40 and 82% as shown in Fig. 7a. Depending on air humidity, the dew point efficiency varies with the increased inlet air temperature for all test cases. The evolution of the average dew point efficiency is shown in Fig. 7b as a function of the airflow rate. Inspection of this Fig shows that the dew point efficiency increases gradually with the increase of the airflow rate, and it is more pronounced at 17 L/s. In fact, the increment of the airflow rate, as discussed above, enhances evaporative cooling. After airflow reaches 17 L/s, this Fig shows the dew-point efficiency decreasing with the increase of the airflow rate in three rest flow rate values: 20 L/s, 22 L/s, and 25 L/s. This is because the inlet air parameters such as temperature and humidity and water temperature according to soil temperature play a critical role in temperature reduction affecting dew-point efficiency. The maximum and minimum average dew-point efficiency are 64% and 58% at 17 L/s and 22 L/s respectively.
Figure 7.
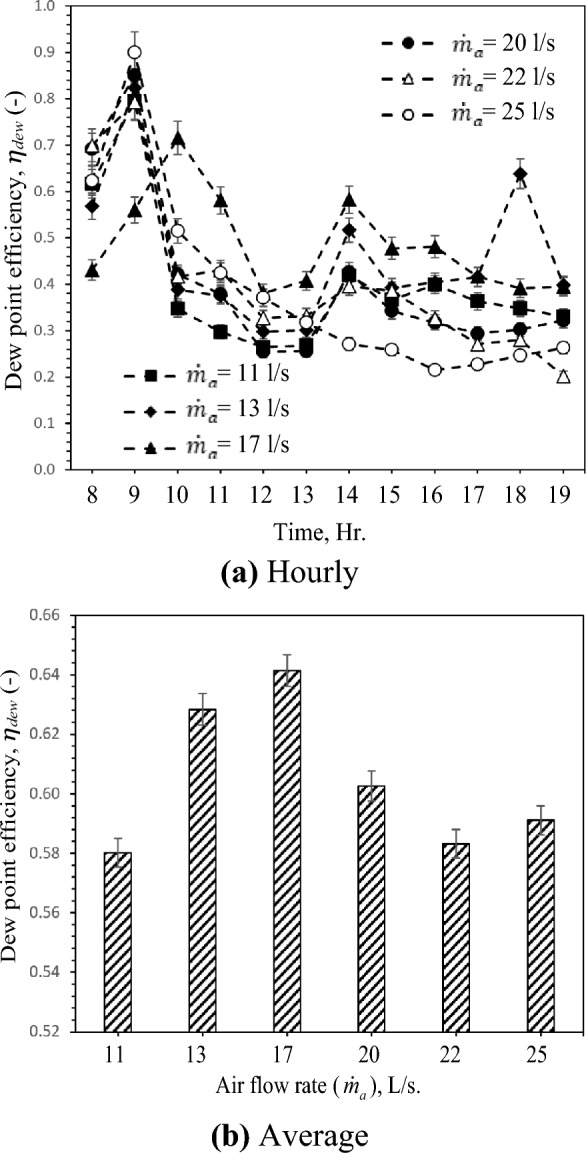
Hourly and average variation of dew-point with different air flow rates.
Water evaporation rate (WER)
As mentioned in previous sections, the evaporative cooling process involves mainly the cooling of air by means of rejecting the heat through the evaporation of water. The water evaporation rate (WER) increased significantly with increasing inlet air and water temperature across all experimental test cases. Still, this increase is faster between 09:00 AM and 14:00 PM, with the solar radiation intensity and soil temperature growth in this period. Then WER decreased gradually with decreasing inlet air temperature based on solar radiation intensity, as shown in Fig. 8a,b also indicates that the increase of the WER and the evaporation rate increased the airflow rate. These can be ascribed to the increment in air temperature drop and humidity increase. Also, the mass transfer coefficients are a function of air flow rate and air inlet temperature. Similarly, the evaporation rate increases by increasing the air flow rate and air inlet temperature. One can expect from Fig. 8b that the water evaporation rate rises by 182.1% by raising the air flow rate from 11 L/s to 25 L/s.
Figure 8.
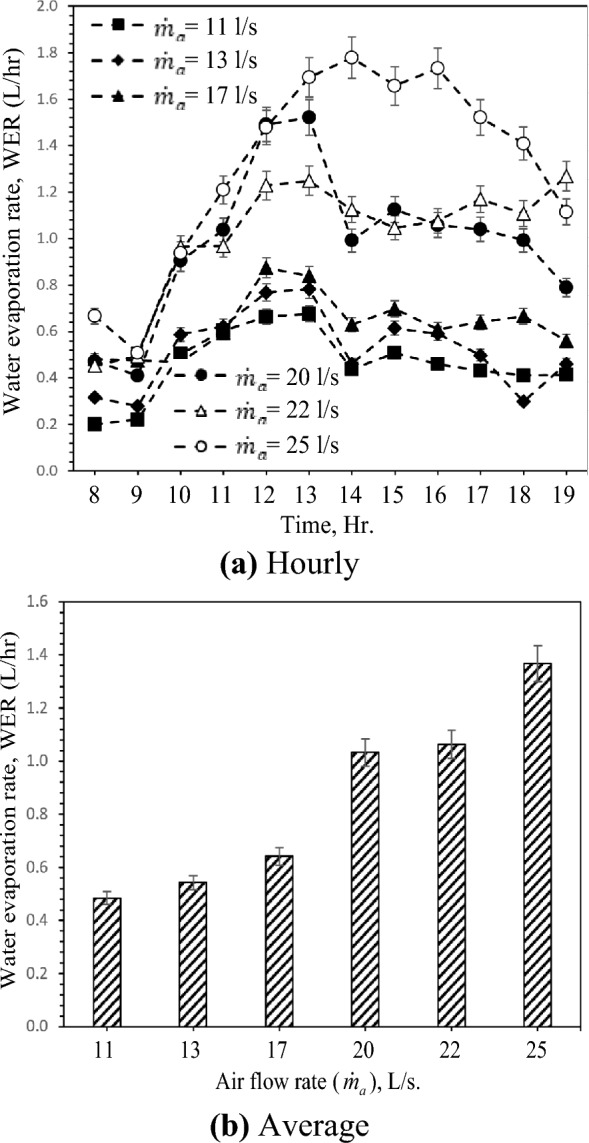
Hourly and average variation of water evaporation rate with different air flow rates.
Specific water evaporation (SWE)
Specific water evaporation (SWE) is one of the evaporative coolers' performance measuring parameters. SWE is the porous clay vessel's evaporation rate per unit surface area divided by the mean temperature difference. Figure 9 shows the airflow rate, air temperature, and water temperature effects on SWE. As can be seen in Fig. 9a, SWE increases by increasing the inlet air temperature, and then SWE decreases with the increase of the inlet air temperature. This behavior is based on water evaporation rate and temperature difference with a constant surface area of the porous clay vessel. So, the two main factors that affect the SWE are air flow rate and solar radiation intensity due to their effects on water evaporation rate and temperature difference, respectively. Figure 9b shows that SWE increases with increasing the flow rate of air which is attributed to the relationship between water evaporation rate and cooling effect discussed in the previous sections. The highest and lowest SWE was found to be 17.8 kg/ °C.m2 and 6.5 kg/ °C.m2 for 25 L/s and 25 L/s air flow rate, respectively. SWE improves by 172.3% with rising 14 L/s in air flow rate and 1.7 L/hr water evaporation rate. Moreover, the maximum value of SWE (see Fig. 9a) is 24.7 kg/ °C.m2 at an air flow rate of 25 L/s.
Figure 9.
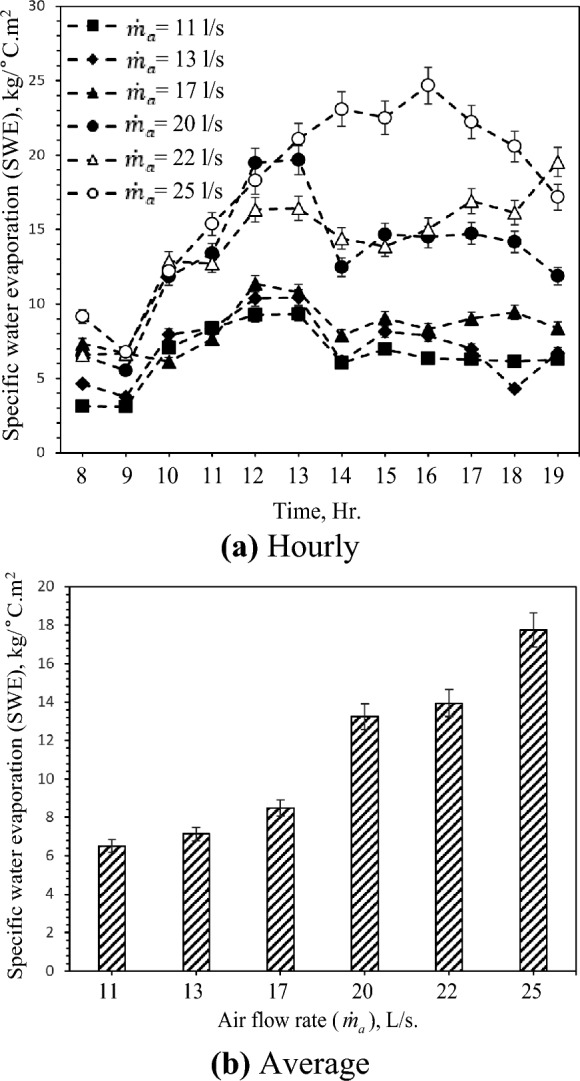
Hourly and average variation of specific water consumption with different air flow rate.
Specific cooling capacity (SCC)
The variation of the specific cooling capacity (SCC) with various air flow rates is shown in Fig. 10. Figure 10a shows the decrease of SCC with the increase of inlet air temperature, respectively. As demonstrated in Fig. 10a, the highest and lowest values of SCC are 0.9 kWh/kg and 0. 2 kWh/kg at 25 L/s and 22 L/s, respectively. As shown in Fig. 10b, SCC increases with the increase of airflow rate until 17 L/s and then decreases to 25 L/s. This is attributed to the increase in air flow rate, which is more dominant than the decrease in air temperature difference and contact time between air and vessel surface due to the growth of air velocity. The reduction of SCC is due to the rise of the water evaporation rate, which has more effect on SCC than the effect of increasing cooling capacity. Furthermore, SCC increased by 20.9% by rising from 11 L/s to 17 L/s of air flow rate and then reduced by 20.4% by growing from 17 L/s to 25 L/s.
Figure 10.
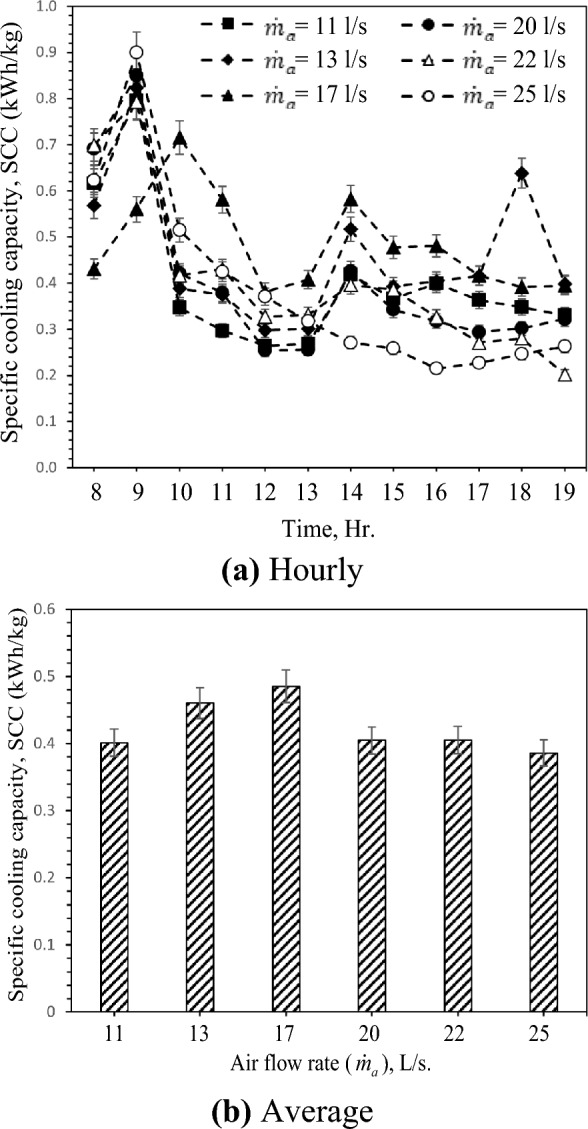
Hourly and average variation of specific cooling capacity with different air flow rate.
Specific total cost (STC)
The specific cost of the GAHE reduces with the increase of the inlet temperature conditions, as shown in Fig. 11. Figure 11a demonstrates that the airflow rate of 25 L/s at 12:00 has the cheapest specific cost, 0.26 USD/W. In this Figure, the parameter variation significantly affects the running and typical costs. The airflow rate increases the running cost (fan power cost) but decreases the regular cost. The cost of the GAHE with an airflow rate of 25 L/s is less than 11 L/s by about 61% due to the higher cooling capacity, as presented in Fig. 11b.
Figure 11.
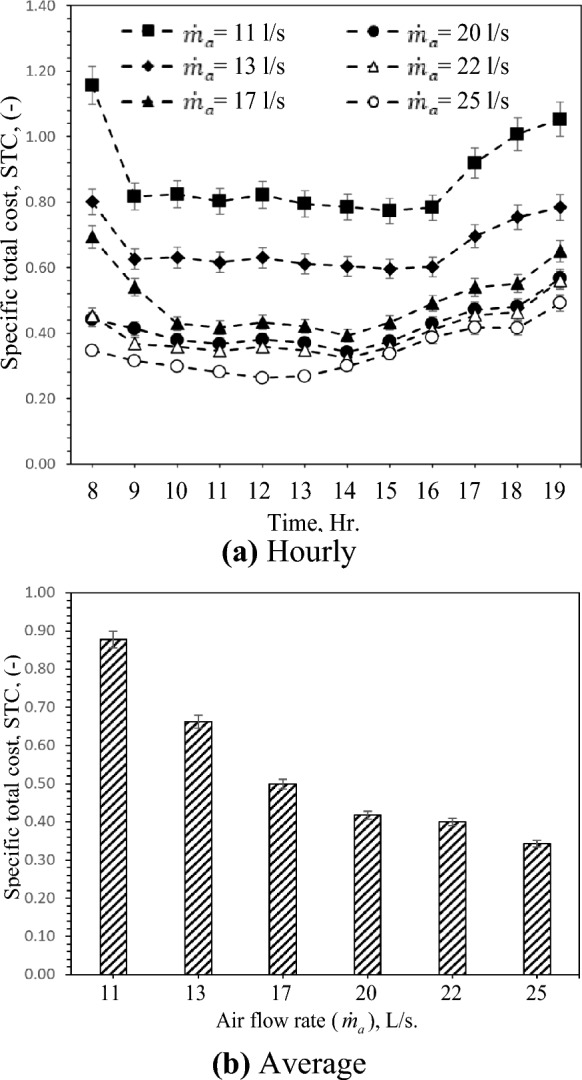
Hourly and average variation of specific total cost with different air flow rates.
Carbon dioxide emissions (CE)
Emissions of carbon dioxide, or CO2 emissions, result from the combustion of fossil fuels to produce energy, such as electricity. The CO2 emission quantity is highly dependent on the operational and geometrical parameters of the GAHE. Figure 12 shows the hourly and average variation of CO2 emission (CE) with different air flow rates during the daytime. As presented in Fig. 12a, the CO2 emission does not fluctuate much with inlet temperature variation for different test cases. The GAHE will produce 0.07 kg CO2 if operated for one hour at 25 L/s air flow rate. As the air flow rate increases from 11 L/s to 25 L/s, the CO2 emission increases from 0.013 kg CO2 to 0.067 kg CO2 with a percentage of about 432.8%, as presented in Fig. 12b. Therefore, the increase in airflow dramatically raises CO2 emissions and negatively impacts the environment. The increased airflow rate improves cooling capacity but decreases EER, which has a negative impact on the environment.
Figure 12.
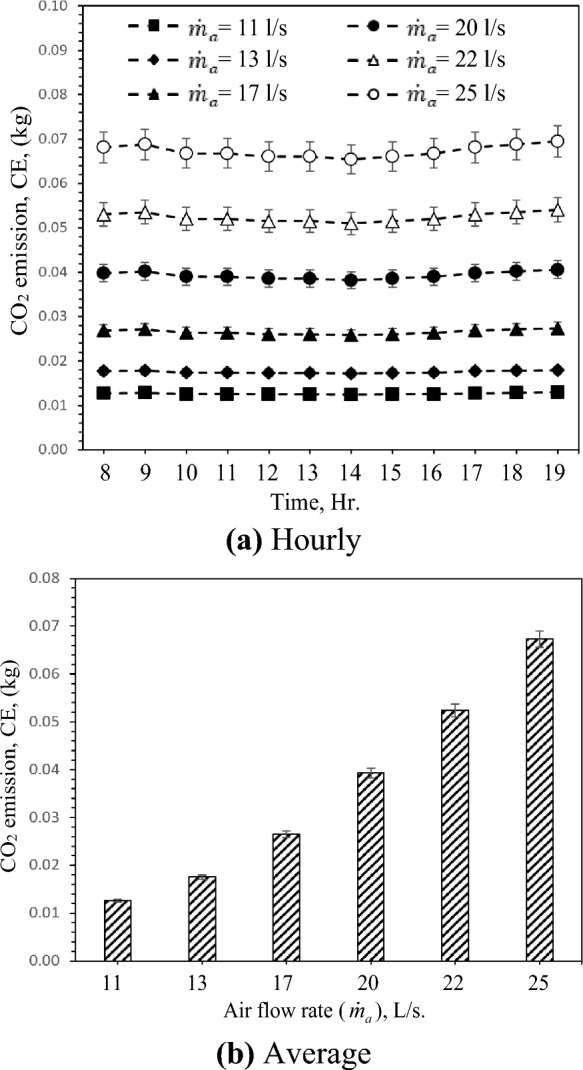
Hourly and average variation of CO2 emission (kg) with different air flow rate.
In hot and arid climates, these results indicate that the GAHE is suitable for achieving an adequate supply temperature for space air conditioning. It is prevalent in the majority of Middle Eastern nations. Adopting porous clay vessels as moist media would provide additional reliability and integration-compatible advantages for building components.
Exergy efficiency ratio
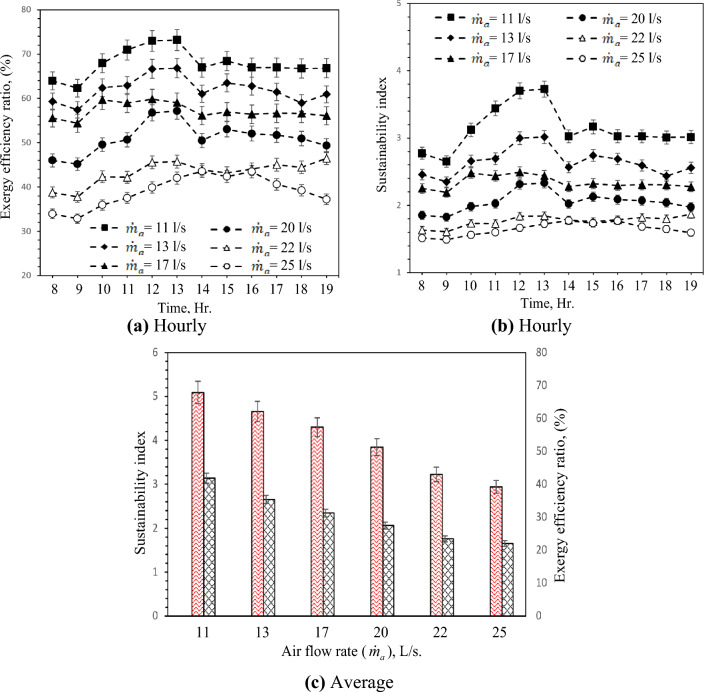
The hourly and average variation of exergy efficiency and sustainability index with different air flow rates are demonstrated in Fig. 13. Exergy efficiency is a viable approach to optimizing the utilization of energy resources, thereby enhancing efficiency and reducing parameters that adversely impact efficiency, such as irreversibility. Consequently, the system's efficiency and sustainability can be enhanced through the application of exergy efficiency59. As shown in Fig. 13a. The flow rate of 11 L/s achieved the highest exergy ratio of about 73% occurring at 13:00 and the lowest exergy ratio at a flow rate of 25 L/s. Also, the higher and lower sustainability index at flow rates 11 and 25 L/s, respectively, as indicated in Fig. 13b. This means the increment in airflow rate decreased the exergy ratio and sustainability index which has a negative impact on the environment. Figure 13c shows the average exergy ratio and sustainability index with different flow rates. The highest exergy ratio at flow rate of 11 L/s with increments of 11.29, 18.96, 32.2, 56.8, and 76.9% at flow rates of 13, 17, 20, 22, and 25 L/s, respectively. The highest sustainability index related to the highest exergy ratio at flow rate of 11 L/s with increments of 23.07, 33.30, 45.45, 77,77, and 88.23% at flow rates of 13, 17, 20, 22, and 25 L/s, respectively.
Figure 13.
Hourly and average variation of exergy efficiency and Sustainability index with different air flow rates.
Comparison of evaporative cooling materials and Earth-Air Heat Exchanger
The cooling capacity of the current proposed system was compared with similar systems, as indicated in Table 7. It is clear that the present system gives an acceptable outcome with a good performance.
Table 7.
Comparison of evaporative cooling materials and Earth-Air Heat Exchanger.
| Authors | Porous materials | Cooling effect, ΔT (°C) | Cooling capacity (kW) | Specific cooling capacity (kWh/kg) |
|---|---|---|---|---|
| Present work | Porous Clay Vessels | 15.2 | 0.456 | 0.38 |
| Laknizi60 | Cellulosic pad | – | 7-.4 | – |
| Wijaksana et al.61 | Gunny sack | 4.6 | 4.6 | – |
| Warke and Deshmukh62 | Cellulose pad | 2.7 | 1.6 | – |
| Dogramacı et al.63 | Eucalyptus fibers | 11.3 | 0.6 | – |
| Chen et al.64 | Polymer hollow fiber | 5.2 | 5 | – |
Conclusion
The performance evaluation of the GAHE was evaluated experimentally under a wide range of ambient air temperature and RH based on the air-cooling effect, wet-bulb, and dew-point efficiencies, energy efficiency ratio, water evaporation rate, specific water evaporation, specific cooling capacity, specific total cost, and CO2 emission rate. The following is a summary of the current comprehensive parametric study's findings:
The GAHE is an acceptable system that would achieve adequate supply temperature for space air conditioning in hot and dry climatic conditions.
The increased airflow rate increases the cooling capacity but decreases EER, leading to a bad environmental effect.
Increasing the air flow rate leads to an increase in the cooling capacity. Energy efficiency ratio (EER) reaches a maximum value of about 25.5 recorded at 15:00 PM with air flow rate = 11 L/s. The lowest value of EER is about 7.2, achieved when the inlet and outlet measured temperatures are the closest at 19:00 PM with air flow rate = 25 L/s.
Increasing the air flow rate from 11 to 17 L/s increased the wet bulb efficiency, and then the airflow rate was inversely proportional to wet-bulb efficiency.
The maximum and minimum average dew-point efficiency are 64% and 58% at 17 L/s and 22 L/s respectively.
The water evaporation rate increases by 182.1%, increasing the air flow rate from 11 L/s to 25 L/s.
The increase in the airflow rate increases the running cost (fan power cost) but decreases the total specific cost.
The increment in airflow rate decreased the exergy ratio and sustainability index which has a negative impact on the environment
Latin symbols
Mass flow rate (kg/s)
- p
Pressure (N/m2)
- T
Temperature (°C)
- W
Power (W)
- E
Energy (J)
- Cc
Capital cost
Emission factor
- Cp
Specific heat (J/kg K)
- Q
Heat (W)
- t
Time (h)
Greek symbols
- η
Efficiency (dimensionless)
- ω
Humidity ratio of humid air (gw/kgda)
- ρ
Density (kg/m3)
Subscripts
- a
Air
Dew point
- out
Outlet
- in
Inlet
- w
Wall
- op
Operation
- d
Dray bulb
- wb
Wet bulb
- c
Sensible
- blower
Blower
Abbreviations
- CE
Carbon dioxide emissions
- EER
Energy efficiency ratio
- GAHE
Ground air heat exchanger
- PCV
Porous carbon vessele
- RH
Relative humidity
- STC
Specific total cost
- SCC
Specific cooling capacity
- SWE
Specific water evaporation
Appendix
All temperatures are directly measured, excluding the wet-bulb temperature, which can be obtained from Eq. (16)65;
| 15 |
where T: Dry bulb temperature (C) and RH%: Relative humidity percentage (%).
The dew point temperature (Tdp) is when the air becomes saturated due to sensible cooling (i.e., without an increase in RH), and condensation occurs at constant pressure. It can be obtained by applying Eq. (17)66;
| 16 |
Humidity ratio of humid air ( in gw/kgda66:
| 17 |
Dry air density () in kg/m367:
| 18 |
Constant pressure specific heat for air () in J/kg.K68:
| 19 |
where (T) is the temperature in K.
Author contributions
E M.S.E., G.B.A., M.I.M.A., N.S., M.A.D. designed the study and conducted the experiments, E M.S.E., G.B.A., M.I.M.A., N.S., M.A.D. provided materials, E M.S.E., G.B.A., M.I.M.A., N.S., M.A.D. were involved in writing-original drat preparation, E M.S.E., G.B.A., M.I.M.A., N.S., M.A.D. was involved in writing-review and editing, E M.S.E., G.B.A., M.I.M.A., N.S., M.A.D. provided resources, supervision, and editing. All authors reviewed the manuscript.
Funding
Open access funding provided by The Science, Technology & Innovation Funding Authority (STDF) in cooperation with The Egyptian Knowledge Bank (EKB).
Data availability
The datasets used and/or analyzed during the current study available from the corresponding author on reasonable request.
Competing interests
The authors declare no competing interests.
Footnotes
Publisher's note
Springer Nature remains neutral with regard to jurisdictional claims in published maps and institutional affiliations.
Contributor Information
Emad M. S. El-Said, Email: emspeng@gmail.com
Mohamed A. Dahab, Email: Mohamed.Dahab@ind.suezuni.edu.eg
References
- 1.Nejat, P., Jomehzadeh, F., Taheri, M. M., Gohari, M. & Abd, M. Z. Majid, A global review of energy consumption, CO2 emissions and policy in the residential sector (with an overview of the top ten CO2 emitting countries). Renew. Sustain. Energy Rev.43, 843–862. 10.1016/j.rser.2014.11.066 (2015). 10.1016/j.rser.2014.11.066 [DOI] [Google Scholar]
- 2.Omer, A. M. Energy, environment and sustainable development. Renew. Sustain. Energy Rev.12, 2265–2300. 10.1016/j.rser.2007.05.001 (2008). 10.1016/j.rser.2007.05.001 [DOI] [Google Scholar]
- 3.Serageldin, A. A., Abdelrahman, A. K. & Ookawara, S. Earth-Air Heat Exchanger thermal performance in Egyptian conditions: Experimental results, mathematical model, and Computational Fluid Dynamics simulation. Energy Convers. Manag.122, 25–38. 10.1016/j.enconman.2016.05.053 (2016). 10.1016/j.enconman.2016.05.053 [DOI] [Google Scholar]
- 4.He, J. & Hoyano, A. Experimental study of cooling effects of a passive evaporative cooling wall constructed of porous ceramics with high water soaking-up ability. Build. Environ.45, 461–472 (2010). 10.1016/j.buildenv.2009.07.002 [DOI] [Google Scholar]
- 5.Khemakhem, S. & Ben Amar, R. Grafting of fluoroalkylsilanes on microfiltration Tunisian clay membrane. Ceram. Int.37, 3323–3328. 10.1016/j.ceramint.2011.04.128 (2011). 10.1016/j.ceramint.2011.04.128 [DOI] [Google Scholar]
- 6.Khemakhem, S. & Ben Amar, R. Modification of Tunisian clay membrane surface by silane grafting: Application for desalination with Air Gap Membrane Distillation process, Colloids Surfaces A Physicochem. Eng. Asp.387, 79–85. 10.1016/j.colsurfa.2011.07.033 (2011). 10.1016/j.colsurfa.2011.07.033 [DOI] [Google Scholar]
- 7.Das, R., Sondhi, K., Majumdar, S. & Sarkar, S. Development of hydrophobic clay–alumina based capillary membrane for desalination of brine by membrane distillation. J. Asian Ceram. Soc.4, 243–251 (2016). 10.1016/j.jascer.2016.04.004 [DOI] [Google Scholar]
- 8.Katsuki, H. et al. Eco-friendly self-cooling system of porous onggi ceramic plate by evaporation of absorbed water. J. Korean Ceram. Soc.55, 153–159 (2018). 10.4191/kcers.2018.55.2.05 [DOI] [Google Scholar]
- 9.Sellami, K. et al. Direct evaporative cooling performance of ambient air using a ceramic wet porous layer. Chem. Eng. Res. Des.142, 225–236 (2019). 10.1016/j.cherd.2018.12.009 [DOI] [Google Scholar]
- 10.Kanzari, M., Boukhanouf, R. & Ibrahim, H. G. Mathematical modeling of a sub-wet bulb temperature evaporative cooling using porous ceramic materials. Int. J. Ind. Manuf. Eng.7, 900–906 (2013). [Google Scholar]
- 11.Wang, F., Sun, T., Huang, X., Chen, Y. & Yang, H. Experimental research on a novel porous ceramic tube type indirect evaporative cooler. Appl. Therm. Eng.125, 1191–1199. 10.1016/j.applthermaleng.2017.07.111 (2017). 10.1016/j.applthermaleng.2017.07.111 [DOI] [Google Scholar]
- 12.Wang, S., Yue, L. & Wang, F. Characteristics of heat and water transfer through a porous plate. Int. J. Heat Mass Transf.119, 295–302. 10.1016/j.ijheatmasstransfer.2017.11.082 (2018). 10.1016/j.ijheatmasstransfer.2017.11.082 [DOI] [Google Scholar]
- 13.Rehman, D., McGarrigle, E., Glicksman, L. & Verploegen, E. A heat and mass transport model of clay pot evaporative coolers for vegetable storage. Int. J. Heat Mass Transf.162, 120270. 10.1016/j.ijheatmasstransfer.2020.120270 (2020). 10.1016/j.ijheatmasstransfer.2020.120270 [DOI] [Google Scholar]
- 14.Amer, O., Boukhanouf, R. & Ibrahim, H. G. A review of evaporative cooling technologies. Int. J. Environ. Sci. Dev.6, 111 (2015). 10.7763/IJESD.2015.V6.571 [DOI] [Google Scholar]
- 15.Doğramacı, P. A. & Aydın, D. Comparative experimental investigation of novel organic materials for direct evaporative cooling applications in hot-dry climate. J. Build. Eng.30, 101240. 10.1016/j.jobe.2020.101240 (2020). 10.1016/j.jobe.2020.101240 [DOI] [Google Scholar]
- 16.Ibrahim, H., Choorapulakka, A., Alharb, A. Approach for Integrating Indirect Evaporative Cooling System into Contemporary Architecture, (2014).
- 17.Ndukwu, M. C. & Manuwa, S. I. Review of research and application of evaporative cooling in preservation of fresh agricultural produce. Int. J. Agric. Biol. Eng.7, 85–102 (2014). [Google Scholar]
- 18.Chijioke, O. V. Review on evaporative cooling systems. Greener J. Sci. Eng. Technol. Res.7, 2–20 (2017). [Google Scholar]
- 19.Borasiya, M. D., Kher, P. N. & Atodariya, V. H. A Review on Potential of Indirect Evaporative Cooling System. Int. J. Sci. Technol. Eng.3, 170–175 (2017). [Google Scholar]
- 20.Kale, P. K., Deokar, V. N., Kalel, V. R. & Jagtap, T. D. A review on design and development of three in one air cooling system. Int. Res. J. Eng. Technol.10(14), 1032–1035 (2017). [Google Scholar]
- 21.Maurya, R., Shrivastav, N. & Shrivastava, V. Performance and analysis of an evaporative cooling system: A review. Int. J. Sci. Eng. Res.5(10), 1 (2014). [Google Scholar]
- 22.Mehere, S. V., Mudafale, K. P. & Prayagi, S. V. Review of direct evaporative cooling system with its applications. Int. J. Eng. Res. Gen. Sci.2, 995–999 (2014). [Google Scholar]
- 23.Bora, Y. R., Bhosale, S. D., Ghandi, K. N. & Ghandi, T. S. Performance improvement techniques for evaporative air cooler–a review. Int. J. Eng. Res. Technol.6, 379–382 (2017). [Google Scholar]
- 24.Agrawal, K. K., Das Agrawal, G., Misra, R., Bhardwaj, M. & Jamuwa, D. K. A review on effect of geometrical, flow and soil properties on the performance of Earth air tunnel heat exchanger. Energy Build.176, 120–138. 10.1016/j.enbuild.2018.07.035 (2018). 10.1016/j.enbuild.2018.07.035 [DOI] [Google Scholar]
- 25.Soni, S. K., Pandey, M. & Bartaria, V. N. Ground coupled heat exchangers: A review and applications. Renew. Sustain. Energy Rev.47, 83–92. 10.1016/j.rser.2015.03.014 (2015). 10.1016/j.rser.2015.03.014 [DOI] [Google Scholar]
- 26.Lekhal, M. C., Belarbi, R., Mokhtari, A. M., Benzaama, M.-H. & Bennacer, R. Thermal performance of a residential house equipped with a combined system: A direct solar floor and an earth–air heat exchanger. Sustain. Cities Soc.40, 534–545. 10.1016/j.scs.2018.05.012 (2018). 10.1016/j.scs.2018.05.012 [DOI] [Google Scholar]
- 27.Do, S. L., Baltazar, J. C. & Haberl, J. Potential cooling savings from a ground-coupled return-air duct system for residential buildings in hot and humid climates. Energy Build.103, 206–215. 10.1016/j.enbuild.2015.05.043 (2015). 10.1016/j.enbuild.2015.05.043 [DOI] [Google Scholar]
- 28.Al-Helal, I. et al. Geothermal energy potential for cooling/heating greenhouses in hot arid regions. Atmos. Basel.13, 105 (2022). [Google Scholar]
- 29.Mathur, A., Priyam, S., Mathur, G. D. & Agrawal, J. Mathur, Comparative study of straight and spiral earth air tunnel heat exchanger system operated in cooling and heating modes. Renew. Energy.108, 474–487. 10.1016/j.renene.2017.03.001 (2017). 10.1016/j.renene.2017.03.001 [DOI] [Google Scholar]
- 30.Soni, S. K., Pandey, M. & Bartaria, V. N. Energy metrics of a hybrid earth air heat exchanger system for summer cooling requirements. Energy Build.129, 1–8. 10.1016/j.enbuild.2016.07.063 (2016). 10.1016/j.enbuild.2016.07.063 [DOI] [Google Scholar]
- 31.Tiwari, G. N., Singh, V., Joshi, P., Deo, A. & Gupta, A. Design of an earth air heat exchanger (EAHE) for climatic condition of Chennai India. Open Environ. Sci.30(8), 1 (2014). [Google Scholar]
- 32.Karabacak, R. et al. Experimental investigation of the cooling performance of a ground source heat pump system in Denizli, Turkey. Int. J. Refrig.34, 454–465. 10.1016/j.ijrefrig.2010.10.009 (2011). 10.1016/j.ijrefrig.2010.10.009 [DOI] [Google Scholar]
- 33.Wijewardane, S. Inventions, innovations, and new technologies: Paints and coatings for passive cooling. Sol. Compass.3–4, 100032. 10.1016/j.solcom.2022.100032 (2022). 10.1016/j.solcom.2022.100032 [DOI] [Google Scholar]
- 34.Ozgener, O. & Ozgener, L. Exergoeconomic analysis of an underground air tunnel system for greenhouse cooling system. Int. J. Refrig.33, 995–1005. 10.1016/j.ijrefrig.2010.02.008 (2010). 10.1016/j.ijrefrig.2010.02.008 [DOI] [Google Scholar]
- 35.Li, H., Yu, Y., Niu, F., Shafik, M. & Chen, B. Performance of a coupled cooling system with earth-to-air heat exchanger and solar chimney. Renew. Energy.62, 468–477. 10.1016/j.renene.2013.08.008 (2014). 10.1016/j.renene.2013.08.008 [DOI] [Google Scholar]
- 36.Yang, Q., Hu, Z., Zhou, Z., Zhang, Y., Wang, B., Wang, Y. Experimental and numerical study on the cooling performance of a new earth-air heat exchanger (EAHE) system with a supply air static pressure chamber, in: E3S Web Conf., EDP Sciences, 1019 (2022)
- 37.Li, H., Ni, L., Yao, Y. & Sun, C. Experimental investigation on the cooling performance of an Earth to Air Heat Exchanger (EAHE) equipped with an irrigation system to adjust soil moisture. Energy Build.196, 280–292. 10.1016/j.enbuild.2019.05.007 (2019). 10.1016/j.enbuild.2019.05.007 [DOI] [Google Scholar]
- 38.Pfafferott, J. Evaluation of earth-to-air heat exchangers with a standardised method to calculate energy efficiency. Energy Build.35, 971–983. 10.1016/S0378-7788(03)00055-0 (2003). 10.1016/S0378-7788(03)00055-0 [DOI] [Google Scholar]
- 39.Wagner, R., Beisel, S., Spieler, A., Gerber, A., Vajen, K. Measurement, modeling and simulation of an earth-to-air heat exchanger in Marburg (Germany), in: ISES Eur. Sol. Congr. Kopenhagen, Dänemark, Citeseer, (2000).
- 40.Burton, S. Coolhouse-Energie Demonstration Project NNE5, Final technical report, (2004).
- 41.Sutcu, M., del Coz Díaz, J. J., Rabanal, F. P. Á., Gencel, O. & Akkurt, S. Thermal performance optimization of hollow clay bricks made up of paper waste. Energy Build.75, 96–108 (2014). 10.1016/j.enbuild.2014.02.006 [DOI] [Google Scholar]
- 42.Rajaseenivasan, T. & Srithar, K. Performance investigation on solar still with circular and square fins in basin with CO2 mitigation and economic analysis. Desalination.380, 66–74 (2016). 10.1016/j.desal.2015.11.025 [DOI] [Google Scholar]
- 43.Rashidi, S., Esfahani, J. A. & Rashidi, A. A review on the applications of porous materials in solar energy systems. Renew. Sustain. Energy Rev.73, 1198–1210 (2017). 10.1016/j.rser.2017.02.028 [DOI] [Google Scholar]
- 44.Chauhan, R. & Thakur, N. S. Investigation of the thermohydraulic performance of impinging jet solar air heater. Energy.68, 255–261 (2014). 10.1016/j.energy.2014.02.059 [DOI] [Google Scholar]
- 45.Matheswaran, M. M., Arjunan, T. V. & Somasundaram, D. Analytical investigation of solar air heater with jet impingement using energy and exergy analysis. Sol. Energy.161, 25–37 (2018). 10.1016/j.solener.2017.12.036 [DOI] [Google Scholar]
- 46.Lertsatitthanakorn, C., Rerngwongwitaya, S. & Soponronnarit, S. Field experiments and economic evaluation of an evaporative cooling system in a silkworm rearing house. Biosyst. Eng.93, 213–219 (2006). 10.1016/j.biosystemseng.2005.12.003 [DOI] [Google Scholar]
- 47.Nada, S. A., Elattar, H. F., Mahmoud, M. A. & Fouda, A. Performance enhancement and heat and mass transfer characteristics of direct evaporative building free cooling using corrugated cellulose papers. Energy.211, 118678 (2020). 10.1016/j.energy.2020.118678 [DOI] [Google Scholar]
- 48.Shahsavar, A. & Khanmohammadi, S. Feasibility of a hybrid BIPV/T and thermal wheel system for exhaust air heat recovery: Energy and exergy assessment and multi-objective optimization. Appl. Therm. Eng.146, 104–122 (2019). 10.1016/j.applthermaleng.2018.09.101 [DOI] [Google Scholar]
- 49.Shahsavar, A., Ameri, M., Gholampour, M. Energy and exergy analysis of a photovoltaic-thermal collector with natural air flow, (2012).
- 50.Zeitoun, W., Lin, J. & Siroux, M. Energetic and exergetic analyses of an experimental Earth-Air Heat Exchanger in the northeast of France. Energies.16, 1542 (2023). 10.3390/en16031542 [DOI] [Google Scholar]
- 51.Ozgener, O. & Ozgener, L. Exergetic assessment of EAHEs for building heating in Turkey: A greenhouse case study. Energy Policy.38, 5141–5150 (2010). 10.1016/j.enpol.2010.04.047 [DOI] [Google Scholar]
- 52.Misra, R. et al. Field investigations to determine the thermal performance of earth air tunnel heat exchanger with dry and wet soil: Energy and exergetic analysis. Energy Build.171, 107–115 (2018). 10.1016/j.enbuild.2018.04.026 [DOI] [Google Scholar]
- 53.Dincer, I. & Sahin, A. Z. A new model for thermodynamic analysis of a drying process. Int. J. Heat Mass Transf.47, 645–652 (2004). 10.1016/j.ijheatmasstransfer.2003.08.013 [DOI] [Google Scholar]
- 54.Rosen, M. A., Dincer, I. & Kanoglu, M. Role of exergy in increasing efficiency and sustainability and reducing environmental impact. Energy Policy.36, 128–137 (2008). 10.1016/j.enpol.2007.09.006 [DOI] [Google Scholar]
- 55.Kashyap, S., Sarkar, J. & Kumar, A. Exergy, economic, environmental and sustainability analyses of possible regenerative evaporative cooling device topologies. Build. Environ.180, 107033 (2020). 10.1016/j.buildenv.2020.107033 [DOI] [Google Scholar]
- 56.Caliskan, H., Dincer, I. & Hepbasli, A. Exergoeconomic, enviroeconomic and sustainability analyses of a novel air cooler. Energy Build.55, 747–756 (2012). 10.1016/j.enbuild.2012.03.024 [DOI] [Google Scholar]
- 57.Abdallah, L. & El-Shennawy, T. Evaluation of CO2 emission from Egypt’s future power plants. Euro-Mediterranean J. Environ. Integr.5, 49 (2020). 10.1007/s41207-020-00184-w [DOI] [PMC free article] [PubMed] [Google Scholar]
- 58.Holman, J.P. Experimental methods for engineers, (2012).
- 59.Öztürk, A., Doğan, B. & Yeşilyurt, M. Energy, exergy, sustainability, and economic analyses of a grid-connected solar power plant consisting of bifacial PV modules with solar tracking system on a single axis. Sci. Technol. Energy Transit.78, 1 (2023). 10.2516/stet/2023015 [DOI] [Google Scholar]
- 60.Laknizi, A. et al. Performance analysis and optimal parameters of a direct evaporative pad cooling system under the climate conditions of Morocco. Case Stud. Therm. Eng.13, 100362. 10.1016/j.csite.2018.11.013 (2019). 10.1016/j.csite.2018.11.013 [DOI] [Google Scholar]
- 61.Wijaksana, H., Winaya, I., Sucipta, M., Ghurri, A., Suarnadwipa, N. The investigation on cooling capacity and CELdek material pad classification of evaporative cooling pad system using different pad material with water temperature and water discharge variations, in: AIP Conf. Proc., AIP Publishing, (2018).
- 62.Warke, D. A. & Deshmukh, S. J. Experimental analysis of cellulose cooling pads used in evaporative coolers. Int. J. Energy Sci. Eng.3, 37–43 (2017). [Google Scholar]
- 63.Doğramacı, P. A. et al. Experimental study of the potential of eucalyptus fibres for evaporative cooling. Renew. Energy.131, 250–260. 10.1016/j.renene.2018.07.005 (2019). 10.1016/j.renene.2018.07.005 [DOI] [Google Scholar]
- 64.Chen, X. et al. A novel evaporative cooling system with a polymer hollow fibre spindle. Appl. Therm. Eng.132, 665–675. 10.1016/j.applthermaleng.2018.01.005 (2018). 10.1016/j.applthermaleng.2018.01.005 [DOI] [Google Scholar]
- 65.Stull, R. Wet-bulb temperature from relative humidity and air temperature. J. Appl. Meteorol. Climatol.50, 2267–2269 (2011). 10.1175/JAMC-D-11-0143.1 [DOI] [Google Scholar]
- 66.Sensirion, A.G. Introduction to humidity-basic principles on physics of water vapor, Appl. Note. (2014)
- 67.Company, C.R. Handbook of tables for applied engineering science, Chemical Rubber Company, (1970).
- 68.Holman, J.P. Heat transfer, McGraw Hill, (1986).
Associated Data
This section collects any data citations, data availability statements, or supplementary materials included in this article.
Data Availability Statement
The datasets used and/or analyzed during the current study available from the corresponding author on reasonable request.


