Abstract
The Island Mass Effect (IME) around the Maldives is responsible for intense blooms with distinct seasonal patterns. These blooms sustain the fishing industry of the archipelagic nation, a vital source of income that occupies about 30% of the population. Through high resolution ocean simulations, we explore the physical processes responsible for the increased productivity and its observed variability, and their sensitivity to changes in land distribution. Year-round the frictional break of the currents in the presence of shallow bathymetry produces a strong vertical shear in the flow that favors vertical mixing, independently of the currents direction. The impact of this mixing is visible at the ocean surface during March and April, when the mixed-layer is shallow and the ocean currents are generally weak. A different mechanism than observed in spring modulates the IME during the monsoon seasons, in both winter and summer, when the zonal currents forced by the strong winds cross the archipelago: the flow accelerates while squeezing between the atolls, giving rise to intense wakes, and strong upwelling originates in the lees in response to the kilometer-scale flow divergence. This upwelling creates an asymmetric cooling signal in the lee of the islands and obfuscates the effects of the enhanced vertical mixing. The land reclamation efforts being planned on some of the islands may undercut the upwelling that drives the blooms during the monsoon seasons.
Keywords: IME, Upwelling, Maldives, Kilometer-scale
Subject terms: Physical oceanography, Environmental sciences
Introduction
The Island Mass Effect (IME) - the enhancement in primary productivity often observed around small islands—has been known for over 60 years1 and has been detected worldwide2–7. Islands act as oases, increasing long-term phytoplankton biomass up to 86% compared to offshore conditions5, and the IME refers to a wide spectrum of biogeochemical and physical processes that enhance Net Primary Productivity (NPP). The IME generally results from physical mechanisms that increase ocean vertical exchanges around islands and, consequently, the input of nutrient into the euphotic layer, as recently reviewed by8. Additionally, several land-born factors, such as nutrient intake from island runoff9, groundwater discharge10,11 and other human activities5,12 can increase nearshore nutrient concentrations. The IME is an important phenomenon that drives biodiversity, maintains trophic structure and sustains fisheries in otherwise oligotrophic tropical oceans. Understanding what drives the IME at specific locations is key to develop sensible management plans in light of climate change and other anthropogenic stressors that affect marine ecosystems.
The IME is prominent around the Maldives13–16, an atoll nation located in the center of the Laccadive-Chagos ridge in the central Indian Ocean, south-west of the tip of India, but changes in intensity and location depending on the season considered. The Maldives is a long but narrow archipelago, ranging in longitude from 72° to 73°E, and stretching for 860 km from a latitude about 7°N to the equator. It has 26 atolls and more than one thousand coral islands, making it one of the largest atoll groups, but also one of the least studied17. The very low altitude of the islands, about 5 m over the sea level, makes the Maldives a country at great risk for the consequences of climate change, especially sea level rise and coastal surges18. The health of the coral reefs, which are the physical basis of the Maldives, and their productivity are of national strategic concern19. The Maldivian reefs are indeed home to a healthy ecosystem that includes snappers, groupers, emperors, reef jacks, reef sharks, lobsters and clams, and, further offshore, tuna, fueling a productive fishing industry, which is the second largest in the Maldives, second only to tourism, and employs a large portion of the Maldivian workforce.
The archipelago is located in the monsoon wind regimes of the Indian Ocean and is characterized by an increase in biological productivity with a seasonally varying longitudinal asymmetry20 that follows that of the winds. Winds reverse direction twice a year, following the monsoon cycle, and force strong reversing currents. The wet monsoon dominates from May to November, with winds blowing from the southwest (SW) and the Southwest Monsoon Current hitting the Archipelago. A dry season characterizes winter and early spring, from December to March, when the zonal flow changes direction and lighter winds from the northeast (NE), together with the Northeast Monsoon Current, cross the islands. The bathymetry of the archipelago stretches for several thousands of km and provides a steep barrier to the incoming flow. In spring, the warmest season of the year, the interaction between currents and bottom topography is responsible for a cooling of about of the waters around the islands with respect to the offshore ones. Enhanced vertical mixing due to shear instabilities is responsible for this local temperature decrease that largely reduces the frequency and impact of coral bleaching, as shown by21. In that study, the authors investigated the process that allowed the corals in the Maldives to withstand several intense El Niño events in the past two decades. Here, instead, we explore the interactions between the oceanic circulation and the small coralline islands that cause a seasonally varying IME. We investigate the physical processes that enhance vertical exchanges around the Maldives Archipelago in different seasons, accounting for the complex topography of the islands, each less than a kilometer in magnitude and organized in almost closed atolls of larger diameter and few narrow passages. We use satellite observations augmented by model output from a submesoscale permitting regional ocean simulation with a lateral resolution of about 1.6 km and a temporal resolution of 1 hour. The model velocity field is coupled with a particle tracking model to resolve the three-dimensional transport pathways that bring nutrients into the sunlit layer. In light of our analysis, we also perform sensitivity simulations to evaluate the possible impact of land reclamation efforts that are ongoing in the islands.
Data and methods
In this work, we used sea surface temperature (SST) observations from the Group for High Resolution Sea Surface Temperature (GHRSST) Level 422 (GHRSST-OSTIA), available daily at 0.054° spatial resolution. GHRSST is based on SST measured by multiple sensors, including the Advanced Very High Resolution Radiometers (AVHRR), the Advanced Along Track Scanning Radiometer (AATSR), the Spinning Enhanced Visible and Infrared Imager (SEVIRI), the Advanced Microwave Scanning Radiometer-EOS (AMSRE) and the Tropical Rainfall Measuring Mission Microwave Imager (TMI). The satellite data are blended with in-situ observations, ships, and buoys (both drifters and moorings).
Following the methodology introduced in8, local temperature structures around the islands were identified using the SST Laplacian. This quantity allows to highlight the small-scale spatial variations while simultaneously reducing the large scale patterns signature, and characterizes local temperature surface minima (strong positive Laplacian) and maxima (strong negative Laplacian) (see8 for an in depth description of the method).
The NPP fields were obtained from http://sites.science.oregonstate.edu/ocean.productivity and estimated according to the Vertically Generalized Production Model (VGPM) algorithm from23. The VGPM is a “chlorophyll-based” model that estimates net primary production from chlorophyll using a temperature-dependent description of chlorophyll-specific photosynthetic efficiency. In VGPM, the NPP is therefore a function of chlorophyll, available light, and photosynthetic efficiency. The product is based on MODIS24 chlorophyll and temperature data. The available light is represented by the depth of the euphotic zone, which is estimated from a model developed by25. The data have a nominal resolution of 0.083°x 0.083°.
We also used surface currents from OSCAR26 dataset, provided with a nominal resolution of 0.25°. The currents are derived from satellite retrieved SST and SSH products, averaged in the upper 30 meters of the water column and merged with 10 m winds from ERA5, using quasi linear and steady flow equations27.
To characterize the physical processes at the origin of the IME around the Maldives, we conducted a numerical investigation using CROCO (Coastal and Regional Ocean COmmunity model), a publicly available oceanic modeling system built upon ROMS (Regional Ocean Modelling System) in its Agrif version28. To resolve the complex structures of the atolls, we nested a (child) domain with 1/64°of horizontal resolution and 60 vertical sigma levels into a parent simulation at 1/20°horizontal resolution using offline nesting techniques. The nested domain covers the Maldives Archipelago and the surrounding ocean from 70.5 to 75.5°E in longitude and from 3.3 to 9.5°N in latitude. The parent domain spanned a wider region from 67 to 79°E in longitude and from − 11.6°S to 16°N in latitude, and is initialized and nudged at the open ocean boundaries to fields from SODA329, which has a resolution of 0.25 × 0.25°degree and 50 vertical levels. Three-hourly and hourly ERA530 heat, momentum and freshwater (precipitation - evaporation) fluxes, with 0.25 × 0.25°resolution, forced the circulation at the surface in the parent and nested grids, respectively. We simulated 2013, a neutral ENSO (El Niño Southern Oscillation) year. The parent grid simulation underwent a spin-up under climatological forcing and boundary conditions to ensure a statistically steady state in CROCO before proceeding with the 2013 simulation.
Lagrangian passive particles were then advected off-line using ARIANE31 applied to the hourly-averaged CROCO Eulerian velocity field of the nested simulation. Particles were deployed in regularly shaped boxes (see Fig. 1) every 12 hours from 2.1° to 7.1°N, to the east and west of the Archipelago. The particles are deployed 5 m above and 5 m below the base of the local mixed layer, at about 25 km offshore of the local bathymetry. The Lagrangian tracking covered the first 15 days of three selected months, representative of different dynamical settings: the months of February and June were chosen as representative of the NE and SW monsoon circulation being characterized by strong and steady monsoonal winds and currents, respectively, and April was chosen as example of a transition month (see Fig. S1 in the SI for the typical winds and fluxes in these months).
Figure 1.
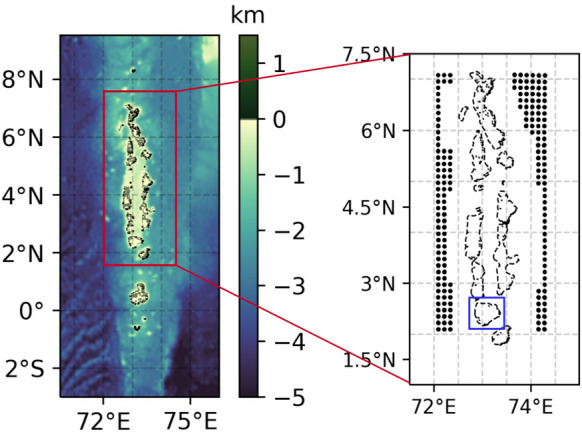
Maldives bathymetry from ETOPO132 and initial particles position at west and east sides of the Archipelago. Marked in blue in the right panel is the atoll of Thaa, that is used as an example in the following analysis.
Results and discussion
The atolls of the Maldives are arranged in two double chains separated by an inner sea, which is deeper than the lagoons (20–80 m) but much shallower than the surrounding ocean (see Fig.1). There are broad and deep channels in between some atolls, where currents energized by the monsoon winds can reach velocities up to 2 m/s. The currents reverse direction following wind changes. During the winter NE monsoon, strong winds blow from north-east (See Fig. S1 in the SI) and the Northeast Monsoon Current hits the Archipelago (Fig. 2G). In March–April, during the transition period between the end of the NE monsoon and the beginning of the SW monsoon, the winds north of the Equator subside and the currents are on average much weaker (see Fig. 2H). In summer, the SW monsoon blows from south-west inducing a strong zonal flow opposite in direction to that of winter, and the Southwest Monsoon Current crosses the islands (Fig. 2I)33. The circulation in the equatorial Maldives is also influenced by semi-annual zonal jets, the so-called Wyrtki jets (WJs34). The WJs flow eastward twice a year, during the transition periods between the summer (April–May) and the winter monsoons (October–November)35. The WJs had been shown to have a dominant role in shaping the equatorial currents circulation and variability36–38.
Figure 2.
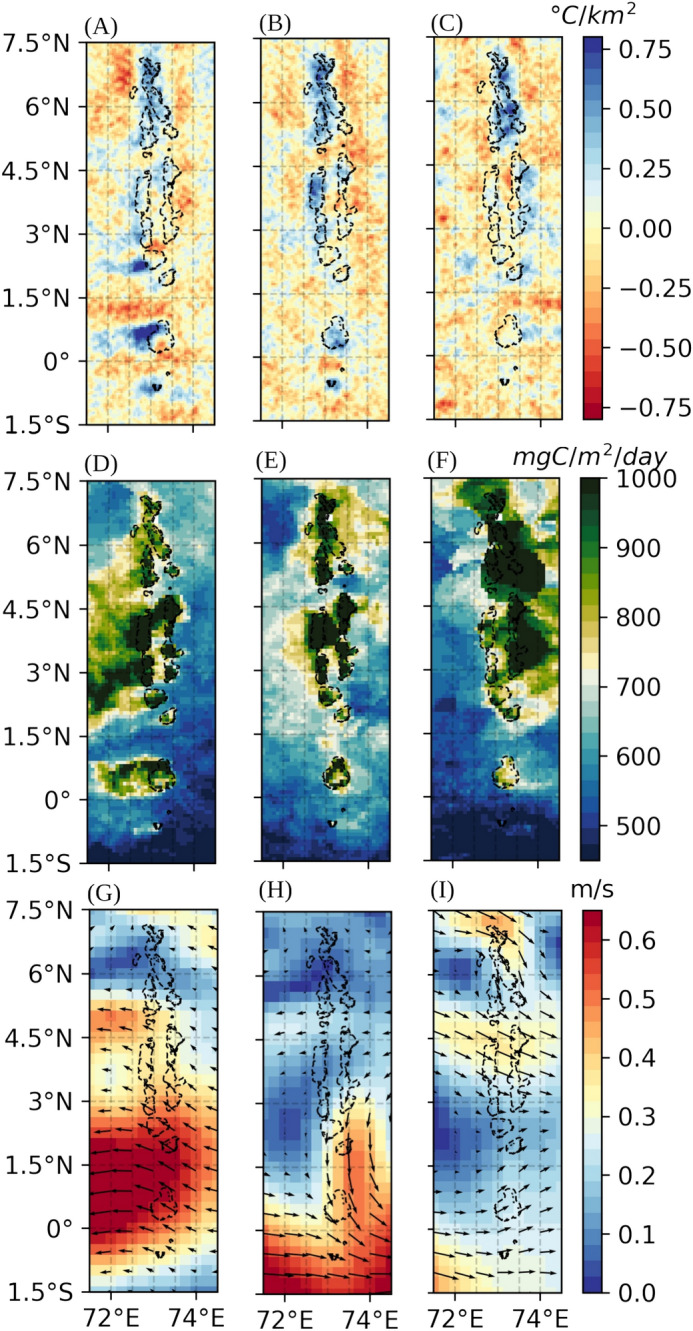
(A–C), SST Laplacian, (D–F) NPP, (G–I) OSCAR currents, for February (left), April (center) and June (right) 2013 respectively.
Forced with reanalaysis data, the CROCO model captures well the seasonal modulation of large scale ocean currents and temperature over the study domain21. SSTs are well reproduces by the simulation (see Fig. S3 in the SI), the cooling downstream of the islands is slightly more intense in February, a cold bias can also be observed in the north during June. Due to the small grid spacing, the model produces fine dynamical structures (see Fig. 3 and Supplementary Fig. S2), in some cases clearly associated with the interactions between currents and islands, as it is shown in the following. The validation of such fine scale features is not straightforward. At present, systematic measurements of sea surface temperature at km scale are available only in specific regions under clear sky conditions. Coastal radars can provide information on surface currents at high resolution, but unfortunately no high-frequency radars are available for the Maldives. Given that no direct validation of the velocity fields is possible, a comparison between the power spectra of the temperature fields has been performed. The results are shown in Fig. S3 in the SI. The spectra of the GHRSST datasets and 1.6km CROCO SST are similar, giving confidence to the validity of our approach, while 5km CROCO have far less energy at high wavenumbers.
Figure 3.
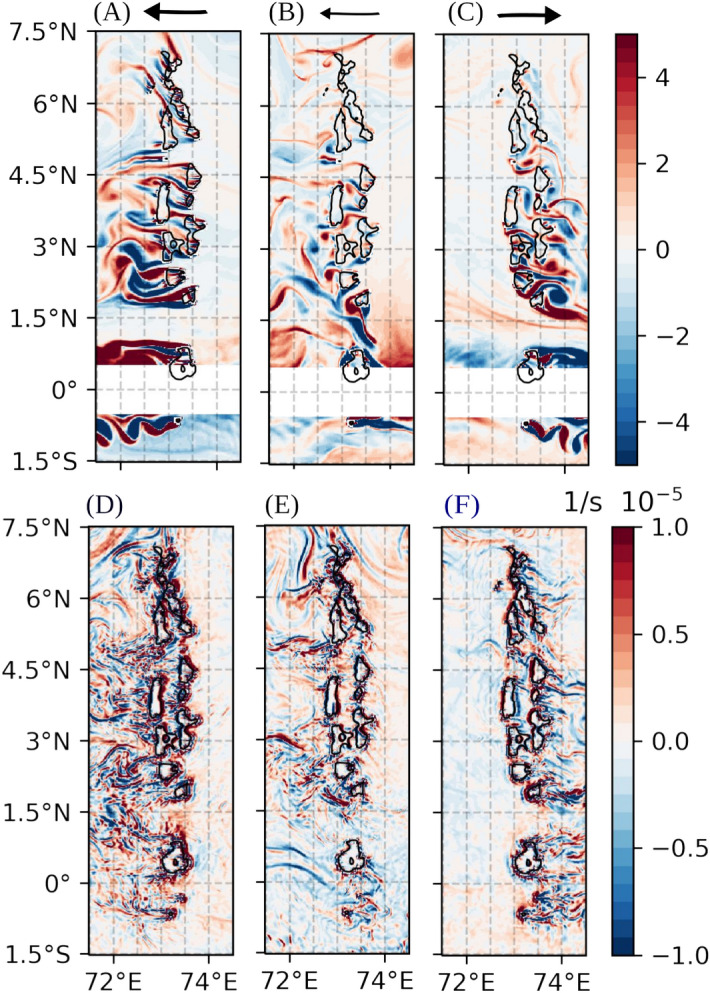
(A–C): mid February (left), April (center) and June 2013 (right) instantaneous snapshots of surface relative vorticity normalized at each latitude by the Coriolis parameter to visualize the local Rossby number (the latitudinal band around the equator is removed). (D–F): corresponding instantaneous snapshots of lateral divergence at the ocean surface. The black line represents the 250 m bathymetry line. The arrow on top of the panels (A,B,C) represent the average direction of the surface currents. The thickness of the line it is an indication of their intensity.
The presence of the Maldives significantly affects the circulation, but due to their size they do so through instabilities that arise at kilometer scales. Ocean models run at a resolution higher than 3 km in the horizontal that partially resolve ageostrophic, submesoscale dynamics39 are therefore needed to appreciate how and how much the islands modify the otherwise nearly zonal flow. Submesoscale currents are kilometer-scale flow structures in the form of coherent vortices, density fronts, vorticity filaments, and topographic wakes characterized by a local Rossby number, Ro, of order one that impact the ocean biological productivity40,41. Ro can be defined as , where f is the Coriolis parameter and is relative vorticity ( ).
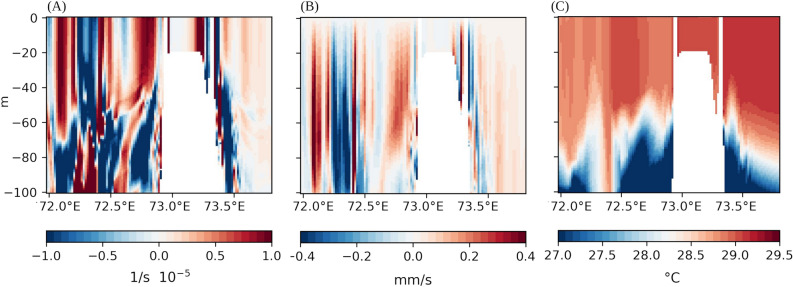
The instantaneous relative vorticity maps normalized by the Coriolis parameter shown in Fig. 3, therefore, provide a quantification of the absolute value of Ro around the atolls. The currents accelerate when passing through the narrow straits between the atolls and are deflected by the topography. The lee of the wake is characterized by increased turbulence, with eddies propagating downstream of the islands (see Fig. 3), which are more intense during the monsoon seasons, when the currents are stronger. These eddies stir the ocean surface, favoring blooms in otherwise barren waters42–45. In the Maldives the stirring contribution of the eddies combines with the (more important) lee upwelling (see, further below, the positive vertical velocity and divergence around 72.8°west of Thaa in Fig. 4). This upwelling gives rise to intense downstream wakes and plumes of cold, nutrient-rich waters that propagate for hundreds of km offshore of the islands.
Figure 4.
Vertical transects crossing the atoll of Thaa (marked in Fig. 1B) for an instant in February 2013 (westward currents). (A) Horizontal divergence, (B) vertical velocity (positive upwards), (C) temperature.
In sum, when the currents are strong, and therefore during the winter and summer monsoon seasons and when the WJs form at the equator, local upwelling occurs in the lee of the oceanic wake due to the intense horizontal divergence. In Fig. 4A, we show an example of circulation around the atoll of Thaa during the winter monsoon season (February), comparing instantaneous horizontal divergence, vertical velocity and temperature. The considerable speed difference between the currents that accelerate around the flanks and those behind the island itself, where the velocity is substantially smaller, leads to a complex pattern of surface divergence in the wake of the islands that, in turn, is fed by a deeper returning flow (8,46, and Supplementary Information, Fig. S5D,F). The net result is a strong upwelling tendency, with surface waters that are colder and more productive than in the offshore areas at scales large enough to be visible on satellite images, as shown in Figs. 2A,C,D,F and 4. This upwelling co-occurs with the year-round frictional break of the currents whenever they hit the atolls’ bathymetry. The resulting strong vertical shear in the flow favors vertical mixing21. On the modeling side, the upwelling, which is associated with the divergence and with the eddy fields, is strongly underestimated whenever a model with a horizontal resolution that does not resolve the straits between atolls is used, as in the case of the 5 km parent simulation (Fig. S5 in SI). To further emphasize the impact of both upwelling and submesoscale eddies on the water column, in Fig. 4 we show the vertical structure of temperature, divergence and vertical velocity crossing the atoll of Thaa, following47 analysis. They are associated with strong horizontal divergence and large vertical velocities, and lead to colder near-surface temperatures in the lee of the island, as can be seen in Fig. 4 at a time with westward currents. In the parent 5km resolution simulation, on the other hand, the horizontal divergence west of the atoll is reduced and the submesoscale imprint on vertical velocity is absent (see Fig. S4 in the SI)
In Fig. 5A,B two successive sets of wakes can be seen, one in the inner seas and a second one offshore the atolls, with the second one producing the stronger temperature signal. When the currents interact with the second chain of atolls, the horizontal velocity divergence further increases, driving the vigorous upwelling. As further explored in a sensitivity investigation below, this secondary intensification of the lateral divergence, and therefore of the upwelling, plays an important role and should be taken into account in the expansive land reclamation efforts planned in the Maldives48,49.
Figure 5.
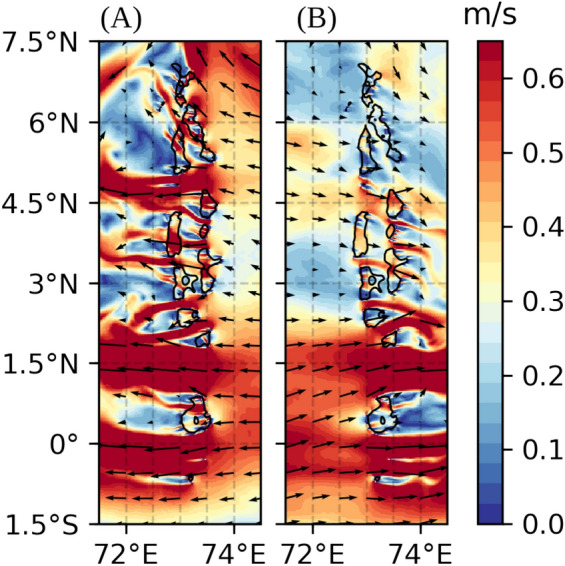
(A and B): instantaneous surface current in mid February, and June 2013 respectively, velocity magnitude (colorscale) and direction (arrows). The black line represents the 250 m bathymetry line.
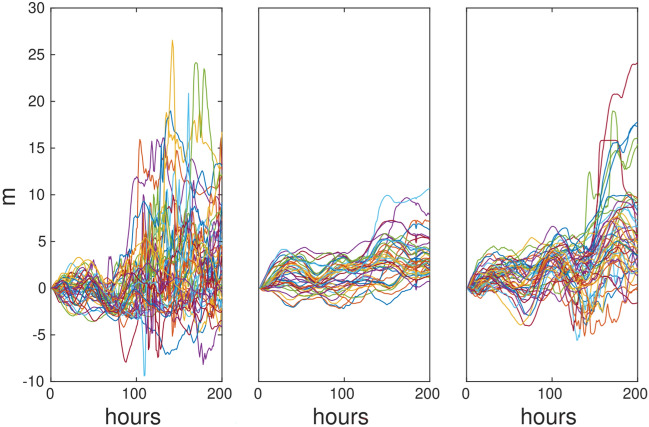
We further explore the distinction between upwelling, which is dominant during the monsoon season, and vertical mixing, which has a surface expression during the transition periods, as main mechanisms for NPP amplification around the Maldives by analyzing the trajectories of the particles tracked using Ariane. We release an equal number of particles 5 m below and 5 m above the local mixed layer base on the side of the incoming currents every 12 hours in the three representative months considered, February, April and June. The particles oscillate along the vertical direction in every season (Fig. 6). Oscillations can be an indicator of vertical mixing, and their presence indicates that the interaction between bottom currents and rough topography generates mixing year-round, as discussed in detail by21. During the monsoon seasons, however, the distribution is not symmetric around the depths of the particle release. This is quantified in Table 1 which summarizes the fraction of up-going and down-going particles. Each particle was counted as up-going or down-going based on whether it crossed the (locally computed) MLD along its trajectory. We counted the number of particles deployed 5m below the ML base that cross towards the surface and the number of particle deployed above that cross towards the bottom and then normalized by the total amount of particles used. Typically, particles take more than 3 days to vertically move by 5 m, and that the median vertical displacement of the mixed layer base in 3 days is about 5 m. We are thus confident that most of the obtained MLD crossings are not associated to random fluctuations and round-off errors of the numerical scheme, but rather to resolved dynamical processes that move particles from their initial depth across the base of the mixed layer. After the first MLD crossing, the particle was discounted. As expected, the fraction of particles entering the mixed layer from below is larger than the fraction of particles exiting the mixed layer from above both in February and June, when the upwelling mechanism is predominant. In April, the two values are similar, confirming the dominance of vertical mixing.
Figure 6.
Sample of particles trajectories (in light grey) from Ariane for the first 15 days of February (left), April (middle), and June (right) 2013. Depth variations from the initial deployment position for a random sample of the deployed particles. Positive variations indicate an upward displacement.
Table 1.
Particle tendency to undergo upwelling and downwelling computed as percentage of particles deployed 5 meters below/above the local MLD that were able to cross 5 m above/below the local MLD. Incoming (outgoing) refers to the side of the Archipelago, with respect to the flow, where the particles were deployed: east (west) in February and April, and west (east) in June (see Fig. 1).
| February | April | June | ||||
|---|---|---|---|---|---|---|
| Up-going (%) | Down-going (%) | Up-going (%) | Down-going (%) | Up-going (%) | Down-going (%) | |
| Incoming | 89 | 30 | 88 | 85 | 91 | 34 |
| Outgoing | 90 | 8 | 83 | 75 | 87 | 8 |
In summary, two processes contribute to the increased NPP around the Maldives. On one hand, bottom-flow interactions force the currents to abruptly decrease their speed and the resulting shear enhances vertical mixing, entraining deeper and colder water in the euphotic layer and vice versa (21). Put simply, the currents near the ocean surface must slow down when intersecting the steep sea floor around the islands. On the other, wake-induced upwelling occurs with an intensity proportional to the strength of the predominantly zonal currents. In Spring, from mid-March to early May, whenever the mixed layer is sufficiently shallow ( 30 m) and the currents are weakest, the mixing mechanism imprints the ocean surface and the induced local cooling can be detected from space. During these transition months, which are the warmest of the year, the mixing-induced cooling is relevant not only to the NPP around the islands but, most importantly, to the resiliency of the coral reefs to strong atmospheric warming episodes15,21. If the mixed layer is deeper than about 30 m, the mixing-induced cooling cannot be detected at the surface. During the monsoon seasons, instead, the wake induced upwelling prevails, and the magnitude of the resulting cooling and nutrient injection near the surface are greater than in Spring but spatially asymmetric, depending on the flow direction. The impact on the chlorophyll-a concentration is large and appears in the shape of intense plumes that extend from the atolls off-shore westward in February and eastward in June. In the southern portion of the Archipelago, where the currents are always intense, the asymmetry persists also in the transition period (Fig. 2B,E,H), suggesting that the wake-like upwelling mechanism prevails year-round.
Sensitivity analysis
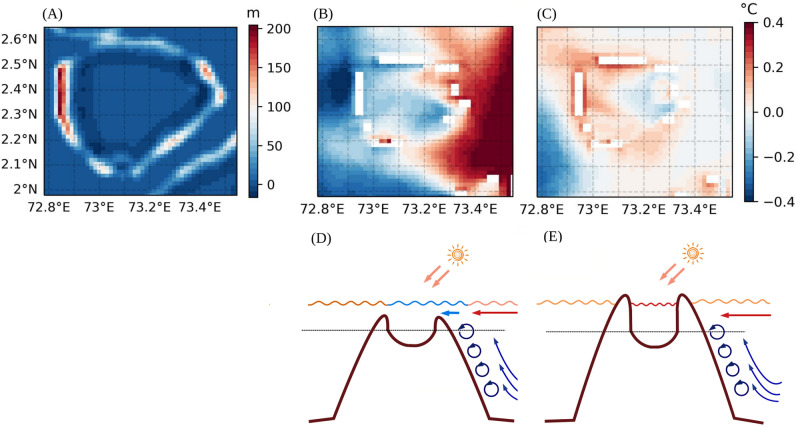
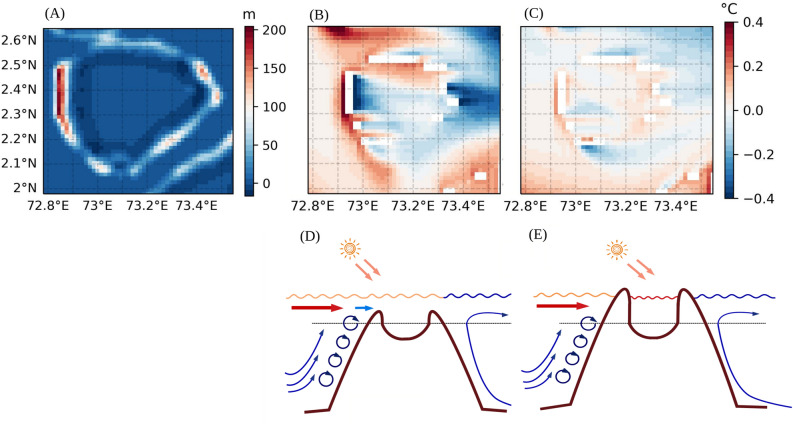
In the simulation performed with the current-day bathymetry, the cooler and nutrient-rich waters that result from the mixing and upwelling mechanisms propagate inside the atolls thanks to several passages between the islands, impacting the water temperatures in many of the shallow lagoons. Several reclamation efforts are underway or being planned in the Maldives through sand mining to enhance tourism revenue and reduce the risk of sea-level rise48,49. These efforts could modify the existing passages, among other unforeseen environmental consequences50. In light of these developments, we ran an additional simulation using a slightly modified bathymetry, that mimics what several of these land-reclamation efforts plan to achieve, and we explored their impact on the IME. In order to represent realistic land reclamation efforts, instead of changing the surface mask that represents land points, we modified the bottom topography. Expanding the mask would represent unrealistic land reclamation efforts, of about 2.5 km2 per grid box, which would be too extensive51. Therefore, we changed the depth of the bathymetry to increase the extension of the barrier provided by the islands to the incoming currents in the model. We varied the minimum depth (hmin), which determines the cutoff for topography, to prevent, for example, grid cells from lacking water. The advised range of hmin values was adjusted between the two runs to simulate potential changes due to land reclamation. In Figs 7 and 8 we show a zoom on one atoll to exemplify how the shallowing of some of the small passages among the islands could cause important surface temperature changes. The temperature is found to increase within the atolls especially in Spring (Fig. 7 displays the warming in April), when the zonal flow is weak and the risk of coral bleaching is highest. Some warming, however, is also found in June or February, because the atolls’ closures weaken the currents 8, and the upwelled, colder water is mixed in the MLD and accumulates on the side of the atolls on which the currents impinge, unable to enter the Archipelago (Fig. 7). A schematic of the process at play summarizes our findings (see Figs 7 and 8 panels D,E).
Figure 7.
(A) Example of difference in bathymetry between the current one and the one in which the land around the atolls have been reclaimed. (B,C) Average temperature anomalies in the first 15 days of April with respect to the zonal mean for (B) the original run, (C) the modified one. The process at play is schematically represented in panels (D,E).
Figure 8.
(A) Example of difference in the bathymetry between the current one and the one in which the land around the atolls have been reclaimed. (B,C) Average temperature anomalies in the first 15 days of June with respect to the zonal mean for (B) the original run, (C) the modified one. The process at play is schematically represented in panels (D,E).
Conclusion
The so-called Island Mass Effect (IME), characterized by elevated NPP, often accompanied by colder SSTs, is found around many tropical islands, fueling reef ecosystems and enabling locally important fisheries. The processes that drive the IME vary across islands and over time, and must be understood to properly manage these foundational ecosystems which are threatened by climate change, overfishing, pollution and other anthropogenic stressors. In this work, we investigated the mechanisms that drive the Maldives IME and its seasonal variability by modeling the ocean circulation at submesoscale permitting resolution and identifying the transport pathways around the islands with Lagrangian integrations.
We found that vertical mixing and localized upwelling at scales of few kilometers concur to enhance primary productivity by bringing nutrient enriched waters in the euphotic zone. The islands act as barriers to the incoming currents, causing year-round shear-induced vertical mixing, as already discussed by21. This mixing is predominant in controlling the NPP increase and is responsible for SST cooling immediately around the atolls only when the incoming currents are weak and the mixed layer is shallow. Those conditions are verified in Spring and especially in April, the warmest month of the year. This shear-induced mixing is key to limit the bleaching potential and coral mortality in El Niño years, when the spring heat fluxes are especially strong and the currents even weaker than normal21. During the monsoon seasons, on the other hand, upwelling prevails. The strong Northeast/Southwest monsoon currents cross the Archipelago from opposite directions in winter and summer, and each monsoon current causes two separate sets of wakes in the lee of each atoll, one for each chain of atolls. These wakes are the size of the atolls at most, and result from kilometer-scale processes. They differ from the recently discovered large-scale wake generated by the archipelago as a whole acting as a barrier to the mean flow36. Each wake accelerates the currents, being the flow forced to squeeze in the narrow passages, and the second one is more intense, due to the further acceleration. The lateral divergence in the lee of the wake induces strong upwelling, which dominates over the mixing and creates highly asymmetrical chlorophyll patterns on one or the other side of the Archipelago, depending on the season and current direction. Asymmetric temperature patterns can also be identified in the immediate proximity of the islands, but the upwelling signature on SSTs does not extend offshore due to counteracting strong, large-scale air-sea fluxes. The dynamics governing the upwelling occur at kilometer scales and are intense and effective because of the strong ageostrophic contributions to the vertical velocity field.
Understanding the underlying processes that drive the IME at the Maldives is essential for predicting and managing future changes caused by a warming climate and altered environmental conditions. Our study shows that the strength and seasonality of the IME will decrease in response to climate change if the low-level monsoon winds and, consequently, the ocean currents weaken significantly. Weakening around the equatorial region is projected by many of the models in the Coupled Model Intercomparison Project Phase 6 (CMIP6), with large uncertainties in the ensemble means due to different model biases52. Among these models, the weakening characterizes the future projections of the Community Earth System Model version 2 Large Ensemble (CESM2-LE)53,54. In the CESM2-LE the diminished strength of the equatorial currents is due to a weakening of the zonal sea surface temperature gradient in the Indian Ocean, which in turns results in a slowdown of the Indian Ocean Walker circulation.
The peculiar morphology of the Archipelago, with small islands grouped in almost, but not fully, enclosed atolls and the presence of many narrow passages within the atolls, significantly contributes to determine the final spatial pattern of how colder and nutrient enriched waters are ultimately distributed. Land reclamation efforts, underway and planned for the near future, may put at risk the ecosystems in the lagoons, as fully enclosed atolls do not benefit from the transport of cold, nutrient rich waters that result from mixing and upwelling into the lagoons. As a result, coral bleaching could become more prominent in the lagoons, and the impacts on both fishing and tourism industries should be accounted in future adaptation decisions.
Supplementary Information
Acknowledgements
This study has been conducted using the Group for High Resolution Sea Surface Temperature (GHRSST), Simple Ocean Data Assimilation version 3 (SODA3), ECMWF Reanalysis v5 (ERA5), Ocean Surface Current Analyses Real-time (OSCAR) and Ocean Productivity NPP data sets. This work is an outcome of Project MIUR - Dipartimenti di Eccellenza 2023-2027. AB thanks the support of the Bjerknes Centre for Climate Research where she was a Visiting Fellow and this paper was finalized.
Author contributions
All authors designed the study. CF performed the conducted analyses. CF and AB drafted the manuscript. CF, FD, AB and CP contributed to discussions, interpretations and writing. All the authors read, reviewed and approved the submitted version.
Data Availability
The Group for High Resolution Sea Surface Temperature (GHRSST) Level 4 is available at: https://podaac.jpl.nasa.gov/dataset/AVHRR_OI-NCEI-L4-GLOB-v2.0?ids=ProcessingLevel:Measurement:DataFormat &values=*4*:Ocean%20Temperature:NETCDF Ocean Productivity NPP data are available at http://sites.science.oregonstate.edu/ocean.productivity/ ECMWF Reanalysis v5 (ERA5) data are available at https://climate.copernicus.eu/climate-reanalysis Ocean Surface Current Analyses Real-time (OSCAR) are available at https://podaac.jpl.nasa.gov/dataset/OSCAR_L4_OC_third-deg?ids=Measurement &values=Ocean%20Circulation &search=Ocean%20Currents The CROCO simulations output are available upon request to the authors.
Competing interests
The authors declare no competing interests.
Footnotes
Publisher's note
Springer Nature remains neutral with regard to jurisdictional claims in published maps and institutional affiliations.
Supplementary Information
The online version contains supplementary material available at 10.1038/s41598-024-63836-9.
References
- 1.Doty, M. S. & Oguri, M. The Island mass effect. ICES J. Mar. Sci.22, 33–37 (1956). 10.1093/icesjms/22.1.33 [DOI] [Google Scholar]
- 2.Caldeira, R., Groom, S., Miller, P., Pilgrim, D. & Nezlin, N. Sea-surface signatures of the Island mass effect phenomena around Madeira Island. Northeast Atl. Remote Sens. Environ.80, 336–360 (2002). 10.1016/S0034-4257(01)00316-9 [DOI] [Google Scholar]
-
3.Andrade, I., Sangrà, P., Hormazabal, S. & Correa-Ramirez, M. Island mass effect in the Juan Fernández Archipelago (
 ). Southeast. Pac. Deep Sea Res. Part I: Oceanogr. Res.84, 86–99 (2014). 10.1016/j.dsr.2013.10.009 [DOI] [Google Scholar]
 - 4.Chérubin, L. M. & Garavelli, L. Eastern Caribbean circulation and island mass effect on St. Croix, US Virgin Islands: A mechanism for relatively consistent recruitment patterns. PLoS ONE11, 1–28 (2016). 10.1371/journal.pone.0150409 [DOI] [PMC free article] [PubMed] [Google Scholar]
- 5.Gove, J. et al. Near-Island biological hotspots in barren ocean basins. Nat. Commun.7, 10581 (2016). 10.1038/ncomms10581 [DOI] [PMC free article] [PubMed] [Google Scholar]
- 6.Gove, J. M., Merrifield, M. A. & Brainard, R. E. Temporal variability of current-driven upwelling at Jarvis Island. J. Geophys. Res. Oceans111, C12011. 10.1029/2005JC003161 (2006). 10.1029/2005JC003161 [DOI] [Google Scholar]
- 7.Hamner, W. M. & Hauri, I. R. Effects of island mass: Water flow and plankton pattern around a reef in the Great Barrier Reef lagoon Australia. Limnol. Oceanogr.26, 1084–1102 (1981). 10.4319/lo.1981.26.6.1084 [DOI] [Google Scholar]
- 8.De Falco, C., Desbiolles, F., Bracco, A. & Pasquero, C. Island mass effect: A review of oceanic physical processes. Front. Mar. Sci.9, 894860 (2022). 10.3389/fmars.2022.894860 [DOI] [Google Scholar]
- 9.Bell, P. Eutrophication and coral reefs-some examples in the Great Barrier Reef lagoon. Water Res.26, 553–568 (1992). 10.1016/0043-1354(92)90228-V [DOI] [Google Scholar]
- 10.Street, J. H., Knee, K. L., Grossman, E. E. & Paytan, A. Submarine groundwater discharge and nutrient addition to the coastal zone and coral reefs of leeward Hawai’i. Mar. Chem.109, 355–376 (2008). 10.1016/j.marchem.2007.08.009 [DOI] [Google Scholar]
- 11.Hwang, D.-W., Lee, Y.-W. & Kim, G. Large submarine groundwater discharge and benthic eutrophication in Bangdu Bay on volcanic Jeju Island Korea. Limnol. Oceanogr.50, 1393–1403 (2005). 10.4319/lo.2005.50.5.1393 [DOI] [Google Scholar]
- 12.Vitousek, P. M., Mooney, H. A., Lubchenco, J. & Melillo, J. M. Human domination of earth’s ecosystems. Science277, 494–499 (1997). 10.1126/science.277.5325.494 [DOI] [Google Scholar]
- 13.Radice, V. Z., Hoegh-Guldberg, O., Fry, B., Fox, M. D. & Dove, S. G. Upwelling as the major source of nitrogen for shallow and deep reef-building corals across an oceanic atoll system. Funct. Ecol.33, 1120–1134 (2019). 10.1111/1365-2435.13314 [DOI] [Google Scholar]
- 14.Sasamal, S. K. Island mass effect around the Maldives during the winter months of 2003 and 2004. Int. J. Remote Sens.27, 5087–5093 (2006). 10.1080/01431160500177562 [DOI] [Google Scholar]
- 15.de Vos, A., Pattiaratchi, C. B. & Wijeratne, E. M. S. Surface circulation and upwelling patterns around Sri Lanka. Biogeosciences11, 5909–5930 (2014). 10.5194/bg-11-5909-2014 [DOI] [Google Scholar]
- 16.Su, D., Wijeratne, S. & Pattiaratchi, C. B. Monsoon influence on the island mass effect around the Maldives and Sri Lanka. Front. Mar. Sci.8, 645672 (2021). 10.3389/fmars.2021.645672 [DOI] [Google Scholar]
- 17.Naseer, A. The Integrated Growth Response of Coral Reefs to Environmental Forcing: Morphometric Analysis of Coral Reefs of the Maldives. PhD thesis, Maldives National University (2003).
- 18.Wilkinson, C. Status of Coral Reefs of the World: 2008 (Global Coral Reef Monitoring Network and Australian Institute of Marine Science, Townsville, 2008). [Google Scholar]
- 19.Zahir, H., Quinn, N. & Cargillia, N. Assessment of Maldivian coral reefs in 2009 after natural disasters. Marine Research Center (2009).
- 20.Anderson, R. C., Adam, M. S. & Goes, J. I. From monsoons to mantas: Seasonal distribution of manta Alfredi in the Maldives. Fisheries Oceanogr.20, 104–113 (2011). 10.1111/j.1365-2419.2011.00571.x [DOI] [Google Scholar]
- 21.De Falco, C., Bracco, A. & Pasquero, C. Climatic and oceanographic controls on coral bleaching conditions in the Maldivian region. Front. Mar. Sci.7, 790 (2020). 10.3389/fmars.2020.539869 [DOI] [Google Scholar]
- 22.UK Met Office. GHRSST Level 4 OSTIA Global Foundation Sea Surface Temperature Analysis. Ver. 1.0. PO.DAAC, CA, USA (2005). 10.5067/GHOST-4FK01. Last Accessed 12 Feb 2020. [DOI]
- 23.Behrenfeld, M. J. & Falkowski, P. G. Photosynthetic rates derived from satellite-based chlorophyll concentration. Limnol. Oceanogr.42, 1–20 (1997). 10.4319/lo.1997.42.1.0001 [DOI] [Google Scholar]
- 24.NASA Goddard Space Flight Center. Ocean Ecology Laboratory (Ocean Biology Processing Group, MODIS-Aqua Ocean Color Data, 2014). [Google Scholar]
- 25.Morel, A. & Berthon, J.-F. Surface pigments, algal biomass profiles, and potential production of the euphotic layer: Relationships reinvestigated in view of remote-sensing applications. Limnol. Oceanogr.34, 1545–1562 (1989). 10.4319/lo.1989.34.8.1545 [DOI] [Google Scholar]
- 26.ESR. OSCAR third degree resolution ocean surface currents (2009). 10.5067/oscar-03d01. Last Accessed 12 Apr 2022.
- 27.Bonjean, F. & Lagerloef, G. S. E. Diagnostic model and analysis of the surface currents in the tropical pacific ocean. J. Phys. Oceanogr.32, 2938–2954 (2002). [DOI] [Google Scholar]
- 28.Auclair, F. Some. et al. recent developments around the CROCO initiative for complex regional to coastal modeling, COMOD 2018 - Workshop on Coastal Ocean Modelling (Hambourg, Germany, 2018).
- 29.Carton, J., Chepurin, G. & Chen, L. SODA3: A new ocean climate reanalysis. J. Clim.31, 6967–6983. 10.1175/JCLI-D-18-0149.1 (2018). 10.1175/JCLI-D-18-0149.1 [DOI] [Google Scholar]
- 30.Copernicus Climate Change Service C3S. ERA5: Fifth generation of ECMWF atmospheric reanalyses of the global climate . Copernicus Climate Change Service Climate Data Store (CDS) (2017). https://cds.climate.copernicus.eu/cdsapp#!/home. Last Accessed 15 Jan 2019.
- 31.Blanke, B. & Raynaud, S. Kinematics of the Pacific Equatorial Undercurrent: An Eulerian and Lagrangian approach from GCM results. J. Phys. Oceanogr.27, 1038–1053 (1997). [DOI] [Google Scholar]
- 32.Amante, C. & Eakins, B. ETOPO1 1 arc-minute global relief model: procedures, data sources and analysis. NOAA Technical Memorandum NESDIS NGDC-24. National Geophysical Data Center, NOAA (2009). Last Accessed Nov 2017.
- 33.Fieux, M. in Somali current Second edition edn, (ed.Steele, J. H.) Encyclopedia of Ocean Sciences (Second Edition) 494 – 503 (Academic Press, Oxford, 2001).
- 34.Wyrtki, K. An equatorial jet in the Indian Ocean. Science181, 262–264 (1973). 10.1126/science.181.4096.262 [DOI] [PubMed] [Google Scholar]
- 35.McPhaden, M. J., Wang, Y. & Ravichandran, M. Volume transports of the wyrtki jets and their relationship to the Indian ocean dipole. J. Geophys. Res. Oceans120, 5302–5317. 10.1002/2015JC010901 (2015). 10.1002/2015JC010901 [DOI] [Google Scholar]
- 36.Nagura, M. & Masumoto, Y. a wake due to the Maldives in the eastward Wyrtki jet. J. Phys. Oceanogr.45, 1858–1876 (2015). 10.1175/JPO-D-14-0191.1 [DOI] [Google Scholar]
- 37.Nagura, M. & McPhaden, M. J. Wyrtki Jet dynamics: Seasonal variability. J. Geophys. Res. Oceans115, C07009. https://agupubs.onlinelibrary.wiley.com/doi/abs/10.1029/2009JC005922 (2010). 10.1029/2009JC005922 [DOI] [Google Scholar]
-
38.Huang, K. et al. Meridional-width variability of near-equatorial zonal currents along
 on seasonal to interannual timescales in the Indian Ocean. J. Geophys. Rese. Oceans128, e2022JC019147 (2023).
- 39.McWilliams, J. C. Submesoscale currents in the ocean. Proc. R. Soc. Math. Phys. Eng. Sci.472, 20160117 (2016). [DOI] [PMC free article] [PubMed] [Google Scholar]
- 40.Lévy, M., Ferrari, R., Franks, P. J. S., Martin, A. P. & Rivière, Bringing physics to life at the submesoscale. Geophys. Res. Lett. 39(14), L14602 (13p.). 10.1029/2012GL052756 (2012).
- 41.Mahadevan, A. The impact of submesoscale physics on primary productivity of plankton. Ann. Rev. Mar. Sci.8, 161–184. 10.1146/annurev-marine-010814-015912 (2016). 10.1146/annurev-marine-010814-015912 [DOI] [PubMed] [Google Scholar]
- 42.Chang, Y.-L., Miyazawa, Y., Oey, L.-Y., Kodaira, T. & Huang, S. The formation processes of phytoplankton growth and decline in mesoscale eddies in the western north pacific ocean. J. Geophys. Res. Oceans122, 4444–4455 (2017). 10.1002/2017JC012722 [DOI] [Google Scholar]
- 43.Martin, A. P. & Richards, K. J. Mechanisms for vertical nutrient transport within a north Atlantic mesoscale eddy. Deep Sea Res. Part II Top. Stud. Oceanogr.48, 757–773 (2001). 10.1016/S0967-0645(00)00096-5 [DOI] [Google Scholar]
- 44.McGillicuddy, D. J. et al. Eddy/wind interactions stimulate extraordinary mid-ocean plankton blooms. Science316, 1021–1026 (2007). 10.1126/science.1136256 [DOI] [PubMed] [Google Scholar]
- 45.Gaube, P., Chelton, D. B., Strutton, P. G. & Behrenfeld, M. J. Satellite observations of chlorophyll, phytoplankton biomass, and Ekman pumping in nonlinear mesoscale eddies. J. Geophys. Res. Oceans118, 6349–6370. 10.1002/2013JC009027 (2013). 10.1002/2013JC009027 [DOI] [Google Scholar]
- 46.Hasegawa, D., Yamazaki, H., Lueck, R. G. & Seuront, L. How islands stir and fertilize the upper ocean. Geophys. Res. Lett.31 L16303. 10.1029/2004GL020143 (2004). 10.1029/2004GL020143 [DOI] [Google Scholar]
- 47.Guo, B. et al. Observed deep anticyclonic cap over Caiwei guyot. J. Geophys. Res. Oceans125, e2020JC016254 (2020). 10.1029/2020JC016254 [DOI] [Google Scholar]
- 48.Brown, S. et al. Pathways to sustain atolls under rising sea levels through land claim and island raising. Environ. Res. Clim.2, 015005 (2023). 10.1088/2752-5295/acb4b3 [DOI] [Google Scholar]
- 49.MEE. State of the Environment 2016. Ministry of Environment and Energy, Malè, Maldives (2017).
- 50.Chase-Lubitz, J. The Maldives is racing to create new land. Why are so many people concerned?. Nature628, 704–708 (2024). 10.1038/d41586-024-01157-7 [DOI] [PubMed] [Google Scholar]
- 51.Duvat, V. K. Human-driven atoll Island expansion in the Maldives. Anthropocene32, 100265 (2020). 10.1016/j.ancene.2020.100265 [DOI] [Google Scholar]
- 52.Choudhury, D., Nath, D. & Chen, W. Near future projection of Indian summer monsoon circulation under 1.5 & 2.0 c warming. Atmosphere13, 1081. 10.3390/atmos13071081 (2022).
- 53.Danabasoglu, G. et al. The community earth system model version 2 (cesm2). J. Adv. Model. Earth Syst.12, e2019MS001916. 10.1029/2019MS001916 (2020).
- 54.Sharma, S. et al. Future Indian ocean warming patterns. Nat. Commun. 14, 1789. 10.1038/s41467-023-37435-7 (2023). [DOI] [PMC free article] [PubMed]
Associated Data
This section collects any data citations, data availability statements, or supplementary materials included in this article.
Supplementary Materials
Data Availability Statement
The Group for High Resolution Sea Surface Temperature (GHRSST) Level 4 is available at: https://podaac.jpl.nasa.gov/dataset/AVHRR_OI-NCEI-L4-GLOB-v2.0?ids=ProcessingLevel:Measurement:DataFormat &values=*4*:Ocean%20Temperature:NETCDF Ocean Productivity NPP data are available at http://sites.science.oregonstate.edu/ocean.productivity/ ECMWF Reanalysis v5 (ERA5) data are available at https://climate.copernicus.eu/climate-reanalysis Ocean Surface Current Analyses Real-time (OSCAR) are available at https://podaac.jpl.nasa.gov/dataset/OSCAR_L4_OC_third-deg?ids=Measurement &values=Ocean%20Circulation &search=Ocean%20Currents The CROCO simulations output are available upon request to the authors.


