

Abstract
BACKGROUND:
Perinatal services exist today as a dyad of maternal and neonatal care. When perinatal care is fragmented or unavailable, excess morbidity and mortality may occur in pregnant women and newborns.
OBJECTIVE:
The objective of the study was to describe spatial relationships between women of reproductive age, individual perinatal subspecialists (maternal-fetal medicine and neonatology), and obstetric and neonatal critical care facilities in the United States to identify gaps in health care access.
STUDY DESIGN:
We used geographic visualization and conducted surface interpolation, nearest neighbor, and proximity analyses. Source data included 2010 US Census, October 2013 National Provider Index, 2012 American Hospital Association, 2012 National Center for Health Statistics Natality File, and the 2011 American Academy of Pediatrics directory.
RESULTS:
In October 2013, there were 2.5 neonatologists for every maternal-fetal medicine specialist in the United States. In 2012 there were 1.4 level III or higher neonatal intensive care units for every level III obstetric unit (hereafter, obstetric critical care unit). Nationally, 87% of women of reproductive age live within 50 miles of both an obstetric critical care unit and a neonatal intensive care unit. However, 18% of obstetric critical care units had no neonatal intensive care unit, and 20% of neonatal intensive care units had no obstetric critical care unit within a 10 mile radius. Additionally, 26% of obstetric critical care units had no maternal- fetal medicine specialist practicing within 10 miles of the facility, and 4% of neonatal intensive care units had no neonatologist practicing within 10 miles.
CONCLUSION:
Gaps in access and discordance between the availability of level III or higher obstetric and neonatal care may affect the delivery of risk-appropriate care for high-risk maternal fetal dyads. Further study is needed to understand the importance of these gaps and discordance on maternal and neonatal outcomes.
Keywords: critical care, geospatial, neonatal, obstetric, perinatal
Perinatal services exist today as a dyad of maternal and neonatal care. Although most hospitals deliver babies, only a small proportion provide specialized care.1 When perinatal care is fragmented or unavailable, excess morbidity and mortality may occur in pregnant women and newborns.2–6
Since 2007, infant mortality rates in the United States have slowly declined.7 However, the United States still lags behind most industrialized nations in preventing infant death.8 In addition, the United States has experienced recent increases in the maternal mortality rate, although it is unclear whether increases are due to improved identification of maternal deaths or increased risk of mortality.9
Complementary but distinct levels of maternal and neonatal care were defined to ensure mothers and neonates receive services in a setting with appropriate resources and personnel to address their complexity of care (risk-appropriate care).10 Levels of maternal care were recently proposed, whereas levels of neonatal care have been long-standing.
To assure risk-appropriate care is available to all mothers and neonates, perinatal regionalization systems have been implemented by states.11,12 Although regionalization is discussed as perinatal (ie, including both the mother and neonate), the focus has remained on the fetus/neonate.13,14 A recent national initiative, Collaborative Improvement and Innovation Network to reduce infant mortality is supporting states in operationalizing perinatal regionalization.15 However, working across state borders is likely necessary to reduce access barriers.16 We conducted spatial and proximity analyses of obstetric and neonatal critical care units and sub-specialists in the United States to identify where the potential gaps in access occur.
Materials and Methods
A descriptive analysis of current US perinatal resources was used to determine spatial relationships between the population of women of reproductive age (ages 15–44 years), individual perinatal subspecialists (maternal fetal-medicine and neonatology), and obstetric and neonatal level III and higher facilities in the United States. Data are presented by state and US Department of Health and Human Services (DHHS) region. We used geographic visualization and conducted surface interpolation, nearest neighbor, and proximity analyses (described in the following text).17
All 50 states and the District of Columbia were included. The 2010 US Population Census was used to determine the number of women of reproductive age nationally and by US DHHS region.18,19 We assumed pregnant women were equally distributed across the women of reproductive-age population. Therefore, the proportion of pregnant women within a geographic area who had access to a perinatal resource was used as a proxy for access among women of reproductive age. The number of pregnant women was approximated by using the number of live births from the 2012 National Center for Health Statistics Natality File.20
Individual perinatal subspecialists included practitioners who have subspecialty board certification in maternal-fetal medicine (MFM) or neonatal perinatal medicine (referred to as neonatologists) according to the October 2013 National Provider Index.21 Only subspecialists listed as active (currently practicing medicine) were included.
Obstetric critical care unit (OCCU) refers to facilities with a level III obstetric unit as identified in the 2012 American Hospital Association (AHA) annual survey data. AHA defines a level III obstetric unit as one that provides services for all serious illnesses and abnormalities and is supervised by a full-time maternal-fetal specialist; neonatal critical care unit (NICU) refers to a facility with a level III or higher NICU as identified in the 2011 American Academy of Pediatrics (AAP) directory data.22,23 NICUs were linked to the AHA database using Link Plus software. Unlinked NICUs from the AAP list because of name or address inaccuracies were resolved using the hospital’s web site.
The Homeland Security Infrastructure Program (HSIP) Gold 2010 hospital data set was used to confirm hospital locations.24 The HSIP also provides locations for individual facilities within a hospital system. Records unable to be linked to the HSIP database because of address inaccuracies were geocoded manually using physical addresses listed on the facility’s web site.
A surface raster was created to visualize the women of reproductive-age population using inverse distance weighting spatial interpolation of census block populations.25 Inverse distance weighting is a deterministic interpolation of values that assumes each measured point has a local influence that diminishes with distance. Raster and vector map layers were built for all women of reproductive age. Point layers for each of the different types of perinatal critical care providers were then created.
Lists of MFM subspecialists and neonatologists were extracted from the National Provider Index using taxonomy codes specific for their primary practice. Subspecialists were then geocoded to their listed office location using Centrus Desktop version 6.0. Subspecialist layers were used to compare the number and distance of subspecialty units and practitioners using nearest neighbor and proximity analyses.25
Subspecialist layers were also used to create zonal layers for access to care proximity analyses. Zonal layers were formed using Euclidean distance buffers placed around each hospital at 10 and 50 miles and each individual subspecialist at 10 miles. Euclidean distance buffers use straight line distance (as the crow flies) and appear on a map as perfect circles around a point. Zones that overlapped were merged to form confluent zones, and zones that crossed state boundaries were clipped by the state boundaries, allowing zones to be analyzed by state.
Thiessen polygons were generated around each hospital for the entire study area (continental United States, Alaska, and Hawaii) to link women of reproductive age with their nearest critical care hospital; the size and shape were dependent on the proximity to neighboring hospitals.26 Polygons that included parts of more than 1 state were divided into 1 or more sections, with 1 section for each state represented. Women of reproductive age residing in sections with concordant state locations (section and nearest hospital in the same state) were considered in-state; women of reproductive age with discordant state locations (section and nearest hospital not in the same state) were defined as out of state.
To describe access to critical care, population layers were overlaid with zonal layers and analyzed for spatial proximity.27 The population located within 50 miles of a critical care facility were considered to have access; those located more than 50 miles from a critical care facility were considered not to have access. Distance is a well-established barrier to accessing care; 50 miles was selected based on both the golden hour and because it approximates the farthest distance most people appear willing to travel for specialized medical care.28–30 Proportions of women of reproductive age with and without access to OCCUs and/or NICUs were calculated. In addition, zonal overlap was assessed to estimate the number of women who had access to both critical care for herself and her newborn.
Distance between the nearest complementary OCCU and NICU was evaluated using a nearest neighbor analysis to estimate the percentage of facilities requiring transfers of critically ill mothers or infants.25 OCCUs and NICUs less than 0.25 miles apart were considered the same facility. Transfers of less than 10 miles, and those of at least 10 miles, were assessed separately. The number of facilities within 10 miles of each other was also used to describe clustering of critical care hospitals. The 10 mile distance was based on examining the distribution of the data. The median distance between subspecialists’ primary office location and a critical care unit was approximately 0.5 miles. However, we decided to use a more generous (although somewhat arbitrary) cutoff of 10 miles, which was between 1 and 2 SDs of the mean.
Proximity of MFM practice locations to obstetric units, and neonatologist practice locations to NICUs, was assessed using a nearest-neighbor analysis. All analyses were conducted using SAS versions 9.2 and 9.3 (SAS Institute, Cary, NC) and ArcGIS version 10.3 (ESRI, Redlands, CA).
Results
In October 2013 there were 2.5 neonatologists for every 1 MFM specialist in the United States (4797 neonatologists; 1888 MFM specialists). Similarly, in 2012 there were 1.4 hospitals with an NICU for every 1 hospital with an OCCU (848 NICUs; 599OCCUs). The afore-mentioned information corresponds to approximately 6 neonatologists per NICU (4797/848), compared with approximately 3 MFM specialists per OCCU (1888/599). In 2012, there were 4.8 MFM specialists and 12.0 neonatologists per 10,000 live births, respectively (Table 1).
TABLE 1.
Ratio of perinatal subspecialists per 10,000 live births by state and US Department of Health and Human Services region, 2012
| Maternal-fetal medicine |
Neonatologist |
||||
|---|---|---|---|---|---|
| HHS region | State | Number | Ratio | Number | Ratio |
|
| |||||
| I | United States | 1880 | 4.8 | 4754 | 12.0 |
|
| |||||
| Connecticut | 42 | 11.5 | 71 | 19.4 | |
|
| |||||
| Maine | 4 | 3.1 | 18 | 14.1 | |
|
| |||||
| Massachusetts | 53 | 7.3 | 127 | 17.5 | |
|
| |||||
| New Hampshire | 7 | 5.7 | 15 | 12.1 | |
|
| |||||
| Rhode Island | 11 | 10.1 | 17 | 15.6 | |
|
| |||||
| Vermont | 6 | 10.0 | 8 | 13.3 | |
|
| |||||
| Regional | 123 | 8.1 | 256 | 16.9 | |
|
| |||||
| II | New Jersey | 79 | 7.6 | 160 | 15.4 |
|
| |||||
| New York | 194 | 8.1 | 351 | 14.6 | |
|
| |||||
| Regional | 273 | 7.9 | 511 | 14.8 | |
|
| |||||
| III | Delaware | 8 | 7.3 | 19 | 17.2 |
|
| |||||
| District of Columbia | 13 | 13.8 | 61 | 64.9 | |
|
| |||||
| Maryland | 40 | 5.5 | 108 | 14.8 | |
|
| |||||
| Pennsylvania | 103 | 7.2 | 251 | 17.6 | |
|
| |||||
| Virginia | 36 | 3.5 | 128 | 12.4 | |
|
| |||||
| West Virginia | 3 | 1.4 | 20 | 9.6 | |
|
| |||||
| Regional | 203 | 5.6 | 587 | 16.3 | |
|
| |||||
| IV | Alabama | 25 | 4.3 | 45 | 7.7 |
|
| |||||
| Florida | 76 | 3.6 | 292 | 13.7 | |
|
| |||||
| Georgia | 47 | 3.6 | 108 | 8.3 | |
|
| |||||
| Kentucky | 29 | 5.2 | 63 | 11.3 | |
|
| |||||
| Mississippi | 10 | 2.6 | 33 | 8.5 | |
|
| |||||
| North Carolina | 53 | 4.4 | 138 | 11.5 | |
|
| |||||
| South Carolina | 22 | 3.8 | 58 | 10.1 | |
|
| |||||
| Tennessee | 31 | 3.9 | 97 | 12.1 | |
|
| |||||
| Regional | 293 | 3.9 | 834 | 11.1 | |
|
| |||||
| V | Illinois | 80 | 5.0 | 241 | 15.1 |
|
| |||||
| Indiana | 24 | 2.9 | 108 | 13.0 | |
|
| |||||
| Michigan | 59 | 5.2 | 119 | 10.5 | |
|
| |||||
| Minnesota | 8 | 1.2 | 70 | 10.2 | |
|
| |||||
| Ohio | 77 | 5.6 | 175 | 12.6 | |
|
| |||||
| Wisconsin | 26 | 3.9 | 78 | 11.6 | |
|
| |||||
| Regional | 274 | 4.3 | 791 | 12.6 | |
|
| |||||
| VI | Arkansas | 7 | 1.8 | 29 | 7.6 |
|
| |||||
| Louisiana | 21 | 3.4 | 66 | 10.5 | |
|
| |||||
| New Mexico | 16 | 5.9 | 40 | 14.8 | |
|
| |||||
| Oklahoma | 11 | 2.1 | 43 | 8.2 | |
|
| |||||
| Texas | 149 | 3.9 | 407 | 10.6 | |
|
| |||||
| Regional | 204 | 3.6 | 585 | 10.4 | |
|
| |||||
| VII | Iowa | 15 | 3.9 | 48 | 12.4 |
|
| |||||
| Kansas | 10 | 2.5 | 23 | 5.7 | |
|
| |||||
| Missouri | 46 | 6.1 | 133 | 17.6 | |
|
| |||||
| Nebraska | 13 | 5.0 | 17 | 6.6 | |
|
| |||||
| Regional | 84 | 4.7 | 221 | 12.2 | |
|
| |||||
| VIII | Colorado | 29 | 4.4 | 65 | 10.0 |
|
| |||||
| Montana | 3 | 2.5 | 7 | 5.8 | |
|
| |||||
| North Dakota | 1 | 1.0 | 12 | 11.9 | |
|
| |||||
| South Dakota | 4 | 3.3 | 12 | 9.9 | |
|
| |||||
| Utah | 21 | 4.1 | 47 | 9.1 | |
|
| |||||
| Wyoming | 0 | 0.0 | 1 | 1.3 | |
|
| |||||
| Regional | 58 | 3.7 | 144 | 9.1 | |
|
| |||||
| IX | Arizona | 38 | 4.4 | 64 | 7.4 |
|
| |||||
| California | 200 | 4.0 | 598 | 11.9 | |
|
| |||||
| Hawaii | 6 | 3.2 | 22 | 11.6 | |
|
| |||||
| Nevada | 24 | 6.9 | 21 | 6.0 | |
|
| |||||
| Regional | 268 | 4.2 | 705 | 10.9 | |
|
| |||||
| X | Alaska | 3 | 2.7 | 6 | 5.4 |
|
| |||||
| Idaho | 5 | 2.2 | 13 | 5.7 | |
|
| |||||
| Oregon | 38 | 8.4 | 43 | 9.5 | |
|
| |||||
| Washington | 54 | 6.2 | 58 | 6.6 | |
|
| |||||
| Regional | 100 | 6.0 | 120 | 7.2 | |
Data sources included the following: live births, US Department of Health and Human Services, Centers for Disease Control and Prevention, National Center for Health Statistics, Division of Vital Statistics; natality public use data 2012 subspecialists, national provider index, October 2013.
HHS, Health and Human Services.
Nearly all obstetric (95%) and NICU (99%) units were located in urban areas. Therefore, whereas large geographic areas in the United States were not covered by either of the perinatal facility zones (46%), the vast majority of the population did have access to (defined as living within 50 miles of) one or both types of critical care units (94%). Specifically, 91% of the US population of women of reproductive age had access to an OCCU, 93% had access to an NICU, and 87% had access to both.
However, access to specialized obstetric and neonatal care varied by state and region (Table 2). In all but 2 states within DHHS regions 1–5 (primarily states east of the Mississippi River), at least 80% of the women of reproductive age had access to an obstetric critical care unit, and in all states at least 80% of the women of reproductive age had access to an NICU.
TABLE 2.
Percentage of women of reproductive age (ages 15–44 years) living within 50 miles of perinatal critical care services, by subspecialty, 2012
| Difference |
||||||
|---|---|---|---|---|---|---|
| HHS region | State/district name | Level III NICU | Level III OB unit | OB-NICU | Both are >80% | Either is <20% |
|
| ||||||
| I | United States | 92.8 | 90.5 | −2.4 | √ | |
|
| ||||||
| Connecticut | 99.8 | 99.8 | 0.0 | √ | ||
|
| ||||||
| Maine | 89.4 | 83.4 | −6.1 | √ | ||
|
| ||||||
| Massachusetts | 98.6 | 98.6 | 0.0 | √ | ||
|
| ||||||
| New Hampshire | 97.1 | 97.4 | 0.3 | √ | ||
|
| ||||||
| Rhode Island | 98.6 | 98.8 | 0.2 | √ | ||
|
| ||||||
| Vermont | 89.3 | 92.9 | 3.6 | √ | ||
|
| ||||||
| II | New Jersey | 99.1 | 97.5 | −1.6 | √ | |
|
| ||||||
| New York | 97.1 | 96.9 | −0.2 | √ | ||
|
| ||||||
| III | Delaware | 80.5 | 97.1 | 16.6 | √ | |
|
| ||||||
| District of Columbia | 99.0 | 99.0 | 0.0 | √ | ||
|
| ||||||
| Maryland | 95.5 | 96.8 | 1.2 | √ | ||
|
| ||||||
| Pennsylvania | 97.9 | 94.6 | −3.3 | √ | ||
|
| ||||||
| Virginia | 96.6 | 97.5 | 0.9 | √ | ||
|
| ||||||
| West Virginia | 80.3 | 87.4 | 7.2 | √ | ||
|
| ||||||
| IV | Alabama | 87.1 | 75.7 | −11.4 | ||
|
| ||||||
| Florida | 96.7 | 92.8 | −3.9 | √ | ||
|
| ||||||
| Georgia | 93.5 | 96.5 | 3.0 | √ | ||
|
| ||||||
| Kentucky | 84.0 | 86.4 | 2.4 | √ | ||
|
| ||||||
| Mississippi | 81.4 | 69.1 | −12.3 | |||
|
| ||||||
| North Carolina | 97.9 | 98.7 | 0.9 | √ | ||
|
| ||||||
| South Carolina | 94.2 | 94.8 | 0.6 | √ | ||
|
| ||||||
| Tennessee | 94.9 | 93.0 | −1.9 | √ | ||
|
| ||||||
| V | Illinois | 96.4 | 91.6 | −4.7 | √ | |
|
| ||||||
| Indiana | 95.6 | 95.1 | −0.5 | √ | ||
|
| ||||||
| Michigan | 94.7 | 91.1 | −3.6 | √ | ||
|
| ||||||
| Minnesota | 84.8 | 79.9 | −5.0 | |||
|
| ||||||
| Ohio | 95.8 | 96.5 | 0.7 | √ | ||
|
| ||||||
| Wisconsin | 91.0 | 84.9 | −6.1 | √ | ||
|
| ||||||
| VI | Arkansas | 66.3 | 60.1 | −6.2 | ||
|
| ||||||
| Louisiana | 97.8 | 91.8 | −5.9 | √ | ||
|
| ||||||
| New Mexico | 59.7 | 63.7 | 4.0 | |||
|
| ||||||
| Oklahoma | 75.6 | 84.4 | 8.8 | |||
|
| ||||||
| Texas | 94.6 | 85.8 | −8.7 | √ | ||
|
| ||||||
| VII | Iowa | 73.8 | 91.9 | 18.1 | ||
|
| ||||||
| Kansas | 76.2 | 77.9 | 1.7 | |||
|
| ||||||
| Missouri | 84.9 | 80.4 | −4.5 | √ | ||
|
| ||||||
| Nebraska | 71.7 | 71.6 | −0.1 | |||
|
| ||||||
| VIII | Colorado | 89.5 | 94.3 | 4.7 | √ | |
|
| ||||||
| Montana | 45.4 | 45.4 | 0.0 | |||
|
| ||||||
| North Dakota | 73.8 | 22.0 | −51.8 | |||
|
| ||||||
| South Dakota | 57.8 | 43.4 | −14.4 | |||
|
| ||||||
| Utah | 93.3 | 91.4 | −1.9 | √ | ||
|
| ||||||
| Wyoming | 16.1 | 16.2 | 0.2 | √ | ||
|
| ||||||
| IX | Arizona | 89.2 | 89.6 | 0.4 | √ | |
|
| ||||||
| California | 97.8 | 96.2 | −1.6 | √ | ||
|
| ||||||
| Hawaii | 64.1 | 63.9 | −0.1 | |||
|
| ||||||
| Nevada | 95.4 | 75.2 | −20.2 | |||
|
| ||||||
| X | Alaska | 55.8 | 1.9 | −53.9 | √ | |
|
| ||||||
| Idaho | 76.4 | 58.6 | −17.8 | |||
|
| ||||||
| Oregon | 90.3 | 72.5 | −17.8 | |||
|
| ||||||
| Washington | 90.4 | 95.2 | 4.8 | √ | ||
Data sources included the following: NICUs and neonatologists of the United States and Canada, Directory 2011 (electronic version); population, US Census 2010, summary file 1, downloaded from the University of Missouri on April 6, 2012; OB units, AHA 2011 hospital database.
AHA, American Hospital Association; HHS, Health and Human Services; NICU, newborn intensive care unit; OB, obstetrical.
In 13 states within regions 6–10 (primarily states west of the Mississippi River), fewer than 80% of the women of reproductive age had access to an OCCU, and in 13 states fewer than 80% of the women of reproductive-age population had access to an NICU. Across all regions, 21 states had less than 80% of women of reproductive age located within 50 miles of both OCCUs and NICUs, and 3 states (Alaska, North Dakota, and Wyoming) had less than 20% of their population located within 50 miles of both an OCCU and NICU.
The results for Alaska, North Dakota, and Wyoming are driven by insufficient OCCUs in Alaska and North Dakota; and an absence of both OCCUs and NOCUs in Wyoming. Although both Alaska and North Dakota show OCCUs (Figure 1A), the 50 mile access zones do not cover a sufficient proportion of the state’s population of reproductive-age women, and neither state has a practicing maternal-fetal subspecialist (Figure 3A). A small proportion of the Wyoming population have access to critical care facilities in neighboring states (16%), however, only 2% of women of reproductive age in Alaska had access to an OCCU in a relatively nearby state (Washington).
FIGURE 1. Reproductive-age women within 50 miles of a perinatal critical care unit.
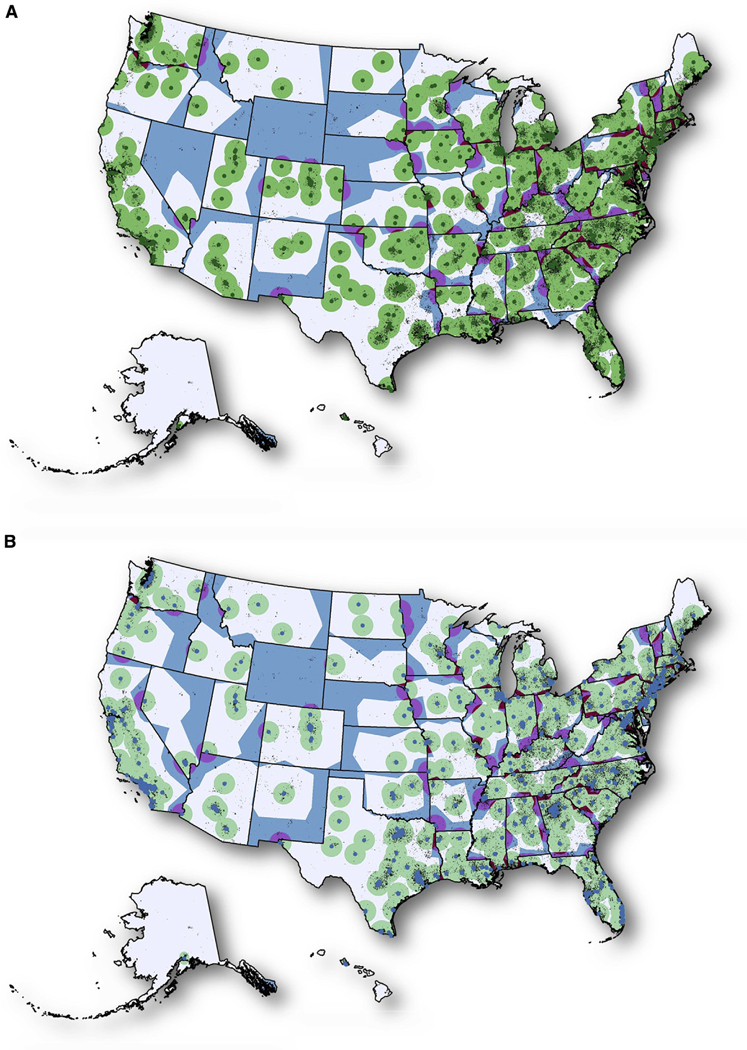
Women of reproductive age (ages 15–44 years) living within 50 miles of a perinatal critical care unit, by subspecialty and state, 2012. A, Access to level III obstetric critical care unit. Green areas indicate access in state, dark red areas indicate access in state but closest obstetric critical care unit is out of state, purple areas indicate access but to obstetric critical care unit out of state, white areas indicate no access, but closest obstetric critical care unit is in state, blue areas indicate no access and closest obstetric critical care unit is out of state, and splatter indicates populated area. B, Access to level III or higher neonatal intensive care unit. Green areas indicate access in state, dark red areas indicate access in state, but closest neonatal intensive care unit is out of state, purple areas indicate access, but neonatal intensive care unit is out of state, white areas indicate no access but closest neonatal intensive care unit is in state, blue areas indicate no access, and closest neonatal intensive care unit is out of state, and splatter indicates populated area.
FIGURE 3. Relationship of perinatal practitioners and perinatal critical care facilities.

Relationship of perinatal practitioners and perinatal critical care facilities: perinatal critical care hospitals overlaid with office location of perinatal specialists, United States, 2013. A, Maternal fetal-medicine practitioners and obstetric critical care units. Black circles indicate maternal-fetal medicine practitioner, and green circles indicate obstetric critical care unit. B, Neonatologists and neonatal intensive care units. Black circles indicate neonatologists, and purple circles indicate neonatal intensive care unit.
More than 90% of states had women of reproductive age living closer to a critical care facility in a neighboring state than to one in their residing state (Figure 1, A and B). In total, 8.0% of women of reproductive age (approximately 5.0 million women) were closer (ignoring the 50 mile spatial proximity) to an OCCU in a neighboring state than their state of residence, 6.3% (approximately 3.9 million women) were closer to an NICU in a neighboring state, and 9.8% (approximately 6.1 million women) were closer to both critical care units in a neighboring state.
An estimated 2.3% of women of reproductive age (approximately 1.4 million women) had access (within a 50 mile spatial proximity) through an OCCU only in a neighboring state, 2.0% (approximately 1.2 million women) had access through an NICU only in a neighboring state, and 2.4% (approximately 1.5 million women) had access to both critical care units only through a neighboring state.
In 23 states, women of reproductive age were less likely to have access to OCCUs than to NICUs, and in 8 of those states, the difference in access was greater than 10% (Table 2). Conversely, women of reproductive age in 12 states had more access to OCCUs than NICUs, and in 2 of those states (Delaware and Iowa), the difference in access was greater than 10%. In 16 states and the District of Columbia, there was no difference or the difference was less than ±1% between access to OCCUs and NICUs.
Sixty-seven percent of OCCUs were adjacent with an NICU, whereas 49% of NICUs were adjacent with an OCCU. Eighteen percent of OCCUs and 20% of NICUs did not have a complementary critical care unit within 10 miles (Figure 2). Clustering of OCCUs and of NICUs was observed. Sixty-one percent of OCCUs had 1 or more OCCUs located within 10 miles, and 77% of NICUs had 1 or more NICUs located within 10 miles.
FIGURE 2. Proximity relationship of perinatal units.

Proximity relationship of perinatal units: 10 mile zones around hospitals with level III or higher obstetric and/or neonatal critical care units, United States, 2012. Dark green circles indicate obstetric critical care unit and neonatal intensive care unit are adjacent, green circles indicate an obstetric critical care unit, and pink circles indicate neonatal intensive care unit. Note: the zone sizes for Alaska and Hawaii were modified to enable visualization.
The availability of subspecialist practitioners to specialized care units varied by subspecialty. Overall, 26% of OCCUs did not have a MFM specialist practicing within 10 miles of the facility, whereas only 4% of NICUs did not have a neonatologist within 10 miles (Figure 3, A and B). In addition, only 65% of OCCUs had more than 1 MFM specialist within 10 miles, whereas 91% of NICUs had more than 1 neonatologist within 10 miles of the facility. Lastly, 10% of MFM specialists practiced more than 10 miles away from an OCCU, whereas only 3% of neonatologists practiced more than 10 miles away from an NICU.
Comment
We provide a spatial assessment of both obstetric and neonatal critical care. Evidence of gaps in access and discordance between obstetric and neonatal critical care was identified, with OCCUs and NICUs (level III or higher) operating without a complementary critical care unit (level III or higher) nearby (within 10 miles). We defined access based on distance to the nearest OCCU or NICU. Distance is only 1 component of access, but it is a fundamental one.
We also identified clustering of critical care hospitals, with multiple OCCUs and NICUs operating within 10 miles of each other. In addition, access to obstetric critical care lags behind that for neonatal critical care in 4 ways: (1) fewer hospitals had OCCUs, compared with NICUs; (2) fewer MFM specialists were currently practicing medicine, compared with neonatologists; (3) more OCCUs were operating without an MFM specialist nearby, compared with NICUs operating without a neonatologist nearby; and (4) fewer OCCUs had multiple MFM specialists nearby, compared with NICUs that had multiple neonatologists nearby.
Such disparate capabilities in obstetric and neonatal care are discouraged.31 Whereas the majority of women of reproductive age in the United States have access to obstetric and neonatal critical care, access varies widely across states. For almost 10% of women, the timeliest access to both obstetric and neonatal critical care is in a neighboring state. Our findings underscore the need for improved perinatal regionalization coordination within and between states and a renewed focus on maternal critical care.
Critically ill mothers are more likely than non–critically ill mothers to have critically ill infants. For example, surges of critically ill neonates have resulted from previous public health emergencies affecting pregnant women, such as iatrogenic prematurity secondary to the H1N1 pandemic.32 In addition, the growing number of reproductive-age women with chronic health conditions (eg, diabetes and hypertension) may be increasing the need for perinatal critical care services.33 Planning and coordination between OCCUs and neonatal critical care units is essential for mitigating both maternal and neonatal morbidity and mortality.31
A one-size-fits-all approach to perinatal regionalization will not likely be effective. First, perinatal critical care services are located almost exclusively in urban areas. States with large rural and frontier areas will have to utilize existing alternative regionalization approaches, such as telemedicine and formal agreements with facilities in neighboring states, to ensure access for their populations.31 Second, the unique geographic areas of Alaska and Hawaii have no adjacent state in which citizens can easily obtain out-of-state care, requiring special consideration compared with approaches for the 48 contiguous states.
Misclassification of critical care designations may have occurred because on-site validation was not conducted. Neonatal levels of care were assigned and verified by the AAP through direct contact with NICU directors. OCCUs were self-reported in the AHA annual hospital survey. AHA data may be used to determine reimbursement amounts, providing a potential incentive to overestimate critical care capabilities. However, we reduced the potential for overestimating OCCUs by verifying that an MFM specialist was currently practicing at the facility. Therefore, the amount of misclassification is believed to be minimal, with no substantial effect on conclusions.
In addition, differences in the numbers of MFM specialists and neonatologists supports our finding of differences between the number of OCCUs and NICUs, despite potential misclassification. We do not have information about how much time neonatologists and MFM specialists spend in direct clinical care and how academic clinicians might differ from private practice clinicians in patterns of care delivery. The discordance identified raises questions about what might be the ideal distribution as it relates to outcomes.
Maternal and neonatal levels of care were developed and endorsed by national bodies (American College of Obstetricians and Gynecologists and AAP, respectively). However, implementation of nationally endorsed policies vary between states, and not all states define and assess critical care capabilities equally.16 Most states have women of reproductive age living closer to a critical care facility in a neighboring state than to one in their residing state. Assuring there are not barriers that inhibit women from receiving care across state borders will likely help prevent gaps in access.
Clustering of services and providers are potential barriers to accessing maternal and neonatal critical care. Whereas competition within a cluster could promote high-quality care, it could also result in marginalizing portions of the population. As US efforts to reduce maternal and infant mortality continue, it will be important to consider opportunities for strengthening this dyad of critical care and eliminating gaps in access. The recently proposed maternal levels of care put forth jointly by the American College of Obstetricians and Gynecologists and the Society for Maternal-Fetal Medicine is one such opportunity.10
Access gaps and discordance between the availability of obstetric and neonatal critical care may affect delivery of appropriate care for high-risk maternal fetal dyads. In addition, the growing number of reproductive-age women with chronic health conditions and congenital disabilities may be increasing the need for maternal critical care services. Further study is needed to better understand the importance of these gaps and discordance on maternal and neonatal outcomes.■
Footnotes
The views expressed herein are those of the authors and do not necessarily represent the official position of the Centers for Disease Control and Prevention.
The authors report no conflict of interest.
References
- 1.Wang HE, Yealy DM. Distribution of specialized care centers in the United States. Ann Emerg Med 2012;60:632–7.e7. [DOI] [PubMed] [Google Scholar]
- 2.Paneth N, Kiely JL, Wallenstein S, Marcus M, Pakter J, Susser M. Newborn intensive care and neonatal mortality in low-birth-weight infants: a population study. N Engl J Med 1982;307: 149–55. [DOI] [PubMed] [Google Scholar]
- 3.Gortmaker S, Sobol A, Clark C, Walker DK, Geronimus A. The survival of very low-birth weight infants by level of hospital of birth: a population study of perinatal systems in four states. Am J Obstet Gynecol 1985;152: 517–24. [DOI] [PubMed] [Google Scholar]
- 4.Lasswell SM, Barfield WD, Rochat RW, Blackmon L. Perinatal regionalization for very low-birth-weight and very preterm infants: a meta-analysis. JAMA 2010;304: 992–1000. [DOI] [PubMed] [Google Scholar]
- 5.Menard MK, Liu Q, Holgren EA, Sappenfield WM. Neonatal mortality for very low birth weight deliveries in South Carolina by level of hospital perinatal service. Am J Obstet Gynecol 1998;179:374–81. [DOI] [PubMed] [Google Scholar]
- 6.Sullivan SA, Hill EG, Newman RB, Menard MK. Maternal-fetal medicine specialist density is inversely associated with maternal mortality ratios. Am J Obstet Gynecol 2005;193: 1083–8. [DOI] [PubMed] [Google Scholar]
- 7.MacDorman MF, Hoyert DL, Mathews TJ. Recent declines in infant mortality in the United States, 2005e2011. NCHS Data Brief 2013:1–8. [PubMed] [Google Scholar]
- 8.United Nations Interagency Group for Child Mortality Estimation. Levels and trends in child mortality. New York (NY): United Nations Children’s Fund, World Health Organization, The World Bank, United Nations Population Division; 2014. [Google Scholar]
- 9.Callaghan WM. Overview of maternal mortality in the United States. Semin Perinatol 2012;36:2–6. [DOI] [PubMed] [Google Scholar]
- 10.Menard MK, Kilpatrick S, Saade G, et al. Levels of maternal care. Am J Obstet Gynecol 2015;212:259–71. [DOI] [PubMed] [Google Scholar]
- 11.Clay L, McElroy K. Toward improving the outcome of pregnancy: the 90s and beyond. March of Dimes Birth Defects Foundation, 1993. J Nurse Midwifery 1994;39. 338–38. [Google Scholar]
- 12.American Academy of Pediatrics Committee on Fetus and Newborn. Levels of neonatal care. Pediatrics 2012;130:587–97. [DOI] [PubMed] [Google Scholar]
- 13.Hankins GD, Clark SL, Pacheco LD, O’Keeffe D, D’Alton M, Saade GR. Maternal mortality, near misses, and severe morbidity: lowering rates through designated levels of maternity care. Obstet Gynecol 2012;120:929–34. [DOI] [PubMed] [Google Scholar]
- 14.D’Alton ME, Bonanno CA, Berkowitz RL, et al. Putting the “M” back in maternal-fetal medicine. Am J Obstet Gynecol 2013;208: 442–8. [DOI] [PubMed] [Google Scholar]
- 15.Health Resources and Services Administration. Collaborative improvement and innovation network to reduce infant mortality. Rockville (MD): Health Resources and Services Administration; 2015. [Google Scholar]
- 16.Blackmon LR, Barfield WD, Stark AR . Hospital neonatal services in the United States: variation in definitions, criteria, and regulatory status, 2008. J Perinatol 2009;29: 788–94. [DOI] [PubMed] [Google Scholar]
- 17.Longley P. Geographical information systems: principles, techniques, management and applications. Wiley. [Google Scholar]
- 18.United States Census Bureau. 2010. Census TIGER/line shape files and TIGER/line files. [Google Scholar]
- 19.2010 Census Summary File 1. Suitland (MD): United States Census Bureau. [Google Scholar]
- 20.National Center for Health Statistics. 2012 natality file. 2012. [Google Scholar]
- 21.Centers for Medicaid and Medicare Services. National provider index. [Google Scholar]
- 22.American Hospital Association. 2012 American Hospital Association dataset. Chicago (IL): American Hospital Association; 2012. [Google Scholar]
- 23.American Academy of Pediatrics. 2012 neonatologist and neonatal intensive care unit directory. Elk Grove Village (IL): American Academy of Pediatrics; 2012. [Google Scholar]
- 24.National Geospatial Intelligence Agency. 2010 Homeland Security infrastructure program gold hospital dataset. Springfield (VA): National Geospatial Intelligence Agency; 2010. [Google Scholar]
- 25.Mitchell A ESR Institute. The ESRI guide to GIS analysis: geographic patterns & relationships. Redlands (CA): ESRI Press; 1999. [Google Scholar]
- 26.Mitchell A, Institute ESR. The ESRI guide to GIS analysis: modeling suitability, movement, and interaction. Redlands (CA): ESRI Press; 2012. [Google Scholar]
- 27.Sinton DS, Lund JJ. Understanding place: GIS and mapping across the curriculum. Red- lands (CA): ESRI Press; 2007. [Google Scholar]
- 28.Lerner EB, Moscati RM. The golden hour: scientific fact or medical “urban legend”? Acad Emerg Med 2001;8:758–60. [DOI] [PubMed] [Google Scholar]
- 29.Yantzi N, Rosenberg MW, Burke SO, Harrison MB. The impacts of distance to hospital on families with a child with a chronic condition. Soc Sci Med 2001;52:1777–91. [DOI] [PubMed] [Google Scholar]
- 30.Friedman SA, Frayne SM, Berg E, et al. Travel time and attrition from VHA care among women veterans: how far is too far? Med Care 2015;53:S15. [DOI] [PMC free article] [PubMed] [Google Scholar]
- 31.American Academy of Pediatrics and The American College of Obstetricians and Gynecologists. Guidelines for perinatal care. 7th ed. Elk Grove (IL), American Academy of Pediatrics; Washington (DC): American College of Obstetricians and Gynecologists; 2012. [Google Scholar]
- 32.Centers for Disease Control and Prevention. Maternal and infant outcomes among severely ill pregnant and postpartum women with 2009 pandemic influenza A (H1N1)—United States, April 2009eAugust 2010. MMWR Morb Mortal Wkly Rep 2011;60:1193–6. [PubMed] [Google Scholar]
- 33.Hayes DK, Fan AZ, Smith RA, Bombard JM. Trends in selected chronic conditions and behavioral risk factors among women of reproductive age, behavioral risk factor surveillance system, 2001e2009. Prev Chronic Dis 2011;8: A120. [PMC free article] [PubMed] [Google Scholar]