

Abstract
Despite a more than 100‐year effort to combat malaria, it remains one of the most malignant infectious diseases globally, especially in Africa. Malaria is transmitted by several Anopheles mosquitoes. However, until now few studies have investigated future range dynamics of major An. mosquitoes in Africa through a unified scheme. Through a unified scheme, we developed 21 species distribution models to predict the range dynamics of 21 major An. species in Africa under future scenarios and also examined their overall range dynamic patterns mainly through suitability overlap index and range overlap index. Although future range dynamics varied substantially among the 21 An. species, we predicted large future range expansions for all 21 An. species, and increases in suitability overlap index were detected in more than 90% of the African continent for all future scenarios. Additionally, we predicted high range overlap index in West Africa, East Africa, South Sudan, Angola, and the Democratic Republic of the Congo under future scenarios. Although the relative impacts of land use, topography and climate variables on the range dynamics depended on species and spatial scale, climate played the strongest roles in the range dynamics of most species. Africa might face an increasing risk of malaria transmissions in the future, and better strategies are required to address this problem. Mitigating climate change and human disturbance of natural ecosystems might be essential to reduce the proliferation of An. species and the risk of malaria transmissions in Africa in the future. Our strategies against their impacts should be species‐specific.
Keywords: Africa, Anopheles species, future scenarios, malaria transmission, range dynamics
We used a unified scheme and developed 105 species distribution models to examine the range dynamics of as many as 21 major An. species in Africa through several novel ecological indicators. Although the range ratio indices differed substantially among the species, the ranges of all species were predicted to increase in the future. Additionally, increases in the suitability overlap index of all 21 An. species was predicted for more than 90% of the African continent. Our results suggested that Africa might face increasing threats of malaria epidemics in the future.

1. INTRODUCTION
Although more than 100 years have been spent trying to combat malaria, it remains one of the most malignant infectious diseases worldwide (Hay et al., 2004; Nájera et al., 2011; Okumu et al., 2022; World Health Organization, 2023). Approximately 250 million malaria cases and 600,000 malaria deaths have annually occurred in the world in recent decades (World Health Organization, 2023). The disease is a major problem in tropical regions, especially in Africa, posing a substantial threat to people in Africa (Semakula et al., 2017; World Health Organization, 2023). Malaria is a vector‐transmitted disease; therefore, vector control is an effective countermeasure in Africa (Amadi et al., 2018; Benelli & Beier, 2017; Sherrard‐Smith et al., 2022; Sougoufara et al., 2020; Tawe et al., 2017). The detection of hotspots is required for efficient vector control. Therefore, predicting distribution patterns or potential ranges of malaria vectors (i.e., Anopheles mosquitoes) has attracted much attention in recent years. Most studies focused on several major malaria vectors, e.g., An. gambiae complex, and An. funestus (Adeogun et al., 2023; Mataba et al., 2023; Mboera et al., 2015; Mmbando et al., 2021). However, few studies have investigated the future range dynamics of all major An. species in Africa through a unified scheme, and thereby detected their overall priority regions and compared their risks. For example, although both Akpan et al. (2019) Olabimi et al. (2021) and projected the future range dynamics of Anopheles gambiae in Africa, they adopted different predictors, spatial scales and future scenarios, which, to a certain extent, rendered the two studies not comparable.
Climate change has been expected to influence the ranges of malaria vectors, i.e., An. mosquitoes (Carlson et al., 2023; Li et al., 2021; Olabimi et al., 2021) because climate conditions strongly affect the development and life history of An. mosquitoes (e.g., Agyekum et al., 2021; Oliver & Brooke, 2017; Zengenene et al., 2021). Although the range dynamics in An. mosquitoes in Africa in the future have received much attention (e.g., Akpan et al., 2019; Alimi et al., 2015; Ryan et al., 2023), substantial controversy remains. For example, Drake and Beier (2014) projected a range loss of An. arabiensis in Africa in the future, which was supported by the findings of Peterson (2009). In contrast, Alimi et al. (2015) detected the opposite patterns of range shifts of An. mosquitoes. Additionally, Olabimi et al. (2021) projected that the range dynamics of An. gambiae in Southwest Nigeria in the future depended on the general circulation models (GCMs) used to project climate conditions in the future, i.e., range contraction or expansions. Therefore, range shifts of An. mosquitoes in the future require more in‐depth study.
In addition to climate change, anthropogenic habitat disturbance, primarily land‐use change, could significantly affect range shifts in An. mosquitoes because land‐use change might modify An. mosquito habitat (Omukunda et al., 2012). An increase in cultivated land (farmland) and a decrease in natural land cover generally cause range expansions of An. mosquitoes. For example, an increase in rain‐fed cropland and a decrease in natural vegetation cover might cause range expansions of An. mosquitoes, increasing the risk of malaria cases in sub‐Saharan Africa (Shah et al., 2022). Moreover, Omukunda et al. (2012) detected range expansions of An. gambiae and An. funestus in Western Kenya due to swamp cultivation. Although anthropogenic habitat disturbance might substantially affect the potential ranges of malaria vectors, its influences relative to climate change remain controversial. For example, climate change had a larger influence on the range shifts of dominant malaria vector species in Nigeria than land‐use change (Akpan et al., 2019). This finding was supported by Adeogun et al. (2023). However, Ageep et al. (2009) detected stronger influences of land use on the range shifts of An. arabiensis in northern Sudan than climate change. Therefore, the relative influences of land use change and climate change on the range dynamics in An. mosquitoes require further investigations.
Topographical factors (slope, aspect, and elevation) might represent barriers to species dispersal (Virkkala et al., 2010) and can substantially modify the spatial allocations of energy and water, resulting in various habitats (Dudov, 2017; Luoto & Heikkinen, 2008; Tang et al., 2018). Although it is well known that climate change and anthropogenic disturbances significantly affect the range of An. mosquitoes in Africa, the influences of topography should not be overlooked. For example, Adeogun et al. (2023) detected the impacts of topographical factors on the ranges of An. coluzzii, An. gambiae, and An. arabiensis in Nigeria. Additionally, Mwakalinga et al. (2018) argued that topographical factors might be responsible for the major variation in the distribution of malaria vectors in Tanzania. However, the effects of topographical factors relative to climate are unknown. For example, Gwitira et al. (2015) detected stronger influences of topographical variables than of climate predictors on the ranges of An. arabiensis in Zimbabwe, which was supported by the findings by Tanga et al. (2010) and Alimi et al. (2015). However, the observations of Adeogun et al. (2023) showed opposite patterns. Thus, the relative influences of topography and climate on the ranges of An. mosquitoes require additional research.
The present study aimed to use a unified scheme to examine future range dynamics of major An. mosquitoes in Africa through adopting unified spatial scale, future scenarios, candidate predictors and candidate algorithms, et al. We hypothesized that the range dynamics of An. mosquitoes and the relative influences of topography, land use and climate on the range dynamics might depend on the species. Therefore, we used topography, land use and climate data to assess the range dynamics of 21 An. species in Africa. We hope our study can provide meaningful information for devising strategies to prevent the spread of malaria vectors.
2. METHODS
2.1. Occurrences of An. Mosquitoes in Africa
From a published compendium by Kyalo et al. (2016), we retrieved the initial list of 23 An. species in Africa (Figure 1). There were 23 items of An. species in this compendium. In our study, we combined An. funestus s.l and An. funestus s.s. into a species, i.e., An. funestus. We also incorporated savannah or Bamako forms of An. gambiae into An. gambiae. Therefore, we totally obtained 21 An. species in Africa. We used two sources to determine the occurrences of An. mosquitoes in Africa, i.e., a published compendium of occurrence data of malaria vectors in Africa (Kyalo et al., 2016) and the Global Biodiversity Information Facility (GBIF) database, a widely accepted comprehensive online dataset of global species occurrence records containing more than 2.6 billion records from approximately 2100 publishing institutions, 90,000 datasets, and 9300 publications. We retrieved 39,848 records for An. mosquitoes in Africa from the published compendium of occurrence data (Kyalo et al., 2016) and 154,989 records from the GBIF database. Then, we generated a preliminary occurrence dataset for each species, totally including 194,837 records of 21 An. species. As suggested by Nie and Feng (2023), we only retained occurrence records with an uncertainty of geographical coordinates of less than 5 km. We considered the sampling bias effects and thinned the occurrences with a 5 km radius for each An. species individually (Brown et al., 2017; Liu et al., 2020). We finally built a final occurrence dataset for each species, totally containing 22,714 records of An. mosquitoes (Figure 1, Data S1).
FIGURE 1.

Occurrences of 21 Anopheles species in Africa. Records were compiled from the Global Biodiversity Information Facility (GBIF) and a published compendium by Kyalo et al. (2016). There was a total of 22,716 occurrence records after spatial rarefication.
2.2. Predictors for species distribution model
We used 30 factors to predict the potential ranges and habitat suitability of each An. species individually, including climate (19), land use (8), and topographical (3) factors. The spatial resolution of the 19 climatic variables was 2.5 arc‐min. They included eight precipitation and 11 temperature predictors (Fick & Hijmans, 2017). The climate predictors for the current and future scenarios were retrieved from Worldclim (Fick & Hijmans, 2017). The current climatic predictors were extracted from the climatic datasets for the near‐current period in Worldclim (Fick & Hijmans, 2017). The climate variables used for the future scenario in 2100 were calibrated using the global climate models (GCMs) FIO‐ESM‐2‐0 (F) and MPI‐ESM1‐2‐HR (M), the two most robust and complementary GCMs (Zhang et al., 2022). We adopted two Shared Socio‐Economic Pathways (SSPs) in 2100, i.e., SSP126 (126) and SSP585 (585), representing the most optimistic and pessimistic future climate change scenarios in 2100, in this order. Totally, five sets of climatic predictors were created, i.e., predictors under current scenario, predictors under SSP126 scenario calibrated by the GCM FIO‐ESM‐2‐0 (F126), predictors under SSP585 scenario calibrated by the GCM FIO‐ESM‐2‐0 (F585), predictors under SSP126 scenario calibrated by the GCM MPI‐ESM1‐2‐HR (M126), and predictors under SSP585 scenario calibrated by the GCM MPI‐ESM1‐2‐HR (M585). Therefore, for each species' potential ranges, we had five scenarios, i.e., current, F126, F585, M126, and M585 scenarios.
Eight land use types under current and future scenarios were obtained from the Land‐Use Harmonization dataset (LUH2) (https://luh.umd.edu/) with a spatial resolution of 0.25 arc degree: rangeland, non‐forested primary land, forested primary land, managed pasture, forested secondary land, cropland, urban land, and non‐forested secondary land fractions. There were three scenarios for land use datasets, i.e., current scenario, SSP126 scenario in 2100 and SSP585 scenario in 2100. The source data of topographical factors (i.e., slope, elevation, and aspect), i.e., digital elevation model (DEM), were retrieved from Worldclim with 0.5 arc‐min‐spatial‐resolution (ca. 1 km) (Fick & Hijmans, 2017). We extracted elevation from the DEM and calculated slope and aspect on the basis of the DEM at the 0.5 arc‐min resolution. Then, we used majority method to resample elevation, slope and aspect to a coarser resolution of 2.5 arc‐min, i.e., determining the value of each pixel based on the most popular value within a 3 by 3 window. The topographical predictors remain unchanged under five scenarios. The spatial data of the factors were or resampled to a resolution of 2.5 arc‐min.
2.3. Selection of predictors
We created preliminary species distribution models (SDMs) for each species individually through Biomod2, an ensemble platform for species distribution modeling (Thuiller et al., 2009), and used jackknife technique to determine each predictor's importance which were represented by its importance value outputted by the preliminary SDMs (Data S2). We used 10 algorithms: Flexible Discriminant Analysis, Artificial Neural Network, Multiple Adaptive Regression Splines, Generalized Linear Model, Classification Tree Analysis, Generalized Boosting Model, Random Forest for Classification and Regression, Maximum Entropy Model, Surface Range Envelope and EXtreme Gradient Boosting (Thuiller et al., 2009). We used following methods to downscale all predictors, i.e., bioclimatic, land‐use and topographical variables. Firstly, Pearson's correlation analyses were performed to determine the collinearity between predictor pairs using |.7| as the threshold (Nie & Feng, 2023) (Data S3). Then, if high collinearity was identified between a pair, the predictor with the lower IV was removed. The retained variables were input into the final SDMs to project the species' maps of habitat suitability index and potential ranges for each species individually, as well as the importance value of each predictor.
2.4. Predicting habitat suitability and potential ranges
For each species individually, we predicted the maps of habitat suitability index and ranges of the An. species using Biomod2, an ensemble platform for species distribution modeling (Thuiller et al., 2009), and the 10 candidate algorithms used in our preliminary SDMs were adopted (R code available at https://doi.org/10.7910/DVN/HYI36S). As recommended by Thuiller et al. (2009), a three‐fold random selection was conducted to determine pseudo‐absences (PAs) across African continent. If the number of occurrences of the An. species was <1000, 1000 PAs were randomly generated; otherwise, the amount of PAs was equal to that of the An. species (Barbet‐Massin et al., 2012). We created initial habitat suitability index maps of each An. species, individually. Then, we adopted the maximum sensitivity–specificity (MSS) approach (Liu et al., 2016) to transform habitat suitability index maps of each An. species into binary values of potential/no‐potential ranges of each An. species, individually.
For each species individually, we adopted five‐fold cross‐validation to evaluate the SDMs' performances. We randomly selected 70% of the records to train the SDMs and the remaining 30% to assess the SDMs's reliability (Yang et al., 2021). For each species individually, we removed algorithms with true skill statistic (TSS) of less than 0.6 and area under the curve (AUC) of less than 0.8 (Della Rocca & Milanesi, 2022; Nie & Feng, 2023). Therefore, algorithms used in the final SDMs were species‐specific (Data S4). To obtain assembled SDM projection, we gave each model's projection a weight proportional to their TSS evaluation. In total, we developed 21 baseline SDMs to project habitat suitability index and potential ranges of the 21 An. species under current scenarios. The predictors under future scenarios were inputted into 21 baseline SDMs to predict future ranges for each species, individually.
2.5. Predicting shifts in habitat suitability and potential ranges
The habitat suitability index shifts for each An. species were individually estimated by subtracting the map of habitat suitability indices under the future scenario from the map under the current scenario. We also built and calibrated suitability overlap index (SOI) (i.e., ) maps through overlap habitat suitability maps of the 21 An. species under each scenario individually, in which HSI was the habitat suitability index. Similarly, we obtained the maps of suitability overlap index shifts for the 21 An. species by subtracting the maps of suitability overlap indices under the future scenario from the maps under the current scenario. Finally, as suggested by Chen et al. (2013), we used Natural Breaks (Jenks) approach to categorize maps of suitability overlap index and the changes in suitability overlap index. We divided the potential ranges of each species into three categories: expanding ranges (ER), unfilling ranges (UR) and stabilizing ranges (SR), which represented ranges only occupied under in the future, those occupied only in the current period, and those occupied under current and future scenarios, respectively (Nie & Feng, 2023). Accordingly, the ranges under the current situation (RC) were the total of the SR and UR, and those under the future scenarios (RF) were the sum of ER and SR (Nie & Feng, 2023). The shifts in potential ranges for the An. species were assessed using the range ratio (RR) and range similarity (RS) (Nie & Feng, 2023). The RR was used to compare the sizes of the RC and RF:
If RR < 1, RF is smaller than RC.
The RS was estimated to investigated the changes in range positions for the An. species from the current to the future scenarios:
where OR is the ranges shared by the current and future scenarios for each species. If RS < 0.5, An. mosquito under future and current scenarios potentially occupied different range positions.
We also created and calibrated maps of range overlap index (ROI), which was rendered as follows:
in which PR i was the potential ranges of each species. For each scenario individually, we retrieved the range overlap index maps through overlapping the potential ranges of all 21 An. species, and assessed their spatial patterns. Through similar methods, we also obtained maps of expanding range overlap index (EROI), unfilling range overlap index (UROI) and stabilizing range overlap index (SROI) of the 21 species for each scenario individually, and examined their spatial patterns.
3. RESULTS
3.1. Reliability of the species distribution models
The AUC scores of the species distribution models for the 21 An. species ranged from 0.937 to 0.992, with an average of 0.966 ± 0.016. The TSSs ranged from 0.715 to 0.940, with an average of 0.819 ± 0.061 (Data S5). The high values of the AUC scores and TSSs indicated the robustness of the SDMs and the projected maps of habitat suitability and potential ranges of each An. species in Africa. Specifically, the highest AUCs (ca. 0.990) were detected in An. merus (0.992) and An. mascarensis (0.991), while the lowest AUCs were identified in An. funestus (0.948), An. squamous (0.945), An. nili (0.940) and An. gambiae complex (0.937) (Data S5). The highest TSSs (>0.900) were detected in An. merus (0.940) and An. mascarensis (0.934), while the lowest ones (<0.750) were mainly identified in An. squamous (0.733), An. gambiae complex (0.718) and An. nili (0.715) (Data S5).
3.2. Relative influences of predictors
The top predictors of the potential ranges differed for the different An. species (Figure 2, Data S6). For example, the top predictors of the ranges of An. gambiae were the minimum temperature in the coldest month (important value of 0.084), precipitation in the wettest season (0.081), and cropland (0.070) (Figure 2, Data S6). The top predictors for the ranges of An. arabiensis were temperature seasonality (0.113), mean temperature in winter (0.091), and cropland (0.068) (Figure 2, Data S6). The highest importance value (IV) (0.610) was detected in precipitation in the warmest season in the SDMs for An. mascarensis, while the lowest ones (ca. zero) varied with species (Figure 2, Data S6). In summary, the climatic predictors had the highest important values for the ranges of 20 An. species, followed by land‐use type and topography (Figure 2, Data S6). In contrast, the top predictors for the An. gambiae complex were land use factors, followed by climate and topographical factors (Figure 2, Data S6). Additionally, the importance values of the topographical predictors were lower than those of the climate and anthropogenic disturbance predictors in most SDMs (Figure 2, Data S6).
FIGURE 2.
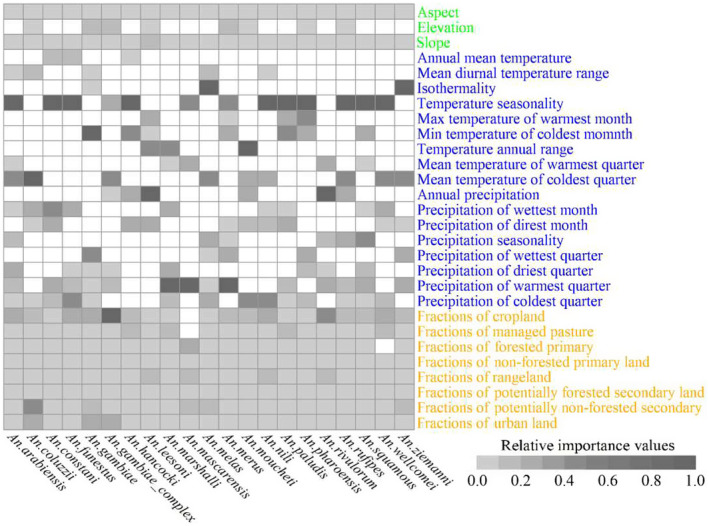
Importance of the predictors in the species distribution models. Topographic, climatic and human disturbance predictors were in green, blue and yellow, respectively. We min‐max standardized the importance values of the predictors for each species, separately. The blanks indicated that predictors were not in our final and formal models.
3.3. Habitat suitability of An. Mosquitoes in Africa
The spatial patterns of habitat suitability indices varied with scenarios. For example, An. mascarensis under the F126 scenario was projected to show high habitat suitability index in Angola and the southeastern part of Africa (Data S7), while under the M585 scenario, its high habitat suitability index was mostly projected in Central African Republic, Angola, Democratic Republic of the Congo, and the southeastern part of Africa (Data S7). The spatial patterns of habitat suitability indices were also specific. For example, An. gambiae under the F585 scenario was projected to have high habitat suitability index in East Africa and tropical regions of Africa, while for An. melas under this scenario, its high habitat suitability index was mostly detected in tropical regions of Africa (Data S7).
The spatial patterns of suitability overlap indices of the 21 An. species differed for different scenarios. Under the current and F126 scenarios, high suitability overlap indices were projected to occur in the southeastern part of Africa and the regions from the equator to 15° north latitude (Figure 3). However, under the M126, F585 and M585 scenarios, high suitability overlap indices were mostly projected in the regions from the equator to 15° north latitude, most part of East Africa and Angola.
FIGURE 3.

Suitability overlap indices of 21 Anopheles species in Africa. (a) Current conditions; (b) F126 scenario; (c) F585 scenario; (d) M126 scenario; (e) M585 scenario. Under all scenarios, high suitability overlap indices were mainly detected in the regions with latitude from equator to 15 north latitude degree in Africa, and it was also identified in Tanzania, Mozambique, Swaziland and Madagascar.
Under the F126 and M126 scenarios, substantial increases in suitability overlap indices were predicted in the southern part of West Africa, the southeastern part of Africa and Central Africa, while substantial decreases in suitability overlap indices were identified in the Central African Republic, Republic of the Congo, Cameroon, and Gabon (Figure 4). Under the current‐F585 and current‐M585 scenarios, substantial increases in suitability overlap indices were detected in the southeastern part of Africa, Central Africa and the scattered regions in southern part of West Africa. Also, under the current‐F585 and current‐M585 scenarios, considerable decreases in suitability overlap indices were mostly detected in Gabon, Central Africa, South Sudan, Sudan, and Somalia Senegal (Figure 4). Additionally, areas with decreases in suitability overlap indices covered 2.58, 2.61, 2.90, and 2.28 million km2 under the current‐F126, current‐F585, current‐M126, and current‐M585 scenarios, respectively. Areas with increases in suitability overlap indices covered 27.62, 27.59, 27.29, and 27.91 million km2. Therefore, more than ca. 90% of the African continent exhibited increases in suitability overlap indices for the 21 An. mosquitoes under current and future scenarios.
FIGURE 4.

Changes in suitability overlap index of 21 Anopheles species under current‐future scenarios in Africa. (a) Current‐F126; (b) current‐F585; (c) current‐M126; (d) current‐M585. Substantial increases in suitability overlap indices were mainly projected in the southern part of West Africa, the southeastern part of Africa and Central Africa. Under the current‐F585 and current‐M585 scenarios, substantial increases in suitability overlap indices were primarily detected in the southeastern part of Africa, Central Africa and the scattered regions in southern part of West Africa.
3.4. Potential ranges of An. Species in Africa
The MSS values differed for different An. species and scenarios (Data S8). For example, under current conditions, the MSS values were 0.450 and 0.620 for An. gambiae and An. arabiensis and 0.400 and 0.240 for An. melas in the F126 and F585 scenarios, respectively. The MSS values ranged from 0.110 to 0.770 (Data S8). The highest MSS thresholds were primarily projected in An. gambiae (0.77 under F585 scenario), An. gambiae complex (0.76 under F126 scenario) and An. gambiae complex (0.74 under M126 scenario), while the lowest ones were mainly detected in An. merus (0.11, 0.14 and 0.15 under F585, M585 and F126 scenarios, respectively) (Data S8).
The spatial patterns of the potential ranges differed for different An. species (Data S9). For example, the current ranges of An. hancocki was mainly in the western part of Central Africa, and Somalia, covering 2.12 million km2 (Table 1, Data S9), while those of An. mascarensis was in Angola, Zambia, and the southeastern part of Africa, covering 2.34 million km2 (Table 1, Data S9). The spatial patterns of the potential ranges also varied with scenarios (Table 1, Data S9). For example, the range of An. coluzzii under the current scenario was mostly projected in tropical regions of West Africa, covering 2.42 million km2, while those under the F585 scenario was mostly projected in tropical regions of Africa, Angola, East Africa, and covered 7.13 million km2 (Table 1, Data S9).
TABLE 1.
Potential ranges and range dynamics of 21 Anopheles mosquitoes under current and future scenarios.

|
Note: Cur, current scenarios; F126, F126 scenarios; F585, F585 scenarios; M126, M126 scenarios; M585, M585 scenarios; The light green, light yellow and light blue backgrounds indicated the areas of potential ranges, range ratio indices and range similarity indices, respectively. The blue highlighted indicated the top five largest potential ranges, the top five highest range ratio indices and top five highest range similarity indices under each scenario. The gray highlighted indicated the five smallest potential ranges, lowest range ratio indices and lowest range similarity indices under each scenario. Range similarity indices within frames indicated the potential ranges under current and future scenarios occupied different positions.
The sizes of the potential range varied with species and scenarios. For example, under the current scenarios, we identified the largest potential range in An. nili (6.40 million km2), and smallest one in An. merus (1.81 million km2) (Table 1). Under the F126 scenarios, the potential ranges of An. mascarensis covered 3.07 million km2, while under the F585 scenarios, it covered 2.63 million km2 (Table 1).
Accordingly, the areas covered by the potential ranges of 21 An. species ranged from 1.81 to 6.40, from 3.07 to 11.45, from 2.63 to 13.54, from 3.35 to 26.20 and from 4.06 to 13.72 million km2 under current, F126, F585, M126 and M585 scenarios, respectively (Table 1). Paired sample t‐test showed that the areas of the current potential ranges of all 21 target species were smaller than those under future scenarios (p < .01). An. funestus, An. coustani and An. nili, and An. rivulorum occurred five, four, three, and three times in the top five largest potential ranges under all scenarios, respectively (Table 1), while An. coluzzii, An. mascarensis, An. merus, and An. moucheti occurred five, five, five, and four times in the five smallest potential ranges under all scenarios (Table 1).
Although the spatial patterns of range overlap indices varied with scenarios, the regions from the equator to 15° north latitude the high range overlap indices of the all 21 An. species under future scenarios were mostly detected in the southeastern part of Africa and the regions from the equator to 15° north latitude (Figure 5).
FIGURE 5.

Range overlap indices of 21 Anopheles species. (a) Range overlap indices under current conditions; (b) range overlap indices under F126 scenario; (c) range overlap indices under F585 scenario; (d) range overlap indices under M126 scenario; (e) range overlap indices under M585 scenario. Under all scenarios, high range overlap indices were detected in West Africa and East Africa, South Sudan, Angola and Democratic Republic Congo.
3.5. Range dynamics of the An. Species in Africa
The range dynamics also differed for different An. species and scenarios (Table 1). For example, under current‐F126 scenario, range ratios in An. rivulorum and An. gambiae were 3.90 and 1.39, respectively, while under current‐F585 scenario scenarios, the range ratios were 5.46 and 1.22, respectively (Table 1). Under current‐F126 scenario, range similarity for An. merus and An. melas was 0.49 and 0.58, respectively, while under current‐M585 scenarios, the range similarity was 0.52 and 0.49, respectively. Under the F126 scenarios, the range ratios ranged from 1.06 in An. moucheti to 3.90 in An. rivulorum. An. hancocki, An. rivulorum, An. ziemanni, and An. coustani, occurred four, four, four, and three times, respectively, in the lists of the top five highest range ratios under the four future scenarios (Table 1). An. hancocki, An. rivulorum, and An. ziemanni were detected four times in the lists of the five lowest range similarity (largest shifts in range centroids) under four future scenarios (Table 1).
All An. species were projected to show range expansions under all future scenarios (i.e., all range ratios >1, Table 1). The averages of range ratios were 2.00, 2.29, 2.54, and 2.42 under F126, M126, F585 and M585 scenarios, respectively (Table 1). Most of range similarity for 21 An. species under four future scenarios were higher than 0.5 (Table 1). The averages of range similarity were 0.61, 0.59, 0.52 and 0.53 under F126, M126, F585 and M585 scenarios, respectively.
The high expanding range overlap indices of 21 An. mosquitoes under all current‐future scenarios were mostly projected to scattered in the regions from the equator to 15° north latitude, Central Africa and the southeastern part of Africa (Figure 6). The high unfilling range overlap indices under all current‐future scenarios which might be potentially occupied by the An. mosquitoes under current conditions might lose in the future scenarios were mostly projected to scatter in Central African (Figure 6). The high stabilizing range overlap indices under all future scenarios were mainly detected in east coastline of Africa and the regions with latitude from equator to 15 north latitude except South Sudan (Figure 6).
FIGURE 6.

Overlapped expanding, stabilizing and unfilling ranges of 21 Anopheles species under current‐future scenarios. (a) Expanding range overlap index under current‐F126 scenarios; (b) stabilizing range overlap index under current‐F126 scenarios; (c) unfilling range overlap index under current‐F126 scenarios; (d) expanding range overlap index under current‐F585 scenarios; (e) stabilizing range overlap index under current‐F585 scenarios; (f) unfilling range overlap index under current‐F585 scenarios; (g) expanding range overlap index under current‐M126 scenarios; (h) stabilizing range overlap index under current‐M126 scenarios; (i) unfilling range overlap index under current‐M126 scenarios; (j) expanding range overlap index under current‐M585 scenarios; (k) stabilizing range overlap index under current‐M585 scenarios; (l) unfilling range overlap index under current‐M585 scenarios.
4. DISCUSSION
We used two robust and complementary GCMs and established 21 SDMs to project the range dynamics of 21 An. species in Africa mainly through suitability overlap index and range overlap index. Our results indicated range expansions of all 21 An. species under current and future scenarios. Additionally, increases in the suitability overlap indices of 21 An. species were predicted for more than 90% of the African continent. Therefore, Africa might face an increasing malaria risk in the future, and more effective strategies will be needed to combat malaria. Our results are consistent with the findings of Tanser et al. (2003) and Caminade et al. (2014), although they used different methodologies and target species. Diouf et al. (2022) used the Liverpool malaria model (LMM), a mathematical‐biological dynamic malaria model, to simulate the vectors' population dynamics, and predicted that the impacts of future climate changes on malaria in West Africa (the dominant region of the An. species ranges in our study) might decrease in the future. These contradictory results imply that further studies should be conducted on the prediction of future malaria transmissions in Africa. Additionally, through a unified scheme, we investigated the range dynamics of the 21 An. species, and hereby made the comparisons of their range dynamics possible. We also elucidated the range stabilizing, range expanding, and range unfilling of the 21 An. species. Therefore, our study could provide novel and essential information for developing future strategies against their impacts.
Many studies have shown that climate change and anthropogenic habitat disturbance (such as land use modifications) strongly affect the ranges of An. species (e.g., Adeogun et al., 2023; Ageep et al., 2009; Akpan et al., 2018; Shah et al., 2022). However, their relative roles in the range dynamics remain unclear. For example, Ageep et al. (2009) detected stronger influences of land use than climate on the range shifts of An. species. Adeogun et al. (2023) detected the opposite pattern. Sirami et al. (2017) insisted that the factors' relative influences on range dynamics depended on the scale, i.e., climate change had a stronger role at a larger scale, whereas land‐use change might have larger effects at a smaller scale. Our continental‐scale study showed that climate had larger effects than land use on the ranges of 20 An. species in Africa. These results are supported by the findings of Alimi et al. (2015), Akpan et al. (2018), Akpan et al. (2019) and Sirami et al. (2017). Our results also showed that land use had stronger influences than climate on the range of the An. gambiae complex, consistent with the findings of Srivastava et al. (2013). These observations suggested that the relative influences of land use and climate on their range dynamics not only depend on the spatial scale but are species‐specific. For example, Mataba et al. (2023) argued that distribution of An. gambiae complex in Tanzania was positively affected by its proximity to the land use types with high human population density, probably due to its they mainly feed on humans indoor. However, the relatively stronger influences of climate on the potential ranges of An. arabiensis in our study were probably associated with its tendency to feed on animals other than humans (Lindsay et al., 1998), suggesting weak effects of human‐dominated land‐use types on its distribution.
Several studies demonstrated that topographical factors substantially affected the ranges of An. species (e.g., Alimi et al., 2015; Mwakalinga et al., 2018; Wanjala & Kweka, 2016). Others indicated that the relative roles of topographical and climate factors remained unclear (e.g., Adeogun et al., 2023; Alimi et al., 2015). Additionally, some studies found that elevation (the most frequently investigated topographical factor) had a larger influence on range dynamics than climatic factors, although the study areas were smaller than ours. For example, Tanga et al. (2010) found that the distribution of An. species in southwestern Cameroon were largely determined by elevation. A study in Zimbabwe produced similar results (Gwitira et al., 2015). However, our continental‐scale study indicated that topographical variables had smaller influences than climate factors on the ranges of all 21 An. species. These findings imply that the relative influences of climate and topography on the range dynamics of An. species in Africa might depend on the spatial scale. A possible reason is that elevation is a comprehensive proxy of climate conditions (such as temperature and humidity) and has a large influence at a small scale, whereas the same does not hold at a large scale. Another possible explanation is that our coarse spatial resolution (ca. 1 km) of topographical predictors could not identify many smaller larval habitats of An. species. Our study showed that climate change exhibited substantial effects on the range dynamics of most An. species in Africa. Therefore, future climate changes might result in range expansions, potentially increasing the risk of malaria transmission. Several studies had the same conclusion (e.g., Ebi et al., 2005; Haines & Patz, 2004; Le et al., 2019; Paaijmans et al., 2010). Therefore, mitigating future climate change is critical to prevent malaria transmission in Africa. Our study also predicted that future land‐use change, especially an increase in the proportion of cropland, contributed to the range expansion of the An. gambiae complex, one of the essential vectors responsible for malaria transmission, suggesting that land‐use change might increase the risk of malaria transmission. These findings aligned with those of Omukunda et al. (2012) and Kweka et al. (2016). Therefore, the conversion of natural land to cropland in Africa should be minimized due to the potential effect on An. species range expansion and increased malaria risk (Akogbéto et al., 2018; Gillies & Coetzee, 1987; Gillies & De Meillon, 1968; Sinka et al., 2012).
Senegal, Gambia, Ivory Coast, Sierra Leone, Nigeria, Ghana, South Sudan, Ethiopia, Uganda, Democratic Republic of the Congo, Zambia, Malawi, Angola, Zimbabwe, Tanzania, and Mozambique are hotspots for malaria transmission in Africa (World Health Organization, 2023). Our predictions showed that the suitability overlap indices for An. species might increase substantially there in the future. Therefore, more effective strategies are required to prevent or mitigate malaria transmission. Our study suggested substantial range expansions of An. species to occur in scattered regions of Angola, Guinea, Ghana, Nigeria, South Sudan, Kenya, Tanzania, and Mozambique. Although the proliferation of An. species and the malaria epidemic risk are currently low in these scattered regions, we should implement better strategies to prevent or minimize the range expansions to reduce the risk of future malaria transmission in these regions.
Our study predicted substantial variations in the range dynamics of 21 An. species. This finding suggested that different strategies should be used for An. species with different range dynamics. Additionally, under most future scenarios An. funestus, An. coustani, An. nili, and An. rivulorum were projected to have larger potential ranges than others, suggesting that more attention should be paid on them in the future. An. hancocki, An. rivulorum, An. ziemanni, An. coustani, and An. merus were projected to show larger range ratios than others under most future scenarios, implying their substantial range expansions in the future. Therefore, much stricter strategies should be devised for them. An. hancocki, An. rivulorum, and An. ziemanni exhibited lower range similarity than other An. species in all future scenarios, suggesting substantial shifts in their range positions. This finding suggests that the current priority regions for reducing their proliferation might not be the same in the future, and substantial strategy modification may be required.
5. CONCLUSIONS
We used two robust and complementary GCMs to predict the range dynamics of 21 An. species through 21 species distribution models. To our best knowledge, this is the first report in which the range dynamics of as many as 21 An. species were examined. Although the range dynamics differed substantially among the species, the ranges of all species were predicted to increase in the future. Additionally, increases in the habitat suitability of all 21 An. species was predicted for more than 90% of the African continent. Our results suggested that Africa might face increasing threats of malaria transmission in the future. Therefore, more effective strategies will be needed to combat future malaria transmission. Mitigating climate change and anthropogenic disturbances of natural ecosystems due to cropland conversion will be essential to prevent or mitigate the proliferation of An. species and the risk of malaria transmission in Africa.
AUTHOR CONTRIBUTIONS
Peixiao Nie: Formal analysis (lead); investigation (lead); resources (lead); software (lead); validation (lead); visualization (lead); writing – original draft (equal); writing – review and editing (equal). Chunyan He: Formal analysis (supporting); investigation (supporting); resources (supporting); software (supporting); validation (supporting); visualization (supporting); writing – original draft (supporting); writing – review and editing (supporting). Jianmeng Feng: Conceptualization (lead); data curation (lead); funding acquisition (lead); methodology (lead); project administration (lead); supervision (lead); writing – original draft (equal); writing – review and editing (equal).
CONFLICT OF INTEREST STATEMENT
The authors declare that they have no known competing financial interests or personal relationships that could have appeared to influence the work reported in this paper.
Supporting information
Data S1:
Data S2:
Data S3:
Data S4:
Data S5:
Data S6:
Data S7:
Data S8:
Data S9:
ACKNOWLEDGMENTS
We are grateful to Youjun Chen for his valuable suggestions on the statistical analyses. We also appreciate anonymous reviewers' valuable comments. This study has been funded by National Science Foundation of China (Grant ID: 31560178).
Nie, P. , He, C. , & Feng, J. (2024). Range dynamics of Anopheles mosquitoes in Africa suggest a significant increase in the malaria transmission risk. Ecology and Evolution, 14, e70059. 10.1002/ece3.70059
DATA AVAILABILITY STATEMENT
The data and materials underlying this article are available in the article and in its Supporting Information.
REFERENCES
- Adeogun, A. , Babalola, A. S. , Okoko, O. O. , Oyeniyi, T. , Omotayo, A. , & Izekor, R. T. (2023). Spatial distribution and ecological niche modeling of geographical spread of Anopheles gambiae complex in Nigeria using real time data. Scientific Reports, 13, 13679. 10.1038/s41598-023-40929-5 [DOI] [PMC free article] [PubMed] [Google Scholar]
- Ageep, T. B. , Cox, J. , Hassan, M. O. M. , Knols, B. G. , Benedict, M. Q. , & Malcolm, C. A. (2009). Spatial and temporal distribution of the malaria mosquito Anopheles arabiensis in northern Sudan: Influence of environmental factors and implications for vector control. Malaria Journal, 8, 1–14. 10.1186/1475-2875-8-123 [DOI] [PMC free article] [PubMed] [Google Scholar]
- Agyekum, T. P. , Botwe, P. K. , Arko‐Mensah, J. , Issah, I. , Acquah, A. A. , & Hogarh, J. N. (2021). A systematic review of the effects of temperature on Anopheles mosquito development and survival: Implications for malaria control in a future warmer climate. International Journal of Environmental Research and Public Health, 18, 7255. 10.3390/ijerph18147255 [DOI] [PMC free article] [PubMed] [Google Scholar]
- Akogbéto, M. C. , Salako, A. S. , Dagnon, F. , Aïkpon, R. , Kouletio, M. , & Sovi, A. (2018). Blood feeding behaviour comparison and contribution of Anopheles coluzzii and Anopheles gambiae, two sibling species living in sympatry, to malaria transmission in Alibori and Donga region, northern Benin, West Africa. Malaria Journal, 17, 307. 10.1186/s12936-018-2452-9 [DOI] [PMC free article] [PubMed] [Google Scholar]
- Akpan, G. E. , Adepoju, K. A. , & Oladosu, O. R. (2019). Potential distribution of dominant malaria vector species in tropical region under climate change scenarios. PLoS ONE, 14, e0218523. 10.1371/journal.pone.0218523 [DOI] [PMC free article] [PubMed] [Google Scholar]
- Akpan, G. E. , Adepoju, K. A. , Oladosu, O. R. , & Adelabu, S. A. (2018). Dominant malaria vector species in Nigeria: Modelling potential distribution of Anopheles gambiae sensu lato and its siblings with MaxEnt. PLoS ONE, 13, e0204233. 10.1371/journal.pone.0204233 [DOI] [PMC free article] [PubMed] [Google Scholar]
- Alimi, T. O. , Fuller, D. O. , Qualls, W. A. , Herrera, S. V. , Arevalo‐Herrera, M. , & Quinones, M. L. (2015). Predicting potential ranges of primary malaria vectors and malaria in northern South America based on projected changes in climate, land cover and human population. Parasites & Vectors, 8, 1–16. 10.1186/s13071-015-1033-9 [DOI] [PMC free article] [PubMed] [Google Scholar]
- Amadi, J. A. , Ong'amo, G. O. , Olago, D. O. , Oriaso, S. O. , Nyamongo, I. K. , & Estambale, B. B. A. (2018). Map potential Anopheles gambiae sl larval distribution using remotely sensed climatic and environmental variables in Baringo, Kenya. Medical and Veterinary Entomology, 32, 417–426. [DOI] [PubMed] [Google Scholar]
- Barbet‐Massin, M. , Jiguet, F. , Albert, C. H. , & Thuiller, W. (2012). Selecting pseudo‐absences for species distribution models: How, where and how many? Methods in Ecology and Evolution, 3, 327–338. 10.1111/j.2041-210X.2011.00172.x [DOI] [Google Scholar]
- Benelli, G. , & Beier, J. C. (2017). Current vector control challenges in the fight against malaria. Acta Tropica, 174, 91–96. 10.1016/j.actatropica.2017.06.028 [DOI] [PubMed] [Google Scholar]
- Brown, J. L. , Bennett, J. R. , & French, C. M. (2017). SDMtoolbox 2.0: The next generation python‐based GIS toolkit for landscape genetic, biogeographic and species distribution model analyses. PeerJ, 5, e4095. 10.7717/peerj.4095 [DOI] [PMC free article] [PubMed] [Google Scholar]
- Caminade, C. , Kovats, S. , Rocklov, J. , Tompkins, A. M. , Morse, A. P. , & Colón‐González, F. J. (2014). Impact of climate change on global malaria distribution. Proceedings of the National Academy of Sciences of the United States of America, 111, 3286–3291. 10.1073/pnas.1302089111 [DOI] [PMC free article] [PubMed] [Google Scholar]
- Carlson, C. J. , Bannon, E. , Mendenhall, E. , Newfield, T. , & Bansal, S. (2023). Rapid range shifts in African anopheles mosquitoes over the last century. Biology Letters, 19, 20220365. 10.1098/rsbl.2022.0365 [DOI] [PMC free article] [PubMed] [Google Scholar]
- Chen, J. , Yang, S. T. , Li, H. W. , Zhang, B. , & Lv, J. R. (2013). Research on geographical environment unit division based on the method of natural breaks (Jenks). The International Archives of the Photogrammetry, Remote Sensing and Spatial Information Sciences, 40, 47–50. 10.5194/isprsarchives-XL-4-W3-47-2013 [DOI] [Google Scholar]
- Della Rocca, F. , & Milanesi, P. (2022). The new dominator of the world: Modeling the global distribution of the Japanese beetle under land use and climate change scenarios. Land, 11, 567. 10.3390/land11040567 [DOI] [Google Scholar]
- Diouf, I. , Adeola, A. M. , Abiodun, G. J. , Lennard, C. , Shirinde, J. M. , & Yaka, P. (2022). Impact of future climate change on malaria in West Africa. Theoretical and Applied Climatology, 3, 1–13. 10.1007/s00704-021-03807-6 [DOI] [Google Scholar]
- Drake, J. M. , & Beier, J. C. (2014). Ecological niche and potential distribution of Anopheles arabiensis in Africa in 2050. Malaria Journal, 13, 213. 10.1186/1475-2875-13-213 [DOI] [PMC free article] [PubMed] [Google Scholar]
- Dudov, S. V. (2017). Modeling of species distribution with the use of topography and remote sensing data on the example of vascular plants of the Tukuringra ridge Low Mountain belt (Zeya State Nature Reserve, Amur oblast). Biology Bulletin Reviews, 7, 246–257. [Google Scholar]
- Ebi, K. L. , Hartman, J. , Chan, N. , McConnell, J. , Schlesinger, M. , & Weyant, J. (2005). Climate suitability for stable malaria transmission in Zimbabwe under different climate change scenarios. Climate Change, 73, 375–393. 10.1007/s10584-005-6875-2 [DOI] [Google Scholar]
- Fick, S. E. , & Hijmans, R. J. (2017). WorldClim2: New 1 km spatial resolution climate surfaces for global land areas. International Journal of Climatology, 37, 4302–4315. 10.1002/joc.5086 [DOI] [Google Scholar]
- Gillies, M. T. , & Coetzee, M. (1987). A supplement to the Anophelinae of Africa south of the Sahara. Publications of the South African Institute for Medical Research, 55, 1–101. [Google Scholar]
- Gillies, M. T. , & De Meillon, B. (1968). The Anophelinae of Africa south of the Sahara. Publications of the South African Institute for Medical Research, 54, 1–321. [Google Scholar]
- Gwitira, I. , Murwira, A. , Zengeya, F. M. , Masocha, M. , & Mutambu, S. (2015). Modelled habitat suitability of a malaria causing vector (Anopheles arabiensis) relates well with human malaria incidences in Zimbabwe. Applied Geography, 60, 130–138. 10.1016/j.apgeog.2015.03.010 [DOI] [Google Scholar]
- Haines, H. , & Patz, J. A. (2004). Health effects of climate change. JAMA, 291, 99–103. 10.1001/jama.291.1.99 [DOI] [PubMed] [Google Scholar]
- Hay, S. I. , Guerra, C. A. , Tatem, A. J. , Noor, A. M. , & Snow, R. W. (2004). The global distribution and population at risk of malaria: Past, present, and future. The Lancet Infectious Diseases, 4, 327–336. 10.1016/S1473-3099(04)01043-6 [DOI] [PMC free article] [PubMed] [Google Scholar]
- Kweka, E. J. , Kimaro, E. E. , & Munga, S. (2016). Effect of deforestation and land use changes on mosquito productivity and development in Western Kenya highlands: Implication for malaria risk. Frontiers in Public Health, 4, 238. 10.3389/fpubh.2016.00238 [DOI] [PMC free article] [PubMed] [Google Scholar]
- Kyalo, D. , Amratia, P. , Mundia, C. W. , Mbogo, C. M. , Coetzee, M. , & Snow, R. W. (2016). A geocoded inventory of anophelines in the Afrotropical region south of the Sahara: 1898–2016. Wellcome Open Research, 2, 57. 10.12688/wellcomeopenres.12187.1 [DOI] [PMC free article] [PubMed] [Google Scholar]
- Le, P. V. , Kumar, P. , Ruiz, M. O. , Mbogo, C. , & Muturi, E. J. (2019). Predicting the direct and indirect impacts of climate change on malaria in coastal Kenya. PLoS ONE, 14, e0211258. 10.1371/journal.pone.0211258 [DOI] [PMC free article] [PubMed] [Google Scholar]
- Li, C. , Gao, Y. , Zhao, Z. , Ma, D. , Zhou, R. , & Wang, J. (2021). Potential geographical distribution of Anopheles gambiae worldwide under climate change. Journal of Biosafety and Biosecurity, 3, 125–130. [Google Scholar]
- Lindsay, S. W. , Parson, L. , & Thomas, C. J. (1998). Mapping the range and relative abundance of the two principal African malaria vectors, Anopheles gambiae sensu stricto and An. Arabiensis, using climate data. Proceedings of the Royal Society B: Biological Sciences, 265, 847–854. [DOI] [PMC free article] [PubMed] [Google Scholar]
- Liu, C. , Newell, G. , & White, M. (2016). On the selection of thresholds for predicting species occurrence with presence–only data. Ecology and Evolution, 6, 337–348. 10.1002/ece3.1878 [DOI] [PMC free article] [PubMed] [Google Scholar]
- Liu, T. M. , Wang, J. M. , Hu, X. K. , & Feng, J. M. (2020). Land‐use change drives present and future distributions of fall armyworm, Spodoptera frugiperda (JE Smith) (Lepidoptera: Noctuidae). Science of the Total Environment, 706, 1–11. 10.1016/j.scitotenv.2019.135872 [DOI] [PubMed] [Google Scholar]
- Luoto, M. , & Heikkinen, R. K. (2008). Disregarding topographical heterogeneity biases species turnover assessments based on bioclimatic models. Global Change Biology, 14, 483–494. 10.1111/j.1365-2486.2007.01527.x [DOI] [Google Scholar]
- Mataba, G. R. , Munishi, L. , Brendonck, L. , & Vanschoenwinkel, B. (2023). Influence of land use on the abundance and spatial distribution of mosquito larvae of the Anopheles gambiae complex in a malaria expansion area in northern Tanzania. Hydrobiologia, 15, 1–18. 10.1007/s10750-023-05414-0 [DOI] [Google Scholar]
- Mboera, L. E. , Bwana, V. M. , Rumisha, S. F. , Tungu, P. K. , & Malima, R. C. (2015). Spatial abundance and human biting rate of Anopheles arabiensis and Anopheles funestus in savannah and rice agro‐ecosystems of Central Tanzania. Geospatial Health, 10, 26–31. 10.4081/gh.2015.322 [DOI] [PubMed] [Google Scholar]
- Mmbando, A. S. , Kaindoa, E. W. , Ngowo, H. S. , Swai, J. K. , Matowo, N. S. , Kilalangongono, M. , Lingamba, G. P. , Mgando, J. P. , Namango, I. H. , Okumu, F. O. , & Nelli, L. (2021). Fine‐scale distribution of malaria mosquitoes biting or resting outside human dwellings in three low‐altitude Tanzanian villages. PLoS ONE, 16, e0245750. 10.1371/journal.pone.0245750 [DOI] [PMC free article] [PubMed] [Google Scholar]
- Mwakalinga, V. M. , Sartorius, B. K. D. , Limwagu, A. J. , Mlacha, Y. P. , Msellemu, D. F. , & Chaki, P. P. (2018). Topographic mapping of the interfaces between human and aquatic mosquito habitats to enable barrier targeting of interventions against malaria vectors. Royal Society Open Science, 5, 161055. 10.1098/rsos.161055 [DOI] [PMC free article] [PubMed] [Google Scholar]
- Nájera, J. A. , González‐Silva, M. , & Alonso, P. L. (2011). Some lessons for the future from the global malaria eradication programme (1955–1969). PLoS Medicine, 8, e1000412. [DOI] [PMC free article] [PubMed] [Google Scholar]
- Nie, P. X. , & Feng, J. M. (2023). Niche and range shifts of Aedes aegypti and Ae. albopictus suggest that the latecomer shows a greater invasiveness. Insects, 14, 810. 10.3390/insects14100810 [DOI] [PMC free article] [PubMed] [Google Scholar]
- Okumu, F. , Gyapong, M. , Casamitjana, N. , Castro, M. C. , Itoe, M. A. , Okonofua, F. , & Tanner, M. (2022). What Africa can do to accelerate and sustain progress against malaria. PLOS Global Public Health, 2, e0000262. 10.1371/journal.pgph.0000262 [DOI] [PMC free article] [PubMed] [Google Scholar]
- Olabimi, I. O. , Ileke, K. D. , Adu, B. W. , & Arotolu, T. E. (2021). Potential distribution of the primary malaria vector Anopheles gambiae Giles [Diptera: Culicidae] in Southwest Nigeria under current and future climatic conditions. Journal of Basic and Applied Zoology, 82, 1–11. 10.1186/s41936-021-00261-8 [DOI] [Google Scholar]
- Oliver, S. V. , & Brooke, B. D. (2017). The effect of elevated temperatures on the life history and insecticide resistance phenotype of the major malaria vector Anopheles arabiensis (Diptera: Culicidae). Malaria Journal, 16, 1–13. 10.1186/s12936-017-1720-4 [DOI] [PMC free article] [PubMed] [Google Scholar]
- Omukunda, E. , Githeko, A. , Ndong'a, M. F. , Mushinzimana, E. , & Yan, G. (2012). Effect of swamp cultivation on distribution of Anopheline larval habitats in Western Kenya. Journal of Vector Borne Diseases, 49, 61–71. [PMC free article] [PubMed] [Google Scholar]
- Paaijmans, K. P. , Blanford, S. , Bell, A. S. , Blanford, J. I. , Read, A. F. , & Thomas, M. B. (2010). Influence of climate on malaria transmission depends on daily temperature variation. Proceedings of the National Academy of Sciences of the United States of America, 107, 15135–15139. 10.1073/pnas.1006422107 [DOI] [PMC free article] [PubMed] [Google Scholar]
- Peterson, A. T. (2009). Shifting suitability for malaria vectors across Africa with warming climates. BMC Infectious Diseases, 9, 1–6. 10.1186/1471-2334-9-59 [DOI] [PMC free article] [PubMed] [Google Scholar]
- Ryan, S. J. , Lippi, C. A. , Villena, O. C. , Singh, A. , Murdock, C. C. , & Johnson, L. R. (2023). Map current and future thermal limits to suitability for malaria transmission by the invasive mosquito Anopheles stephensi . Malaria Journal, 22, 104. 10.1186/s12936-023-04531-4 [DOI] [PMC free article] [PubMed] [Google Scholar]
- Semakula, H. M. , Song, G. , Achuu, S. P. , Shen, M. , Chen, J. , Mukwaya, P. I. , Oulu, M. , Mwendwa, P. M. , Abalo, J. , & Zhang, S. (2017). Prediction of future malaria hotspots under climate change in sub‐Saharan Africa. Climatic Change, 143, 415–428. 10.1007/s10584-017-1996-y [DOI] [Google Scholar]
- Shah, H. A. , Carrasco, L. R. , Hamlet, A. , & Murray, K. A. (2022). Exploring agricultural land‐use and childhood malaria associations in sub‐Saharan Africa. Scientific Reports, 12, 4124. 10.1038/s41598-022-07837-6 [DOI] [PMC free article] [PubMed] [Google Scholar]
- Sherrard‐Smith, E. , Winskill, P. , Hamlet, A. , Ngufor, C. , N'Guessan, R. , Guelbeogo, M. W. , Sanou, A. , Nash, R. K. , Hill, A. , Russell, E. L. , Woodbridge, M. , Tungu, P. K. , Kont, M. D. , Mclean, T. , Fornadel, C. , Richardson, J. H. , Donnelly, M. J. , Staedke, S. G. , Gonahasa, S. , … Churcher, T. S. (2022). Optimising the deployment of vector control tools against malaria: A data‐informed modelling study. Lancet Planetary Health, 6, e100–e109. 10.1016/S2542-5196(22)00040-7 [DOI] [PubMed] [Google Scholar]
- Sinka, M. E. , Bangs, M. J. , Manguin, S. , Rubio‐Palis, Y. , Chareonviriyaphap, T. , Coetzee, M. , Mbogo, C. M. , Hemingway, J. , Patil, A. P. , Temperley, W. H. , Gething, P. W. , Kabaria, C. W. , Burkot, T. R. , Harbach, R. E. , & Hay, S. I. (2012). A global map of dominant malaria vectors. Parasites and Vectors, 5, 69. 10.1186/1756-3305-5-69 [DOI] [PMC free article] [PubMed] [Google Scholar]
- Sirami, C. , Caplat, P. , Popy, S. , Clamens, A. , Arlettaz, R. , & Jiguet, F. (2017). Impacts of global change on species distributions: Obstacles and solutions to integrate climate and land use. Global Ecology and Biogeography, 26, 385–394. 10.1111/geb.12555 [DOI] [Google Scholar]
- Sougoufara, S. , Ottih, E. C. , & Tripet, F. (2020). The need for new vector control approaches targeting outdoor biting Anopheline malaria vector communities. Parasites and Vectors, 13, 1–15. 10.1186/s13071-020-04170-7 [DOI] [PMC free article] [PubMed] [Google Scholar]
- Srivastava, A. K. , Kharbuli, B. , Shira, D. S. , & Sood, A. (2013). Effect of land use and land cover modification on distribution of Anopheline larval habitats in Meghalaya, India. Journal of Vector Borne Diseases, 50, 121. [PubMed] [Google Scholar]
- Tang, C. Q. , Matsui, T. , Ohashi, H. , Dong, Y. F. , Momohara, A. , & Herrando‐Moraira, S. (2018). Identifying long‐term stable refugia for relict plant species in East Asia. Nature Communications, 9, 4488. 10.1038/s41467-018-06837-3 [DOI] [PMC free article] [PubMed] [Google Scholar]
- Tanga, M. C. , Ngundu, W. I. , Judith, N. , Mbuh, J. , Tendongfor, N. , & Simard, F. (2010). Climate change and altitudinal structuring of malaria vectors in south‐western Cameroon: Their relation to malaria transmission. Transactions of the Royal Society of Tropical Medicine and Hygiene, 104, 453–460. 10.1016/j.trstmh.2010.02.006 [DOI] [PubMed] [Google Scholar]
- Tanser, F. C. , Sharp, B. , & Le Sueur, D. (2003). Potential effect of climate change on malaria transmission in Africa. The Lancet, 362, 1792–1798. 10.1016/S0140-6736(03)14898-2 [DOI] [PubMed] [Google Scholar]
- Tawe, L. , Ramatlho, P. , Waniwa, K. , Muthoga, C. W. , Makate, N. , Ntebela, D. S. , Quaye, I. K. , Pombi, M. , & Paganotti, G. M. (2017). Preliminary survey on anopheles species distribution in Botswana shows the presence of Anopheles gambiae and Anopheles funestus complexes. Malaria Journal, 16, 1–7. 10.1186/s12936-017-1756-5 [DOI] [PMC free article] [PubMed] [Google Scholar]
- Thuiller, W. , Lafourcade, B. , Engler, R. , & Araujo, M. B. (2009). BIOMOD – A platform for ensemble forecasting of species distributions. Ecography, 32, 369–373. 10.1111/j.1600-0587.2008.05742.x [DOI] [Google Scholar]
- Virkkala, R. , Marmion, M. , Heikkinen, R. K. , Thuiller, W. , & Luoto, M. (2010). Predicting range shifts of northern bird species: Influence of modelling technique and topography. Acta Oecologica, 36, 269–281. 10.1016/j.actao.2010.01.006 [DOI] [Google Scholar]
- Wanjala, C. L. , & Kweka, E. J. (2016). Impact of Highland topography changes on exposure to malaria vectors and immunity in Western Kenya. Frontiers in Public Health, 4, 227. 10.3389/fpubh.2016.00227 [DOI] [PMC free article] [PubMed] [Google Scholar]
- World Health Organization . (2023). World malaria report. World Health Organization. [Google Scholar]
- Yang, R. J. , Gong, X. , Hu, X. K. , Hu, Y. W. , & Feng, J. M. (2021). Global cultivation of wheat crops induces considerable shifts in the range and niche of species relative to their wild progenitors. Environmental Research Communications, 3, 115012. 10.1088/2515-7620/ac3906 [DOI] [Google Scholar]
- Zengenene, M. P. , Munhenga, G. , Chidumwa, G. , & Koekemoer, L. L. (2021). Characterization of life‐history parameters of an Anopheles funestus (Diptera: Culicidae) laboratory strain. Journal of Vector Ecology, 46, 24–29. [DOI] [PubMed] [Google Scholar]
- Zhang, M. Z. , Xu, Z. F. , Han, Y. , & Guo, W. D. (2022). Evaluation of CMIP6 models toward dynamical downscaling over 14 CORDEX domains. Climate Dynamics, 62, 1–14. 10.1007/s00382-022-06355-5 [DOI] [Google Scholar]
Associated Data
This section collects any data citations, data availability statements, or supplementary materials included in this article.
Supplementary Materials
Data S1:
Data S2:
Data S3:
Data S4:
Data S5:
Data S6:
Data S7:
Data S8:
Data S9:
Data Availability Statement
The data and materials underlying this article are available in the article and in its Supporting Information.