Abstract
The border zone (BZ) of the infarcted heart is a geographically complex and biologically enigmatic interface separating poorly perfused infarct zones (IZs) from remote zones (RZs). The cellular and molecular mechanisms of myocardial BZs are not well understood because microdissection inevitably combines them with uncontrolled amounts of RZs and IZs. Here, we use single-cell/nucleus RNA sequencing, spatial transcriptomics and multiplexed RNA fluorescence in situ hybridization to redefine the BZ based on cardiomyocyte transcriptomes. BZ1 (Nppa+Xirp2−) forms a hundreds-of-micrometer-thick layer of morphologically intact cells adjacent to RZs that are detectable within an hour of injury. Meanwhile, BZ2 (Nppa+Xirp2+) forms a near-single-cell-thick layer of morphologically distorted cardiomyocytes at the IZ edge that colocalize with matricellular protein-expressing myofibroblasts and express predominantly mechanotransduction genes. Surprisingly, mechanical injury alone is sufficient to induce BZ genes. We propose a ‘loss of neighbor’ hypothesis to explain how ischemic cell death mechanically destabilizes the BZ to induce its transcriptional response.
The ischemic border zone (BZ) is a geographically complex and biologically enigmatic area of the infarcted heart that separates regions of cell death (the infarct zone (IZ)) from comparatively normal myocardium (the remote zone (RZ))1–3. It has been implicated in processes such as infarct expansion, ventricular remodeling and arrhythmia origination, as well as cardiomyocyte (CM) proliferation and regeneration2,4–11. Zones are often recognized histologically based on the appearance of CMs. For example, at early time points after myocardial infarction (MI), dying CMs in the IZ exhibit characteristic wavy morphologies with intracellular contraction bands that progress to necrosis12. Meanwhile, surviving BZ CMs retain relatively normal cellular morphology but are functionally distinguishable from RZ CMs based on hypocontractility despite preserved perfusion13. Over time, the BZ evolves, expands and remodels, leading to macroscopic ventricular dilation, wall thinning and even rupture8,14,15. Clinically, such adverse remodeling leads to progressive symptomatic heart failure. Despite the growing armamentarium of pharmacological therapies aimed at limiting ischemic cell death and remodeling, ischemic heart disease is the most common cause of death in the world16,17.
The determinants of the BZ are largely unknown because the territory is challenging to isolate and study at a cellular and molecular level. Historically, the BZ was anatomically defined but it could not be easily microdissected without including uncontrolled proportions of IZs and RZs. The inability to isolate BZ tissue with microscopic precision has prevented unbiased molecular and genomic characterization. However, recent developments in single-cell and spatial transcriptomic technologies are resolving biological processes in complex tissues with unprecedented detail and without the need for mechanical microdissection3,18–31. In this study, we leverage single-cell and single-nucleus transcriptomics (single-cell RNA sequencing (scRNA-seq), single-nucleus RNA sequencing (snRNA-seq)), grid-based spatial transcriptomics and single-cell resolution multiplex RNA fluorescence in situ hybridization (FISH) to show that the BZ can be functionally defined using single-cell or spatial gene expression patterns (Fig. 1a). Our data show that BZ CMs can be categorized into two major subgroups (BZ1 and BZ2) with distinct spatial and functional characteristics, each containing additional substructure and microenvironmental contexts. BZ1 forms a hundreds-of-micrometer-thick transitional layer adjacent to the RZ, while BZ2 is a tens-of-micrometer-thin layer that decorates the complex boundaries of the IZ. Using multimodality analysis of histological and transcriptomic data after ischemic and nonischemic injuries, we define the spatiotemporal evolution of BZ CM subsets, highlight their prominent mechanotransduction programs and advance a ‘loss of neighbor’ (LON) hypothesis to explain our observations.
Fig. 1 |. CM transcripts redefine the ischemic BZ.
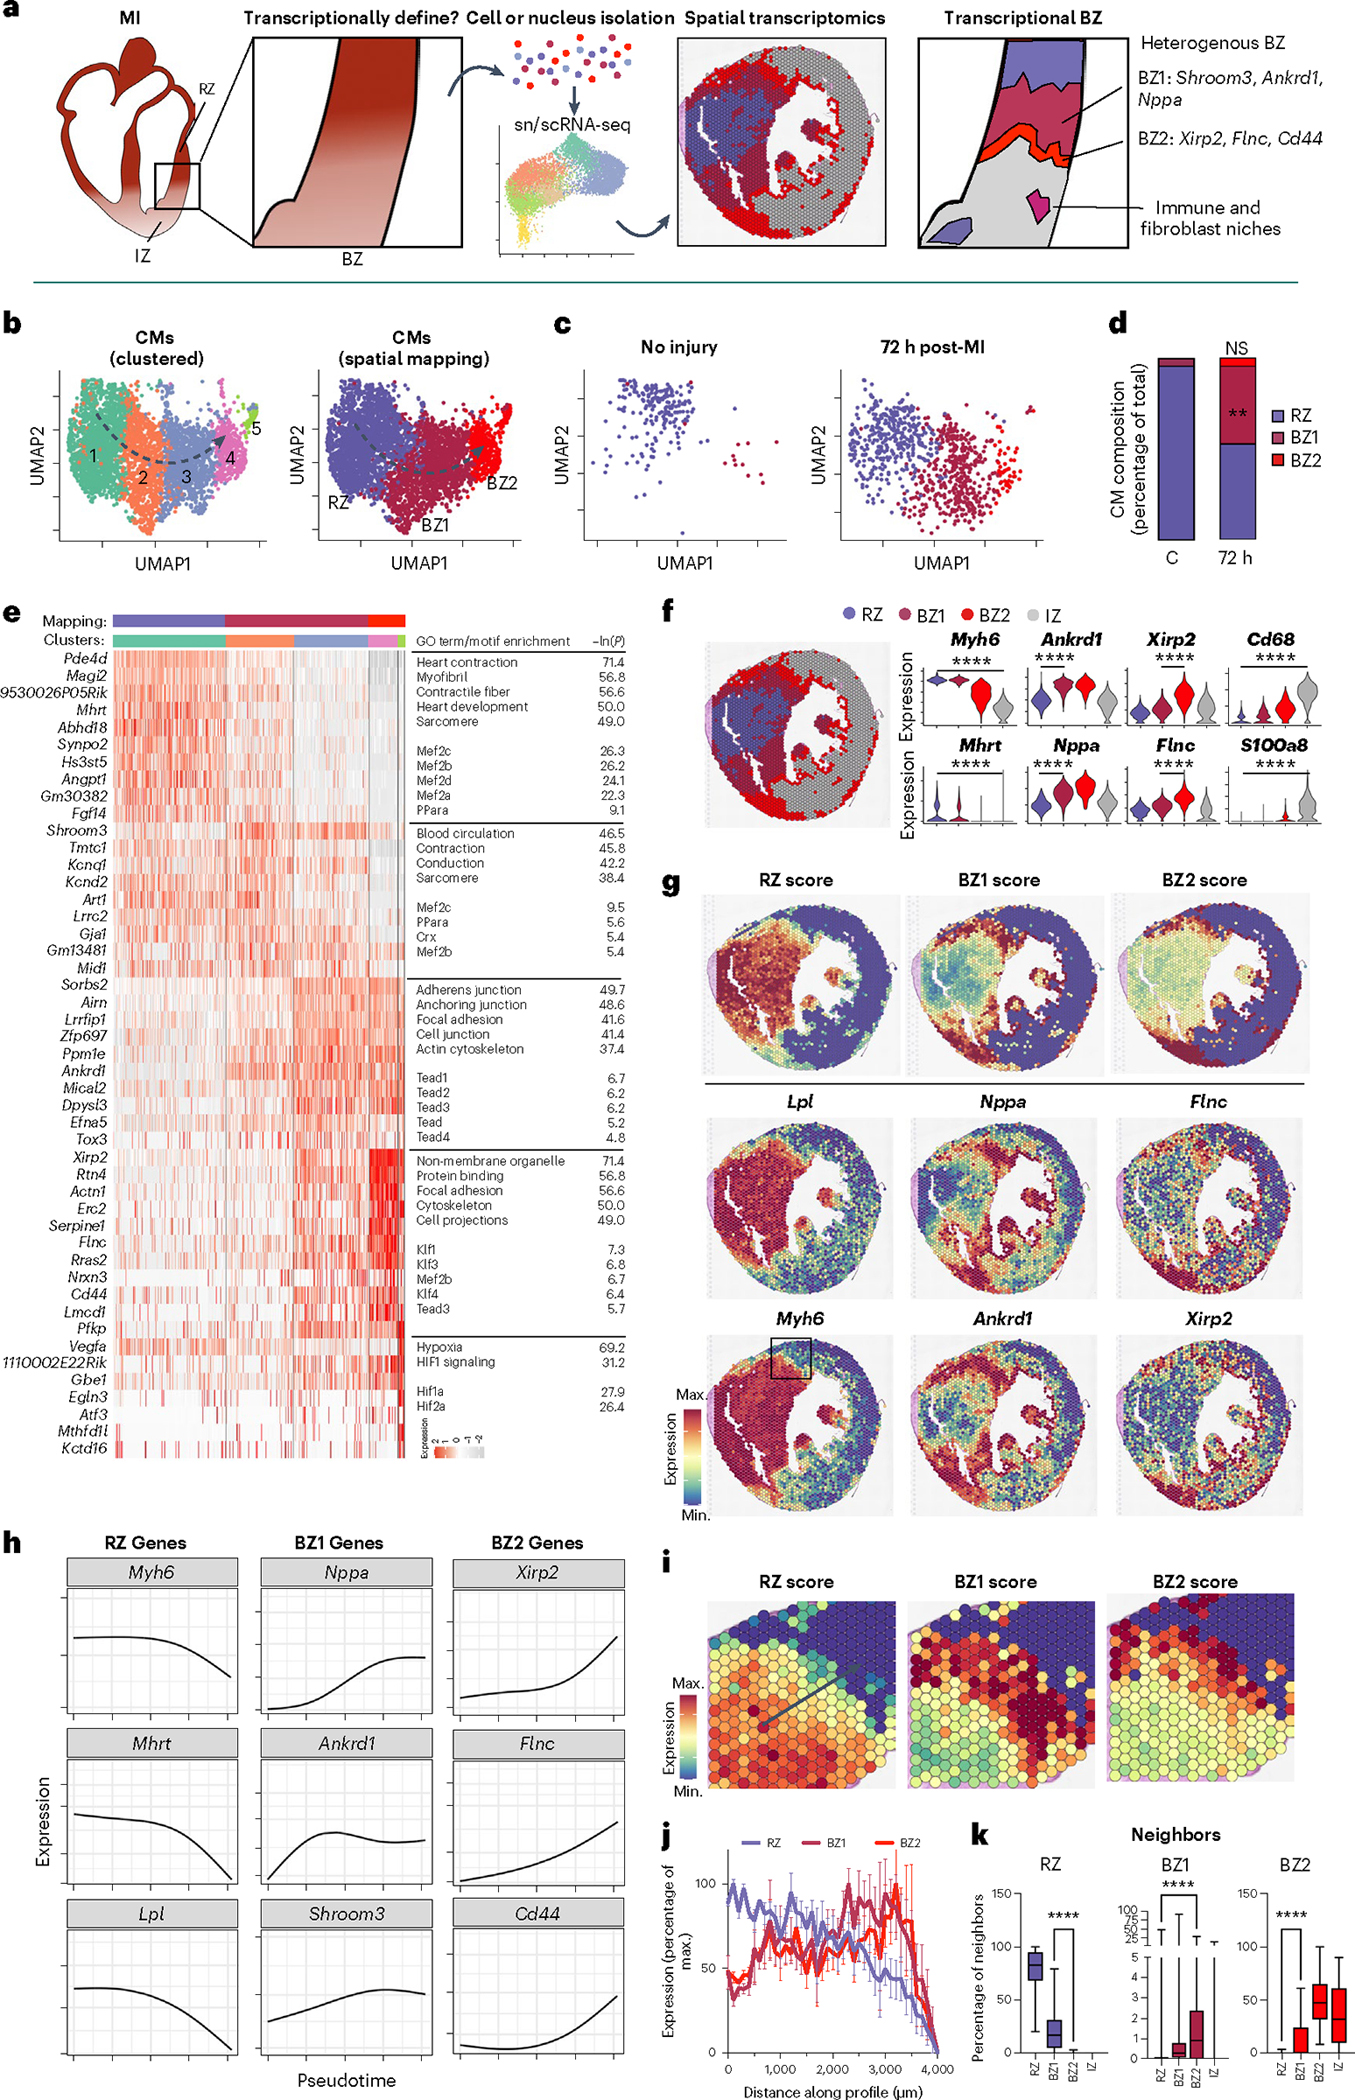
a, Scientific question and experimental design. To define the ischemic BZ transcriptionally, we performed snRNA-seq of mouse hearts without injury and with ischemic injury, mapped the resulting transcriptomes to space using spatial transcriptomics and validated our findings using multiplex RNA FISH (Rebus Biosystems). b, Uniform manifold approximation and projection (UMAP) plots of clustered CMs (snRNA-seq) with high-resolution (left) and annotated clustering (right) based on spatial mapping and gene patterns. Representative data shown from Ctrl, 24 h post-MI and 72 h post-MI samples (n = 3 mice). c, UMAP plots of CMs split by condition. d, Quantification of CM composition by time after injury. e, Heatmap displaying DEGs as determined by clustering with the color bars above indicating cell cluster based on the annotation method (Wilcoxon signed-rank test, Bonferroni-adjusted P < 0.01). GO and motif enrichment terms are displayed to the right of each respective group. f, Representative spatial transcriptomic data of mouse heart cross-section after ischemic injury (Visium; 10X Genomics). g, Gene-set scores in space derived from snRNA-seq data with examples of expressed genes shown below. h, Trajectory analysis of representative genes from snRNA-seq data with direction of pseudotime indicated in b. i, Gene-set scores in space at the BZ from the box indicated in g. j, Gene-set scores as a function of space from the RZ toward the IZ as indicated by the arrow in i (data presented as mean values ± s.e.m.; n = 966 cells examined over one sample). k, Quantification of neighboring pixels, split by mapping classification (mean; box: 25th–75th percentile; whiskers: 2.5th–97.5th percentile; n = 966 cells examined over 1 sample). **P < 0.01, ****P < 0.0001; two-sided Mann–Whitney U-test. NS, not significant; min., minimum; max., maximum.
Results
Single-cell transcriptomic classification of CMs after ischemic injury
To test whether the BZ of the infarcted heart can be functionally defined by ‘transcriptional microdissection’, we subjected adult mice to left anterior descending (LAD) coronary artery ligation and collected hearts at various time points along with sham controls (Ctrls), then isolated single cells and nuclei at baseline (no injury; n = 3, 31,580 sc/sn), 1 h (n = 3, 17,442 sc/sn), 4 h (n = 1, 8,523 sc/sn), 24 h (n = 6, 33,336 sc/sn), 72 h (n = 3, 10,380 sc/sn) and 168 h (n = 3, 20,926 sc/sn) for sc/snRNA-seq (Extended Data Fig. 1a,b). We collected myocardial tissue extending from the non-infarcted RZ to the frankly infarcted IZ to ensure comprehensive capture of BZ biology. The resulting count matrices were integrated with our previously published scRNA-seq datasets collected at similar time points after MI to create a unified sc/snRNA-seq object with clusters representing CMs, fibroblasts, endothelial cells (ECs), smooth muscle cells (SMCs), neutrophils, dendritic cells (DCs), monocytes and macrophages (Extended Data Fig. 1e,f). Most cell types were represented in both whole-cell and nucleus data; however, CMs, which are large and difficult to isolate as intact cells, were exclusively represented as nuclei, whereas neutrophils, which have fragile polymorphic nuclei, were primarily represented in whole-cell samples (Extended Data Fig. 1g–l). From these data, we generated subset-specific gene signatures or gene-set scores (Extended Data Fig. 1e).
In parallel, we performed spatial transcriptomics (Visium, 10X Genomics) on short-axis sections of hearts from mice subjected to: (1) sham surgery; (2) experimental MIs collected at 1, 4, 72 and 168 h post-MI; or (3) mechanical, nonischemic injury due to isoproterenol (ISO) treatment, transaortic constriction (TAC) and needle pass (NP) injury. In total, we analyzed the transcriptomes of 128,192 single nuclei and cells across 23 samples and 31,359 locations across 16 spatial transcriptomic samples (Extended Data Fig. 1b). To quantify the spatial distribution of cell subsets, we integrated spatial transcriptomic data and performed clustering analysis to first understand the native structure of the transcriptomes across space before mapping sn/scRNA-seq-derived CM labels and projecting subset-specific gene-set scores onto space to infer cellular composition, spatial patterning and colocalization, followed by validation using probe-based multiplex FISH (see mapping strategy in the Methods; Extended Data Figs. 1a and 2).
We began by analyzing CM transcripts since they are the cell type sufficient for pathologists to morphologically recognize the BZ in histological sections. Within the integrated dataset, CM transcriptomes formed a distinct cluster characterized by elevated expression of cardiac-specific genes such as Tnnt2 (encoding for the protein troponin T) and Ckm (encoding for the protein creatine kinase M) (Extended Data Fig. 1e and Supplementary Table 1). Subclustering of CMs revealed a continuum of five distinct yet overlapping transcriptional states (CM1–CM5) suggestive of a regulated multistep progression (Fig. 1b, left and Extended Data Fig. 3a,b). Gene ontology (GO) and motif enrichment analyses were performed to infer functional and putative regulatory programs32. Based on cluster composition changes after injury, gene dynamics and spatial distribution, clusters were collapsed into three major functional groups as described below (Fig. 1b, right: RZ, purple; BZ1, maroon; BZ2, red).
To identify RZ CMs, CM subsets from infarcted hearts that coclustered with CMs from non-infarcted hearts were assessed. Within the integrated data, almost all CMs from non-infarcted hearts coclustered with CM1 from infarcted hearts. These cells were characterized by elevated levels of myosin heavy chain 6 (Myh6) and other markers of adult CM homeostasis (Fig. 1c–e and Supplementary Table 2). In contrast, cells from clusters CM2/3 and CM4/5 were minimally present in Ctrl samples (4.6% and not significant; mean ± s.e.m.) yet represented 42.6 ± 6.9% and 4.6 ± 2.6% of CMs 72 h post-MI, respectively, suggesting that they were unique to the post-infarct heart and candidate BZ CMs (Fig. 1d and Supplementary Table 2).
CM4 and CM5 were defined by elevated expression of xin actin-binding repeat containing 2 (Xirp2; also known as Cmya3, mXinβ and myomaxin), filamin C (Flnc) and desmin (Des)33–36. Xirp2 is an actin- and α-actinin-binding protein that localizes to Z-disc regions and intercalated discs to maintain structural integrity and conduction37,38. Similarly, filamin C is an actin-binding protein critical to costamere structure; mutations in Flnc are associated with hypertrophic and inherited dilated cardiomyopathies and sudden cardiac death39–43. To understand the functional significance of this cluster, GO enrichment analysis was performed and revealed an impact on mechanical instability. We found enrichment for genes related to cytoskeletal binding, cell projections and focal adhesions as well as enrichment for Ras and Rho GTPase signaling (Extended Data Fig. 2c), which regulate cytoskeletal dynamics and cellular replication, respectively. CM5s, which formed a distinct island in uniform manifold approximation and projection (UMAP) space, are a specialized subset of CM4 defined by elevated levels of hypoxia-inducible factor (HIF)-regulated genes (for example, Vegfa, Egln3) (Fig. 1e). This cluster likely represented actively ischemic CMs. The absence of HIF-dependent gene expression in other subsets suggested that these regions may not remain hypoxic but may instead be well perfused.
A notable characteristic of CM4/5s was the downregulation of CM1 genes including Mhrt, a long noncoding RNA that is downregulated in heart failure and Myh6, the predominant myosin heavy chain isoform of adult CMs44. Motif enrichment analysis showed that CM1s were enriched for Mef2 binding sites while clusters 4/5 were enriched for binding sites associated with several Krüppel-like factors, in agreement with a recent report demonstrating transition from Mef2 binding in CMs after injury (Fig. 1e)3,45.
Between CM1 and CM4/5 were the transitional CM clusters CM2 and CM3. CM2/3 expressed ankyrin repeat domain 1 (Ankrd1, also known as Carp), shroom family member 3 (Shroom3) and natriuretic peptide A (Nppa; also known as ANP, PND and atrial natriuretic factor prohormone). Nppa and Ankrd1 were recently identified in infarct BZs using single-gene in situ hybridization3. Ankrd1 is often considered a YAP-regulated gene involved in mechanotransduction and proliferation during development and cancer46. Interestingly, both CM2/3 and CM4/5 were enriched for TEAD binding sites, which is the DNA binding partner involved in mediating YAP/TAZ signaling (Fig. 1e). These CMs also expressed Shroom3, which is regulated by Pitx2, a necessary component for neonatal regeneration in Hippo-deficient mice47. Further, they expressed genes that encode proteins involved in cardiac conduction including Cx43 (Gja1), Scn5a and Ryr2 that are collectively regulated by Tbx5 and Pitx2 (ref. 48). Additionally, they also expressed Nppa and Nppb, which encode the natriuretic peptides, stretch-activated clinical biomarkers of heart failure, suggesting that this CM population is under mechanical stress49.
CM transcriptomes define spatially distinct BZ1 and BZ2
Since CM1s represented transcriptionally normal RZ myocytes and because IZ myocytes are necrotic and lack stable transcripts, we hypothesized that CM2/3 and CM4/5 may represent transcriptionally distinct areas of the BZ. To test this, we first performed clustering analysis on spatial data and mapped snRNA-seq-derived CM signatures (Fig. 1f, Extended Data Fig. 4 and Supplementary Table 3). We found that differentially expressed genes (DEGs) discriminating CM2/3 and CM4/5 appeared in distinct contiguous locations in space, which we named BZ1 and BZ2, respectively (Fig. 1g). To quantify these groups, we constructed gene-set scores by summing the top DEGs derived from the snRNA-seq data (Supplementary Table 2; see Methods and Extended Data Fig. 4k for dependence of discriminators on the number of genes in the score). We then mapped labels derived from CM nuclei (RZ, BZ1, BZ2 or IZ) to spatial clusters using CM nucleus-derived gene-set scores. This was done by first evaluating whether each spatial cluster was CM-rich (high CM gene-set score) and thus labeled either RZ or BZ, or whether it was CM-poor (low CM gene-set score) and thus labeled IZ due to presumed ischemic cell death. CM-rich clusters were then classified as unique to post-MI samples (labeled BZ) or present in injured and non-injured samples (RZ). Finally, spatially clustered labeled BZs were further stratified based on low (BZ1) or high (BZ2) expression of the BZ2 marker genes (Extended Data Fig. 4 and Methods).
As predicted by the snRNA-seq data, RZ scores were most elevated near the septum in regions distal to the infarct and slowly decreased in magnitude in regions that approached the infarct area; BZ1 CMs formed contiguous regions hundreds of micrometers in thickness, which associated with RZ and BZ2 CMs; BZ2 CMs formed relatively smaller contiguous regions that directly neighbored the IZ and BZ1 CMs (Fig. 1g). This patterning was consistently observed across replicates (Extended Data Fig. 2). We performed trajectory analysis (Monocle) on snRNA-seq data and found that line profiles in space spanning from healthy to frankly infarcted regions had gene patterns that mirrored these results (Fig. 1h–j). RZ genes (Myh6, Mhrt, Lpl) slowly decreased in magnitude as BZ1 genes (Nppa, Ankrd1, Shroom3) and BZ2 genes (Xirp2, Flnc, Cd44) were sequentially activated. Further, quantification of neighboring pixels confirmed that CM subsets most commonly neighbor CMs as predicted by snRNA-seq-derived trajectory analysis (Fig. 1k).
To test the relevance of this model to humans, we performed spatial transcriptomics on an ischemic human heart sample. The patient was a 45-year-old male who presented with an acute anterior ST elevation MI (STEMI) and underwent percutaneous coronary intervention to the infarct-related LAD artery; however, despite successful revascularization he remained in refractory cardiogenic shock dependent on inotrope infusion. He underwent implantation of a left ventricular (LV) assist device 7 weeks after his initial STEMI, during which a core biopsy of the ventricular myocardium was collected from the LV apex and processed for Visium spatial transcriptomics. We observed a similar distribution of BZ1- and BZ2-associated genes in humans compared to mice. However, because the sample was collected from a large ischemic zone, we found no clear evidence of RZ CMs in the region sampled (Extended Data Fig. 5). Taken together, these data show that after ischemic injury, CM transcriptomes form a continuous trajectory corresponding to spatial position within the internal BZ, thus validating the ‘transcriptional microdissection’ method.
The BZ at single-cell resolution
Capture- and NGS-based spatial transcriptomics enable unbiased transcriptional profiling but currently lack single-cell resolution since RNA capture sites are 55 μm in diameter with 100-μm spacing. To achieve single-cell spatial resolution, we performed multiplex FISH using image cycling of barcoded probes for selected BZ transcripts (Rebus Biosystems) on adjacent tissue sections. Consistent with the experiments above, CM1 probes (Tnnt2, Myh6) localized to RZ, CM2/3 probes (Ankrd1, Nppa) to BZ1 and CM4/5 probes (Xirp2, Flnc) to BZ2 (Fig. 2a,b). Interestingly, BZ2 was only several cell lengths deep, as if the transcriptional signature was unique to cells at the edge of the IZ. Xirp2- and/or Flnc-expressing cells decorated the complicated boundaries separating the myocyte-free IZ from the much larger BZ1 (several hundred micrometers). Morphological inspection of hematoxylin & eosin (H&E) and phalloidin-stained sections showed BZ2 myocytes to be elongated and distorted cells that appeared to drip off the BZ ‘shore’ (Fig. 2c,d). In addition to the surviving myocardial ‘shore’, we observed many isolated ‘islands’ of surviving myocytes within the IZ, which also appeared as a core of contiguous BZ1 myocytes decorated by a boundary of Xirp2- and Flnc-expressing BZ2 myocytes (Fig. 2a–d). To quantitatively confirm the spatial arrangement of RZ, BZ1 and BZ2 myocytes, we restained the multiplex FISH-probed sections with wheat germ agglutinin (WGA) to label cell membranes and performed cell segmentation and classification based on the expression of Nppa, Clu (BZ1), Xirp2, Flnc (BZ2) and Tnnt2 (RZ) (Fig. 2e and Extended Data Fig. 6a–c). Quantification of neighboring cell types confirmed that: CM subsets most commonly contacted CMs from the same subset followed by the adjacent CMs predicted by trajectory analysis (Extended Data Fig. 6d); the distance to the IZ was smallest for BZ2 CMs and largest for RZ CMs (Fig. 2f and Extended Data Fig. 6e); BZ2 CMs had significantly fewer myocyte neighbors than BZ1 or RZ CMs (Fig. 2g and Extended Data Fig. 6f); and BZ2 had a substantially smaller average contiguous thickness of 109.9 ± 50.0 μm compared to 348.1 ± 180.7 μm BZ1 (mean ± s.d.) (Fig. 2h and Extended Data Fig. 6g). Taken together, these data suggest that the transcriptional progression from BZ1 to BZ2 occurs primarily at a single-cell border with the IZ.
Fig. 2 |. BZ2 CMs form a thin boundary between surviving and ischemic myocardium.
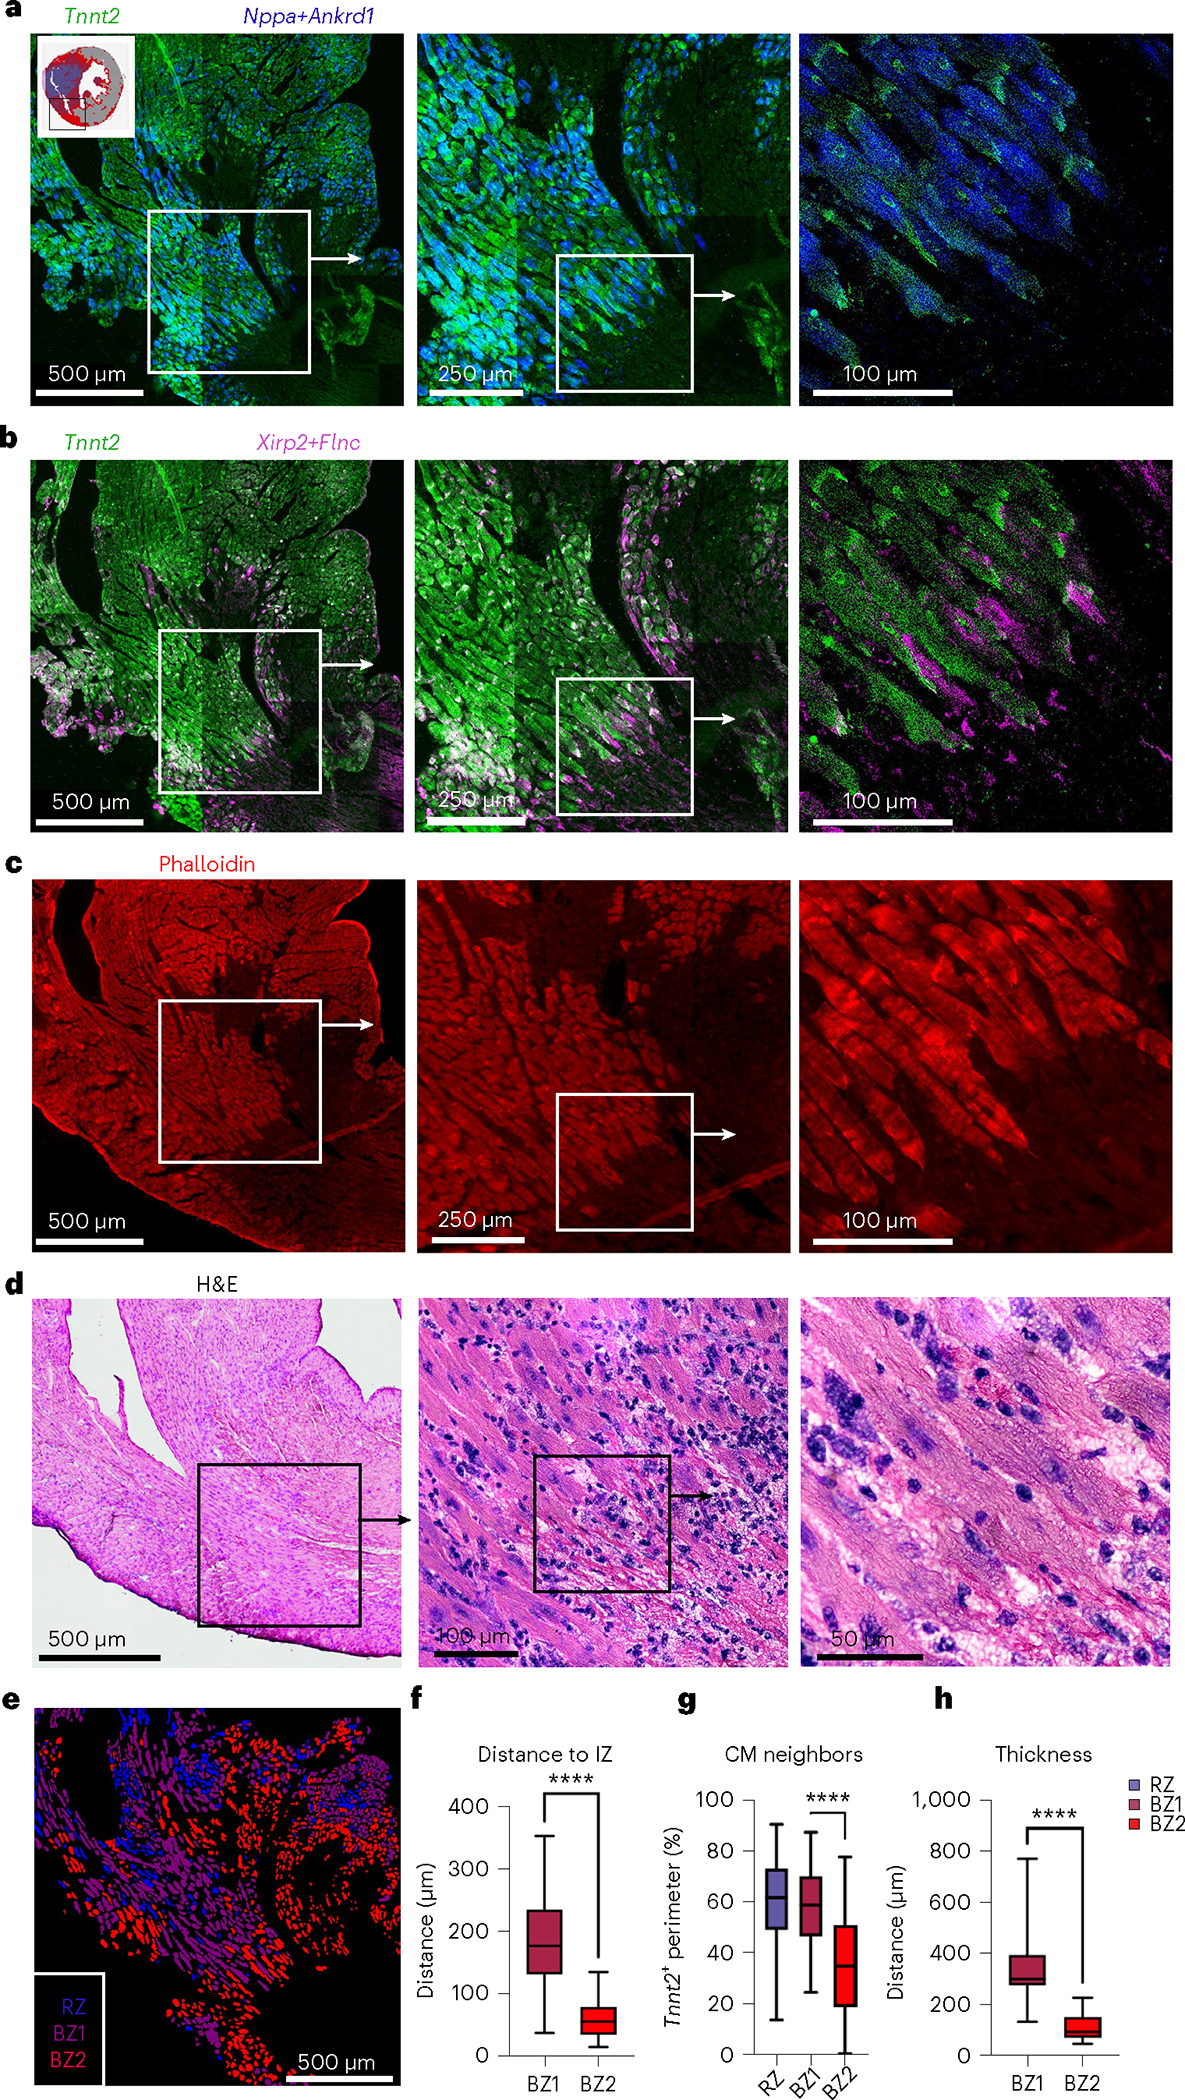
a,b, Multiplex FISH images of serial section from Fig. 1f (inset shown). a, Green, RZ marker, Tnnt2; blue, BZ1 markers, Nppa and Ankrd1. b, Green, RZ marker, Tnnt2; magenta, BZ2 markers, Xirp2 and Flnc. c, Phalloidin-stained serial section. d, H&E images of serial section. e, CM classification based on WGA staining and multiplex FISH data for quantification in f,g (see Extended Data Fig. 4 for more details). f, Quantification of nearest distance to the IZ based on phalloidin-stained serial section. g, Quantification of contacting CM neighbors. f,g, Mean; box: 25th–75th percentile; whiskers: 2.5th–97.5th percentile; n = 438,625 and 1,008 cells examined over one sample for RZ, BZ1 and BZ2, respectively. h, Quantification of contiguous thickness. Multiplex FISH data are representative of two separate experiments. ****P < .0001, two-sided Mann–Whitney U-test.
Non-myocytes of the BZ
MI results in the recruitment of millions of leukocytes into the IZ from hematopoietic reservoirs. Monocytes, monocyte-derived macrophages and neutrophils have been extensively enumerated within the infarct and recent advancements in single-cell transcriptomics are expanding our knowledge of leukocyte diversity. Despite this, the distribution of leukocyte subsets in space and their relationship to the newly defined BZ is undefined. Therefore, we mapped myeloid subpopulations in space after MI.
We classified immune subpopulations by subclustering PtprcHI (encoding Cd45) cells (Fig. 3a and Supplementary Table 1). In agreement with previous reports, this revealed several myeloid subsets including resident macrophages (Lyve1HI), monocyte-derived macrophages (Ly6c2HI, Ifit1HI, Arg1HI, C1qaHI, GclmHI, H2-AaHI, Rep), DCs (Cd209aHI) and neutrophil subsets (RetnlgHI, SiglecfHI, Ifit1HI) (Fig. 3a,b and Supplementary Table 2). To determine their spatial location, we subset and reclustered non-CM clusters, focusing on 72 h post-MI and 168 h post-MI (D7) when immune populations are dynamic (Fig. 3c, Extended Data Fig. 2 and Extended Data Fig. 4). This revealed four spatially distinct IZs (IZ1–4; Fig. 3c). Spatial plots of cluster-defining DEGs suggested that each niche consisted of multiple underlying cell types, which is expected given the multicellular spatial resolution (Fig. 3d, left). Therefore, we applied subset-specific gene-set scores to recognize the distribution of cell types (Fig. 3d, right). Overall, we found excellent reproducibility across replicates both in the abundance and spatial distribution of IZs (Extended Data Fig. 7a,b). IZ1 represented acellular regions since it had very few DEGs and showed minimal evidence of immune or CM signatures. IZ2 was predominately composed of Ly6c2HI monocytes and several macrophage subpopulations (C1qaHI, GclmHI, Lyve1HI) and consistently formed along the posterolateral wall of the left ventricle near the papillary muscle (Fig. 3e,f, top row). As expected, given the known flux of monocytes and macrophages at D4–D7 post-MI, IZ2 represented 18.5 ± 4.7% of IZ pixels at 72 h post-MI and 37.7 ± 1.4% at 168 h post-MI (Fig. 3h). Arg1HI macrophages, which are thought to resolve inflammation, dominated the transcriptional signature of IZ3 in the anterior and anterolateral wall of the left ventricle, which is the territory supplied by the occluded LAD coronary artery (Fig. 3e,f, middle row). This region was heavily fibrotic and contained abundant markers of neutrophils (S100a8, S100a9). IZ3 pixels declined from 17.8 ± 5.7% of IZ pixels at 72 h post-MI to 6.13 ± 3% at 168 h post-MI, perhaps reflecting the decline in infiltrating neutrophils (Fig. 3h). Spatial correlation analyses confirmed the colocalization of subset-specific marker genes in space (Extended Data Fig. 7c,d).
Fig. 3 |. Cardiac immune niches after ischemic injury.
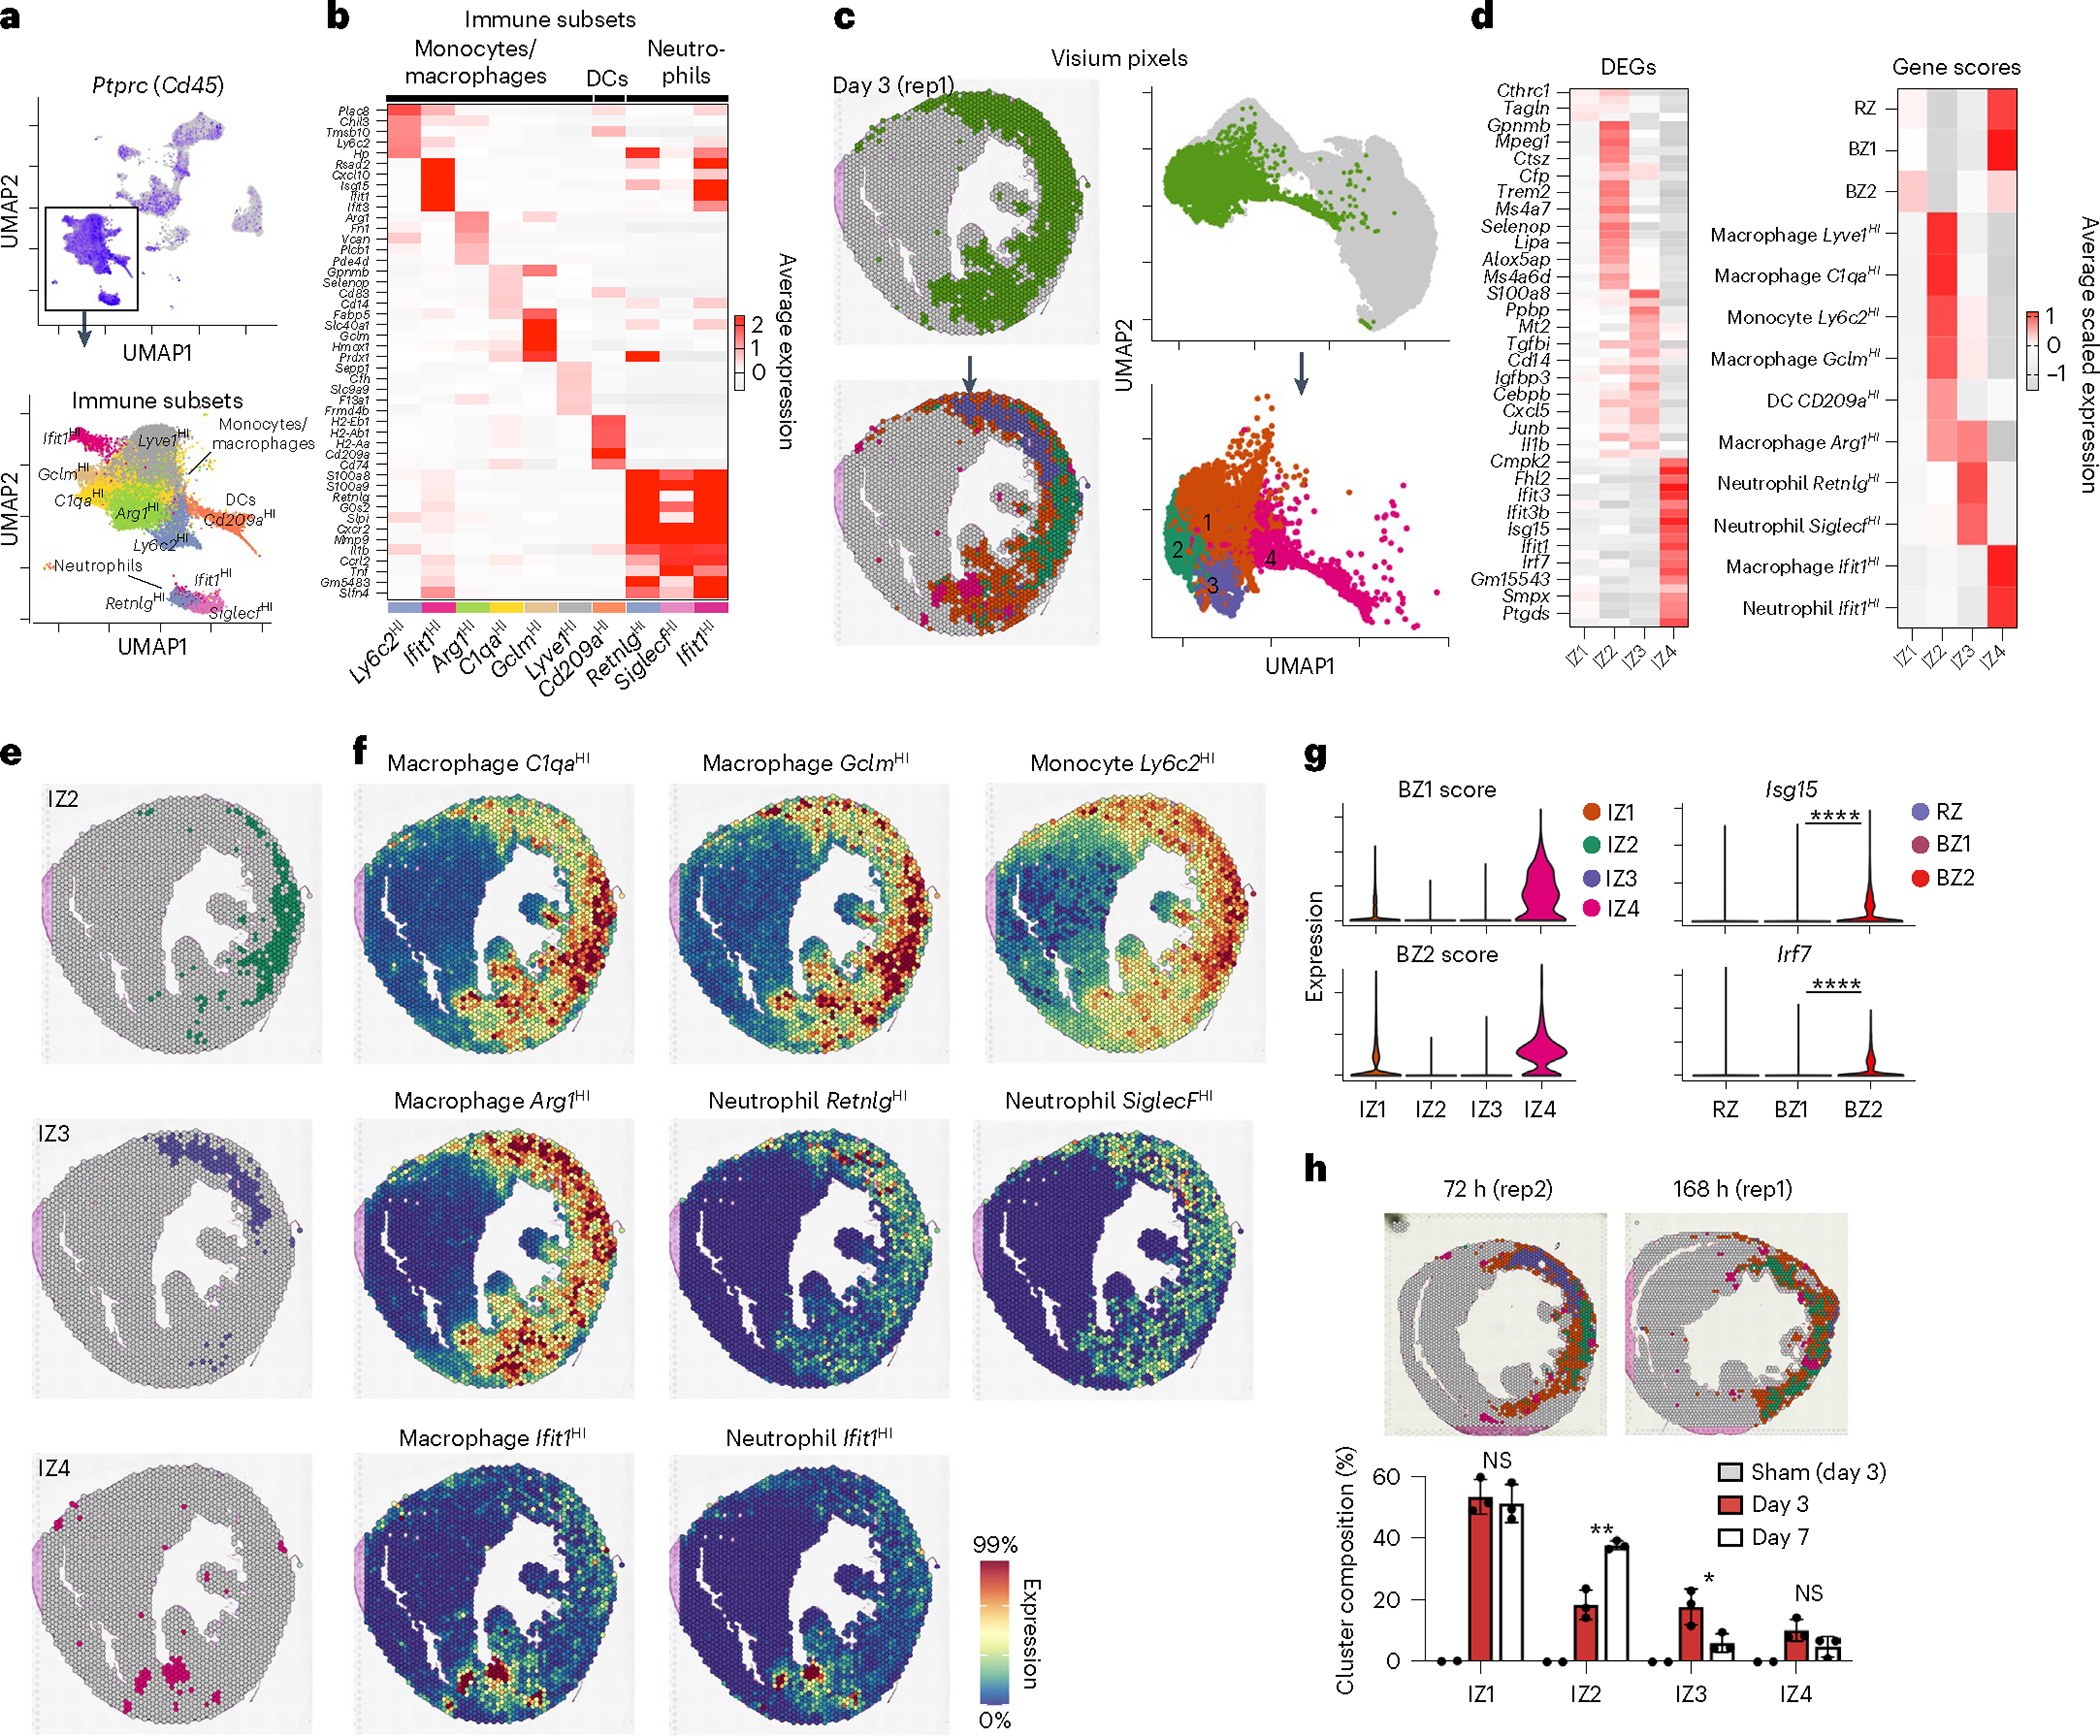
a, Top, feature plot of Ptprc (Cd45) of integrated sc/snRNA-seq data (see Extended Data Fig. 1 for more detail). Bottom, subset and reclustered monocytes, macrophages and neutrophils. b, Heatmap of average, scaled expression of the cluster-defining DEGs in a. c, Clustering results of IZ spatial transcripts derived from integrated spatial dataset including sham (n = 2), 72 h (day 3) post-MI (n = 3) and 168 h (day 7) post-MI (n = 3) samples. Clusters are color-coded in space (left) and in UMAP plots (right) as part of the full dataset (top) and subset (bottom). d, Heatmap of cluster-defining DEGs (left) and gene-set scores (right). e,f, Spatial plots of cluster (e) with contributing genes scores (f) demonstrating colocalization of immune subpopulations. g, BZ1 and BZ2 scores applied to IZs (left) and select IFN-stimulated genes in CMs (right). h, Representative spatial plots (top) of clusters in 72 and 168 h post-MI samples with bar plots (bottom) quantifying the representation of each IZ across time/sample as the percentage of total IZ pixels (IZ2, P = 002578; IZ3, P = 035219; data presented as mean values ± s.d.; n = 3 biologically independent samples). Rep, replicating. g, *P < 0.05, **P < 0.01, ****P < 0.0001; two-sided Mann–Whitney U-test. h, Unpaired Student’s t-test.
We took advantage of the low resolution of Visium to test which populations neighbored the CM BZ subsets (Fig. 3d, right); however, we found no evidence of CM colocalization suggesting that the above IZ populations are spatially distinct and thus do not directly interact with transcriptionally active BZ CMs (Fig. 3d). In contrast, interferon (IFN) induced cells from monocyte and neutrophil clusters, which expressed many stereotypical IFN-stimulated genes (for example, Ifit1, Ifit3 and Cxcl10), formed spatially localized colonies with the highest levels of CM colocalization (Fig. 3e,f, bottom row; IZ4). BZ1 and BZ2 scores were highest in IZ4 (compared to IZ1–IZ3) and Isg15 and Irf7 were most elevated in BZ2 (compared to RZ and BZ1) (Fig. 3g). This suggests that type I IFN signaling, which when inhibited leads to improved survival after MI, is mediated by or directly impacts BZ CMs20,23,50.
Fibroblasts in the BZ are known to transition from proinflammatory to profibrotic phenotypes, which associate with synthesis of supportive extracellular matrix components and release of matricellular signaling proteins; however, their colocalization with BZ1 and BZ2 CMs is unknown. To analyze fibroblasts and ECs, we subset coarse clusters defined by elevated expression of Col1a3 and Pecam1 (encodes Cd31), respectively (Fig. 4a and Supplementary Table 1). Consistent with previous reports, we identified inactivated and activated fibroblasts by the expression of gelsolin (Gsn) and actin-alpha 2, smooth muscle (Acta2) with additional underlying heterogeneity. Within activated fibroblasts, we observed a subset of proinflammatory (Cxcl5HI), matricellular-expressing (PostnHI), Col24a1HI and replicating fibroblasts24,51,52. Similarly, we found heterogenous EC populations (KitHI, Ifit1HI, Npr3HI, Slco2a1HI, Fbln5HI, Ifit1HI, Ccl21aHI, replicating) and a small population of SMCs (Myo1bHI) (Fig. 4b and Supplementary Table 2)53–56. Next, we analyzed fibroblast and EC subset gene-set scores onto the above CM-defined zones to understand their spatial distribution (Fig. 4c).
Fig. 4 |. Activated fibroblasts localize with BZ2 CMs.
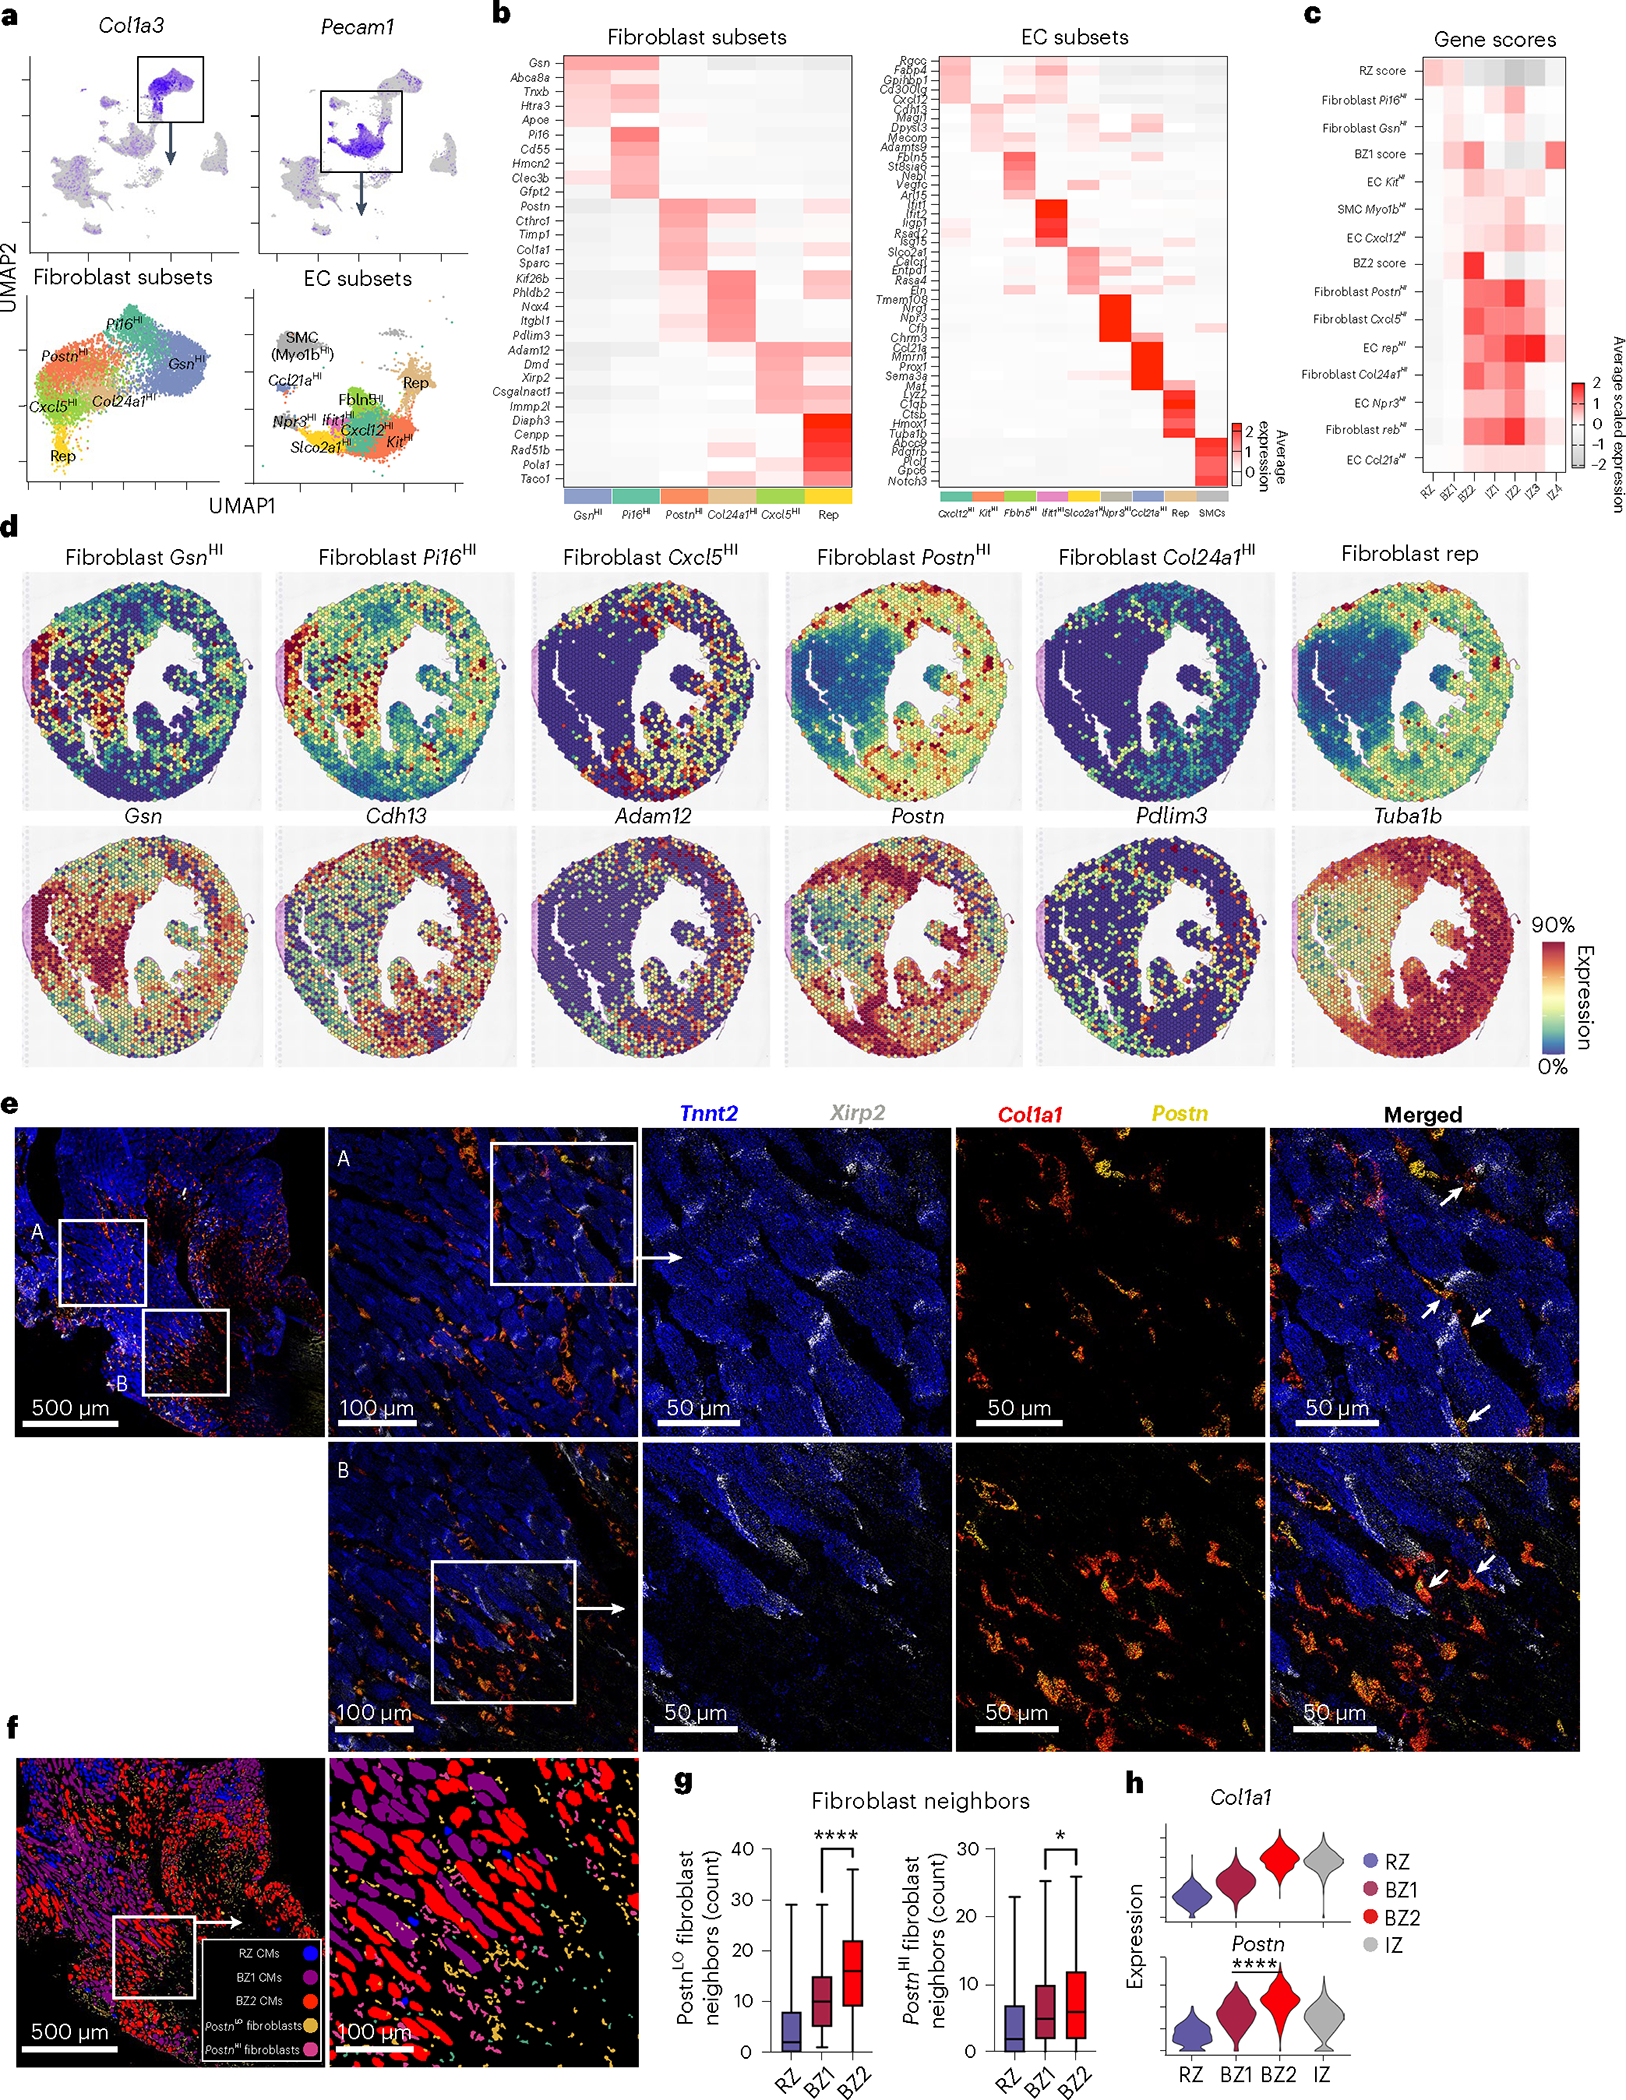
a, Top, feature plots of fibroblast (Col1a3) and EC (Pecam1) markers. Bottom, UMAP plots of fibroblast and EC subsets with marker genes overlayed. b, Heatmaps of cluster-defining DEGs from a. c, Heatmap of sn/scRNA-seq-derived gene-set scores (scaled for visualization) applied to previously defined BZs and IZs. d, Spatial feature plots with genes scores shown above and representative genes shown below. e, Multiplex FISH images of BZ (blue, Tnnt2; gray, Xirp2; red, Col1a1; yellow, Postn). f, Segmented and classified multiplex FISH data displaying CM and fibroblast subsets. g, Quantification of PostnHI/LO fibroblasts surrounding CM subsets (P = 0.0366, PostnHI; mean; box: 25th–75th percentile; whiskers: 2.5th–97.5th percentile; n = 438, 625 and 1,008 cells examined over one sample for RZ, BZ1 and BZ2, respectively). h, Violin plots of activated fibroblast markers applied to barcode-based spatial transcriptomic data. Multiplex FISH data are representative of two separate experiments. *P < 0.05, ****P < 0.0001. g, Unpaired Student’s t-test. h, Two-sided Mann–Whitney U-test.
As expected, we found inactivated fibroblasts associated with RZ CMs and BZ1 CMs (Fig. 4c,d). Proinflammatory fibroblasts (Cxcl5HI), PostnHI and replicating fibroblasts, while homogenously distributed throughout the IZ, also colocalized with BZ2 CMs (Fig. 4c,d and Extended Data Fig. 7e). BZ2 pixels represent a region of overlapping fibroblast and CM specialization. Spatial correlation analyses supported these claims (Extended Data Fig. 7c,d). Fibroblasts are known to transition from proinflammatory phenotype to a myofibroblast phenotype in the early time points after MI; our data suggest the potential for a differential role of BZ1 and BZ2 CMs in contributing to those dynamics24,57. We performed multiplex FISH to validate colocalization of PostnHI fibroblasts with BZ2 CMs (Fig. 4e). To do so, we segmented and classified stromal cells as PostnHI/LO fibroblasts based on the expression of Col1a1 and Postn and quantified their localization to CM subsets (Fig. 4f). These data showed that BZ2 CMs preferentially localized to PostnHI fibroblasts compared to BZ1 CMs, in agreement with capture-based spatial transcriptomics (Fig. 4g,h). Analysis of a human ischemic heart sample showed a similar correlation of activated fibroblasts and BZ2 CMs (Extended Data Fig. 5). PostnHI fibroblasts express several genes encoding for matricellular proteins, which have been previously associated with the BZ, notably secreted protein acidic and cysteine rich (Sparc), tenascin C (Tnc), periostin (Postn) and osteopontin (Opn)58–60. The latter is a known binding partner with CD44, a marker gene for BZ2 CMs. These nonstructural signaling proteins have both beneficial and adverse roles in ventricular remodeling as Postn-, Sparc- and Opn-null mice exhibit poor ventricular remodeling after injury, while Tnc-null mice have increased ventricular dilation and diastolic function58,61–63. In this study, our data show that matricellular-expressing fibroblasts preferentially localize to BZ2 CMs. Taken together, these data provide a spatial transcriptomic atlas of immune and stromal subpopulations in the infarcted heart and suggest multiple distinct inflammatory, fibrotic and matricellular microenvironments surrounding BZ CMs.
Onset and evolution of the transcriptional BZ
Next, we aimed to understand the mechanism(s) that underlie CM specialization after ischemia. Our data indicated enrichment of pathways associated with mechanosensing including upregulation of focal adhesions, cytoskeleton and sarcomere-associated genes as well as genes previously shown to be regulated by the transcription factor TEAD (YAP/TAZ), a classic mechanotransduction pathway. Together with histological analysis, this led us to propose the LON hypothesis. Although the BZ is often viewed as being governed by a zone of residual ischemia, only a small fraction of BZ2 CMs expressed genes associated with HIF- or heat shock-regulated genes (Fig. 1e). Therefore, we propose a model that does not depend on residual ischemia. Instead, we propose that when cells die due to ischemia, the surviving neighboring cells experience a resulting mechanical instability due to the highly asymmetric loss of load, leading to mechanotransduction changes that activate cell signaling and not only affect the immediate neighbors but also propagate surprising distances leading to the development of BZ1 transcriptional signatures hundreds of micrometers away.
A prediction of the LON hypothesis is that the BZ should develop quickly. To test this, we performed temporal profiling of CM transcriptomes after ischemia, strategically selecting early time points (1 and 4 h post-MI) before immune infiltration and later time points (24, 72 and 168 h). Indeed, we observed rapid development of BZ CM subsets suggesting that immune and fibroblast signaling likely does not cause the observed CM specialization (Fig. 5a,b). At 1 h post-MI, BZ1 CMs represented an average of 29.32% of all CMs whereas BZ2 CMs were not appreciably detected. By 4 h post-MI, BZ1 CMs rose to nearly 33% and remained at that level through 168 h post-MI. BZ2 CMs, although not present at 1 h post-MI, reached maximal abundance at 4 h post-MI (33%) and monotonically decreased at 168 h post-MI. To confirm these results, we performed spatial transcriptomics at early time points and at 168 h post-MI (Fig. 5c,d). These data showed evidence of BZ1 CMs as early as 1 h post-MI and a BZ2 signature directly neighboring the infarcted region of the anterolateral left ventricle at 4 h post-MI that persisted through 168 h post-MI (Fig. 5c,d); however, clustering did not yield BZ2 classification early time points despite elevated gene signatures. Comparison of the respective zones between times after ischemia showed that markers of immune and fibroblast specialization were not upregulated until later time points demonstrating that BZ specialization occurs before immune infiltration and fibroblast activation, although colocalization is required for the full spatial transcriptomic signature (Fig. 5e,f).
Fig. 5 |. The transcriptional BZ emerges rapidly after ischemia.
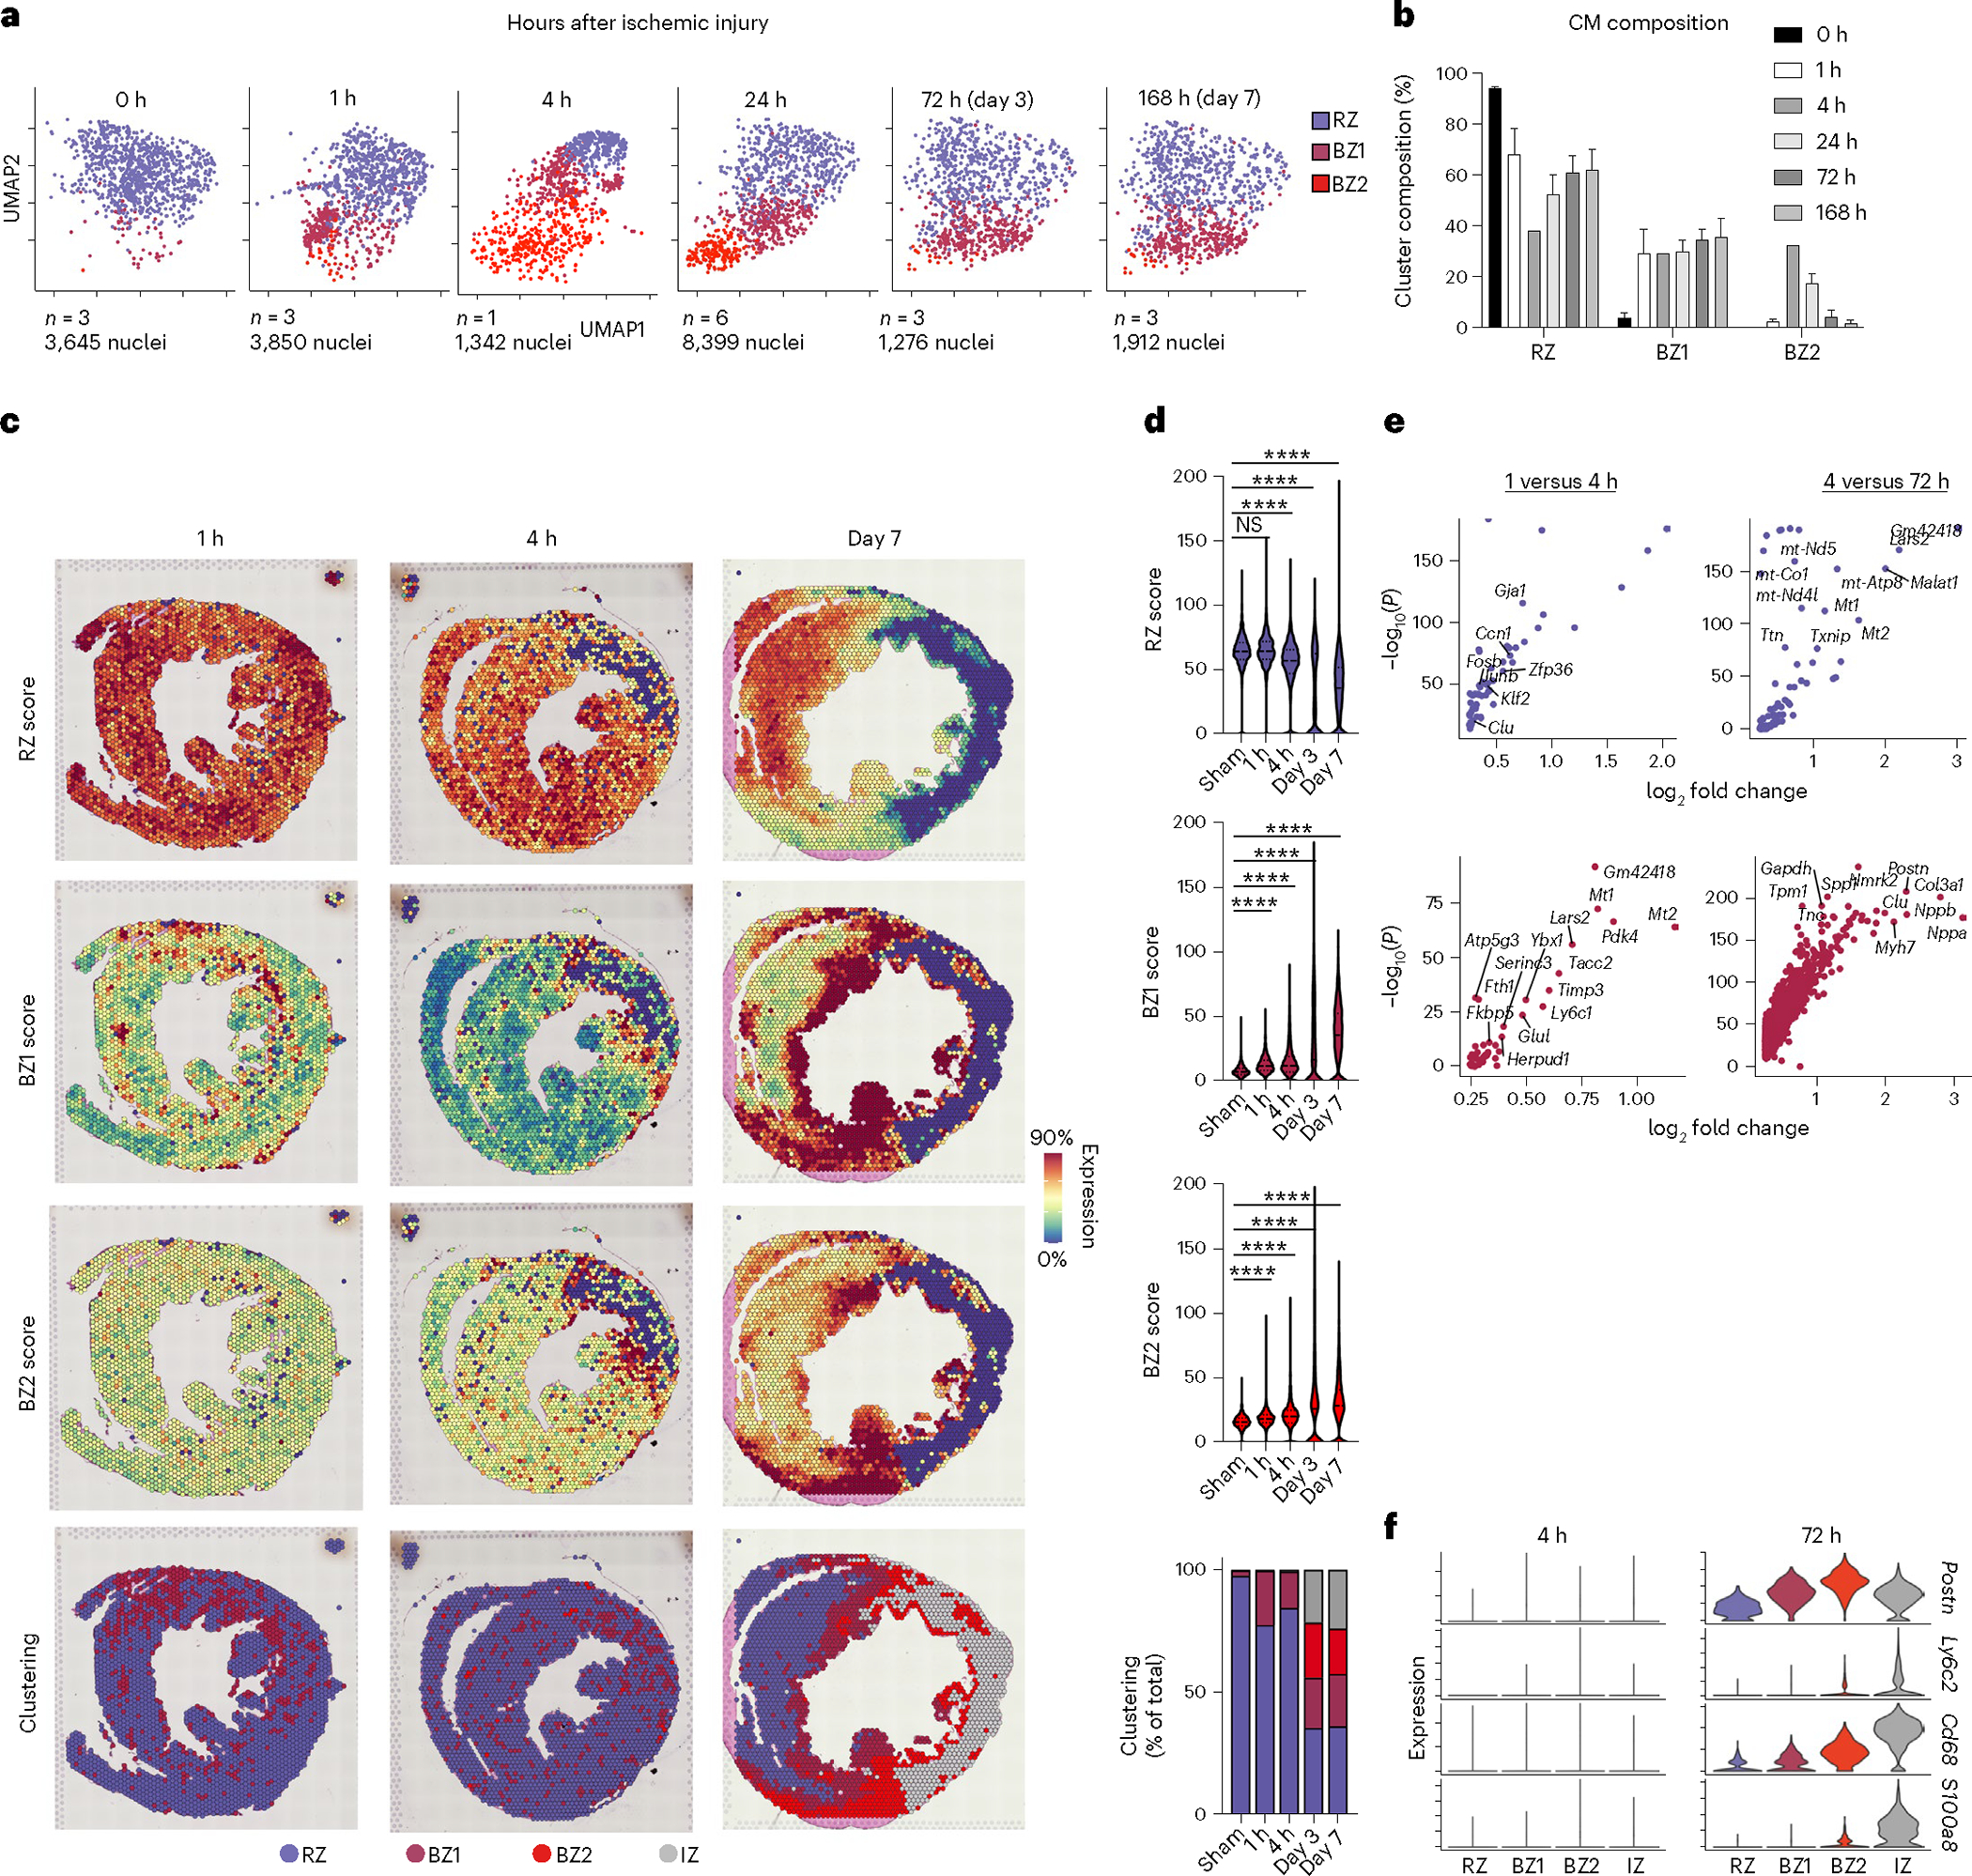
a, UMAP plots of integrated CMs split by time after ischemic injury. b, Cluster composition (percentage of total CMs per sample) as a function of time post-injury (data presented as mean values ± s.e.m.; n = 3 biologically independent samples for 0, 1, 72 and 168 h post-MI; n = 1 and 6 biologically independent samples for 4 and 24 h post-MI, respectively). c, Spatial feature plots of RZ, BZ1 and BZ2 scores and clustering results cross-sections from mouse heart 1 h (left), 4 h (center) and 168 h (right) post-MI. Clustering results are based on an integrated spatial dataset. d, Violin plots of CM subset scores as shown in c (median and 25th–75th percentile demarcated with dashed lines). Bottom, cluster ownership as the percentage of total pixel capture. e, Volcano plots displaying upregulated genes between the indicated times across respective CM subsets (Bonferroni-adjusted P values). f, Fibroblast (Postn), monocyte (Ly6c2), macrophage (Cd68) and neutrophil (S100a8) markers at 4 and 72 h post-MI. d, ****P < 0.0001, two-sided Mann–Whitney U-test.
Because BZ specialization temporally coincides with early histopathological features of ischemic injury (for example, contraction band necrosis and wavy myofibrils), we looked for histological correlates of BZ1 and BZ2, beginning with H&E-stained sections. Morphological inspection showed normal myocardium in the RZ and disorganized, yet intact, CMs in the IZ where few CM transcripts were captured. In regions with high BZ2 scores we observed wavy myofibrils (Fig. 6a, box 1) and evidence of CM detachment (Fig. 6b, box 2). To test this further, we performed actin staining (via phalloidin) and FISH-based spatial transcriptomics on serial sections. Flnc expression resembled BZ2 pattern observed by Visium (Fig. 6b). Analyses of these data revealed that at 4 h post-MI, BZ2 CMs directly neighbored regions of CMs with highly disordered myofilaments and high actin density indicative of contraction band necrosis in support of the LON hypothesis (Fig. 6c). Furthermore, terminal deoxynucleotidyl transferase dUTP nick end labeling (TUNEL) staining showed that while BZ2 CMs were TUNEL-negative, they were immediately adjacent to the densely TUNEL-positive IZ, suggesting that BZ2 CMs are not directly ischemic (Fig. 6d). Taken together, our data show that the transcriptional BZ develops rapidly, within hours of ischemia, in regions neighboring detached, frankly ischemic CMs.
Fig. 6 |. Morphological features of the emerging BZ.
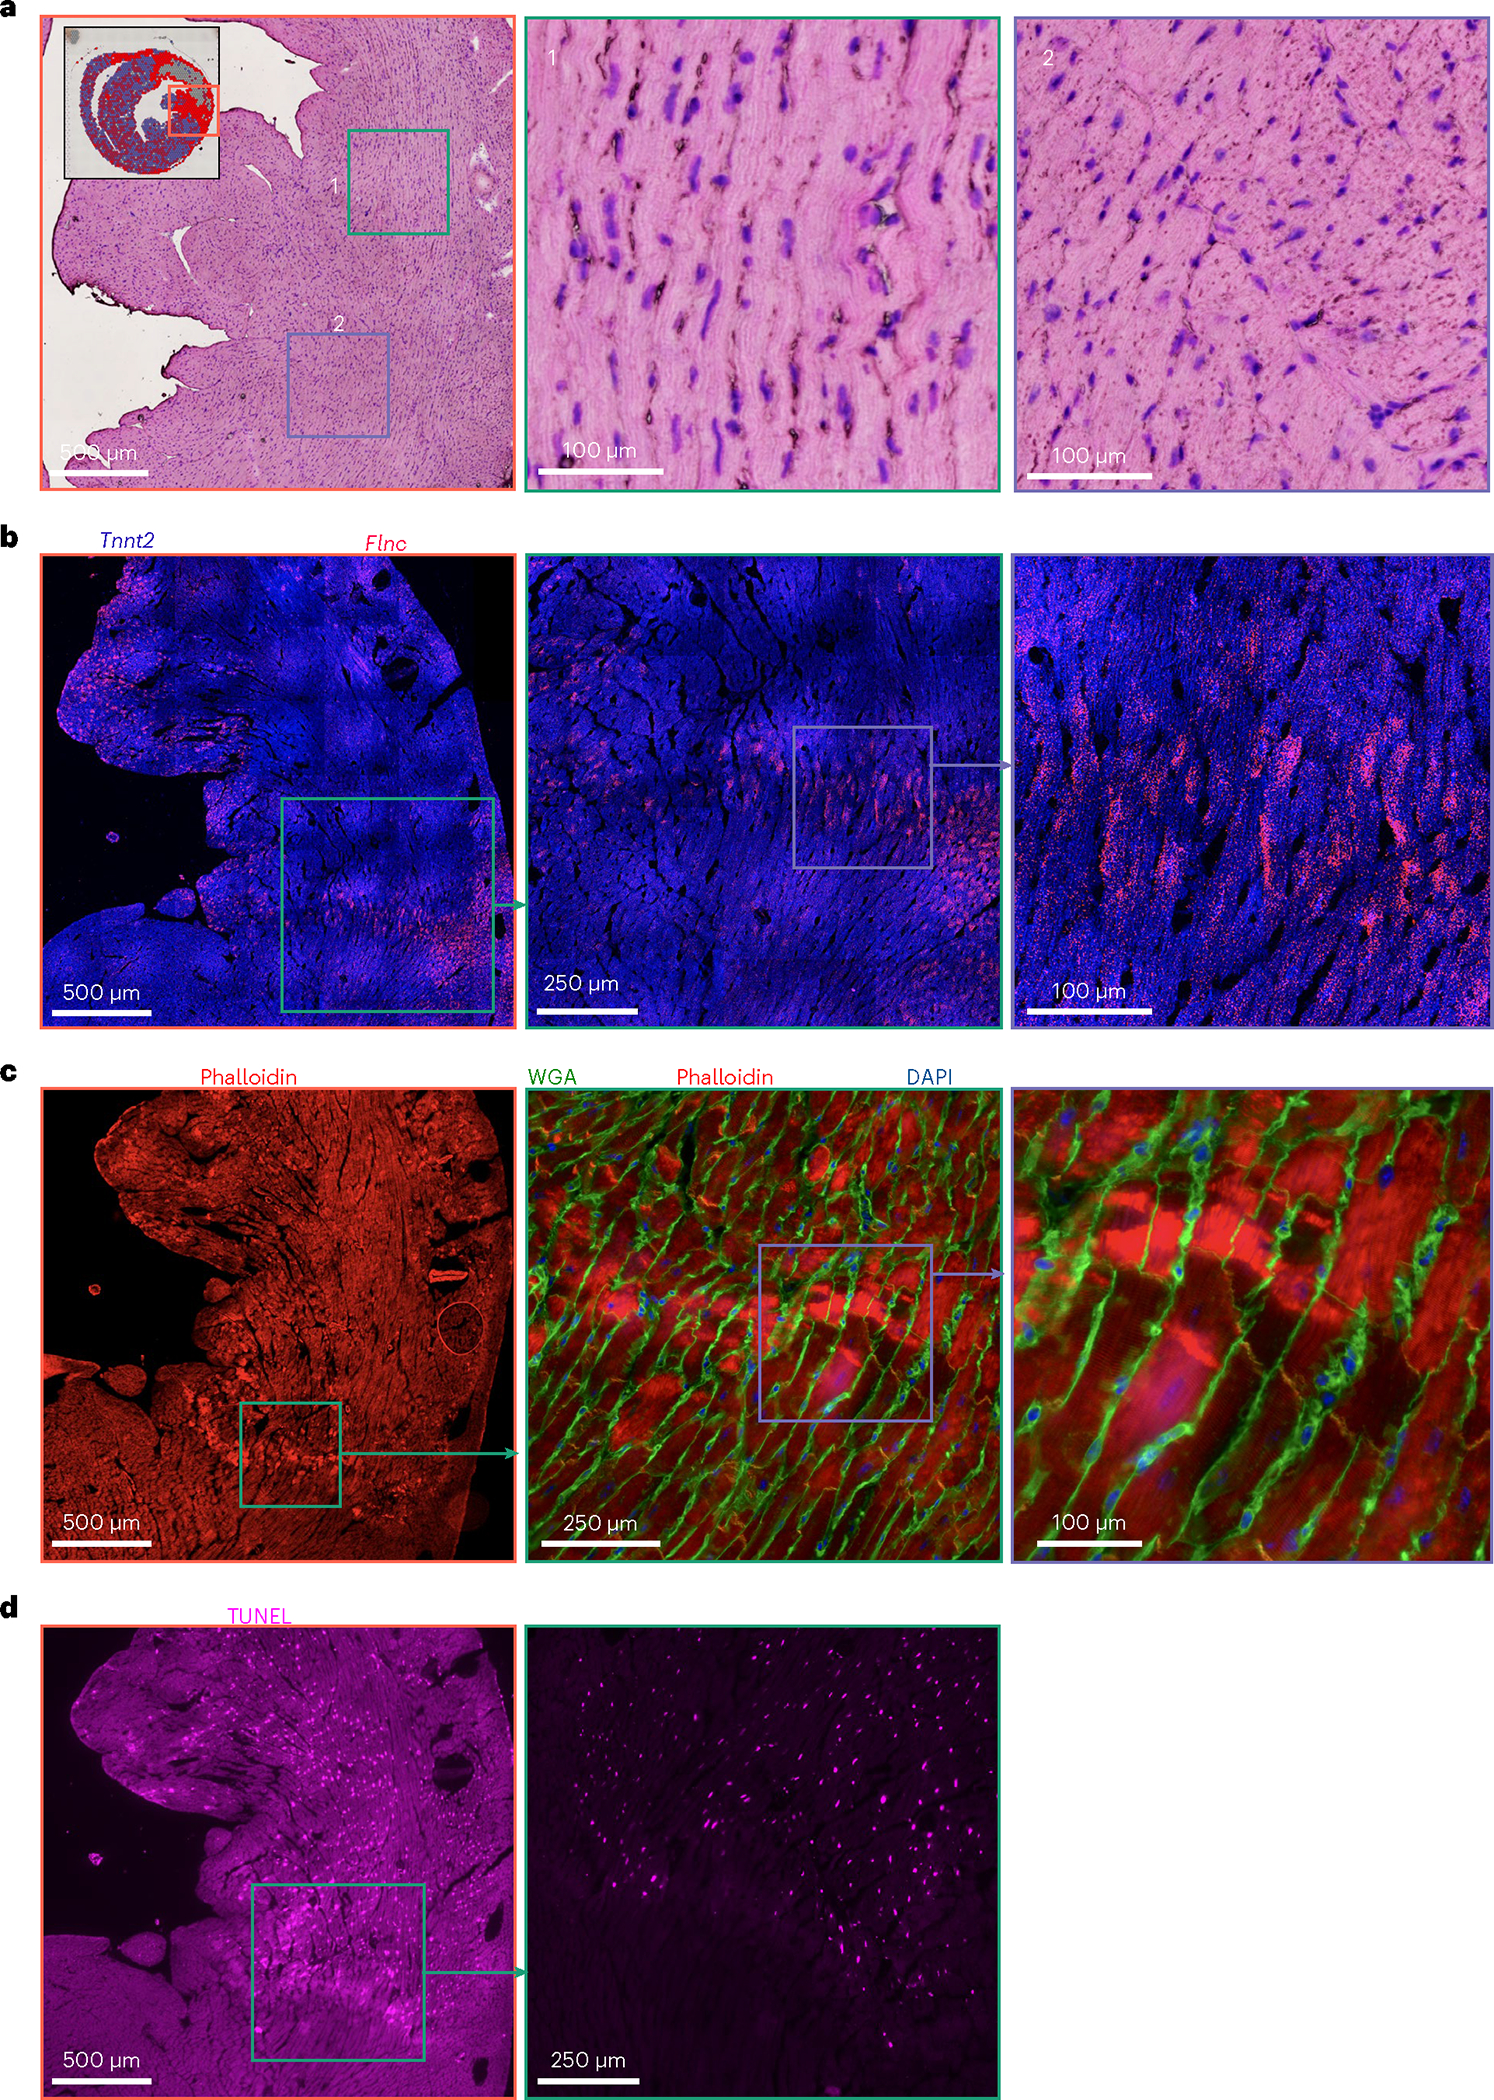
a, H&E-stained serial section of the 4 h post-MI sample shown in Fig. 5c (inset). b, FISH image showing Tnnt2 (blue) and the BZ2 marker gene, Flnc (red). c, Phalloidin (red), WGA (green) and DAPI (blue) staining of the consecutive serial section shown in b. d, TUNEL staining of consecutive serial section shown in c. Multiplex FISH data and images are representative of two separate experiments.
The transcriptional BZ in mechanical injury models
A prediction of the LON hypothesis is that nonischemic injuries can also cause LON events and precipitate BZ1 and BZ2 transcriptional responses. To test this, we subjected mice to sharp needle trauma (NP) from the epicardium into the mid-myocardium with the goal of causing mechanical disruption with minimal ischemia and collected the tissue for spatial transcriptomics after 72 h (n = 4; Fig. 7a, Extended Data Fig. 8a,b and Methods). We excised only a portion of the LV wall. NP injury sites were identifiable in H&E-stained sections by regions of detached CMs surrounded by immune infiltrate (Fig. 7b). Integration of the resulting spatial count matrices with data from ischemic models showed that the NP injury recapitulated MI-induced CM transcriptomes with comparable fractions of RZ, BZ1, BZ2 and IZ pixels in the excised areas and elevated BZ1 and BZ2 gene scores relative to sham (Fig. 7c–e). CMs directly lacking contact neighbors had elevated BZ2 scores and BZ1 scores persisted over a couple hundred micrometers toward the RZ (Fig. 7f and Extended Data Fig. 8a,b). It is possible that NP injury causes local microischemic events. To test this, we examined NP injury for transcriptional evidence of ischemia by constructing and comparing HIF1-dependent gene-set scores (Methods) in NP injury to sham and 72 h post-MI samples. We found that HIF1 scores were decreased relative to 72 h post-MI samples and were comparable to sham (Extended Data Fig. 8c). In addition, we performed a dye perfusion assay by injecting WGA into the left ventricle at either 10 min or 72 h after NP injury, waited 20 min for WGA binding and collected tissue for imaging (Extended Data Fig. 8e). CMs at the site of injury exhibited similar WGA staining levels to the RZ, suggesting that both areas are well perfused immediately and 72 h after injury (see Extended Data Fig. 8e for full details). Taken together these data show that NP injury is sufficient to induce the transcriptional BZ phenotype.
Fig. 7 |. Ischemic injury is not necessary and mechanical trauma is sufficient to elicit BZ biology.
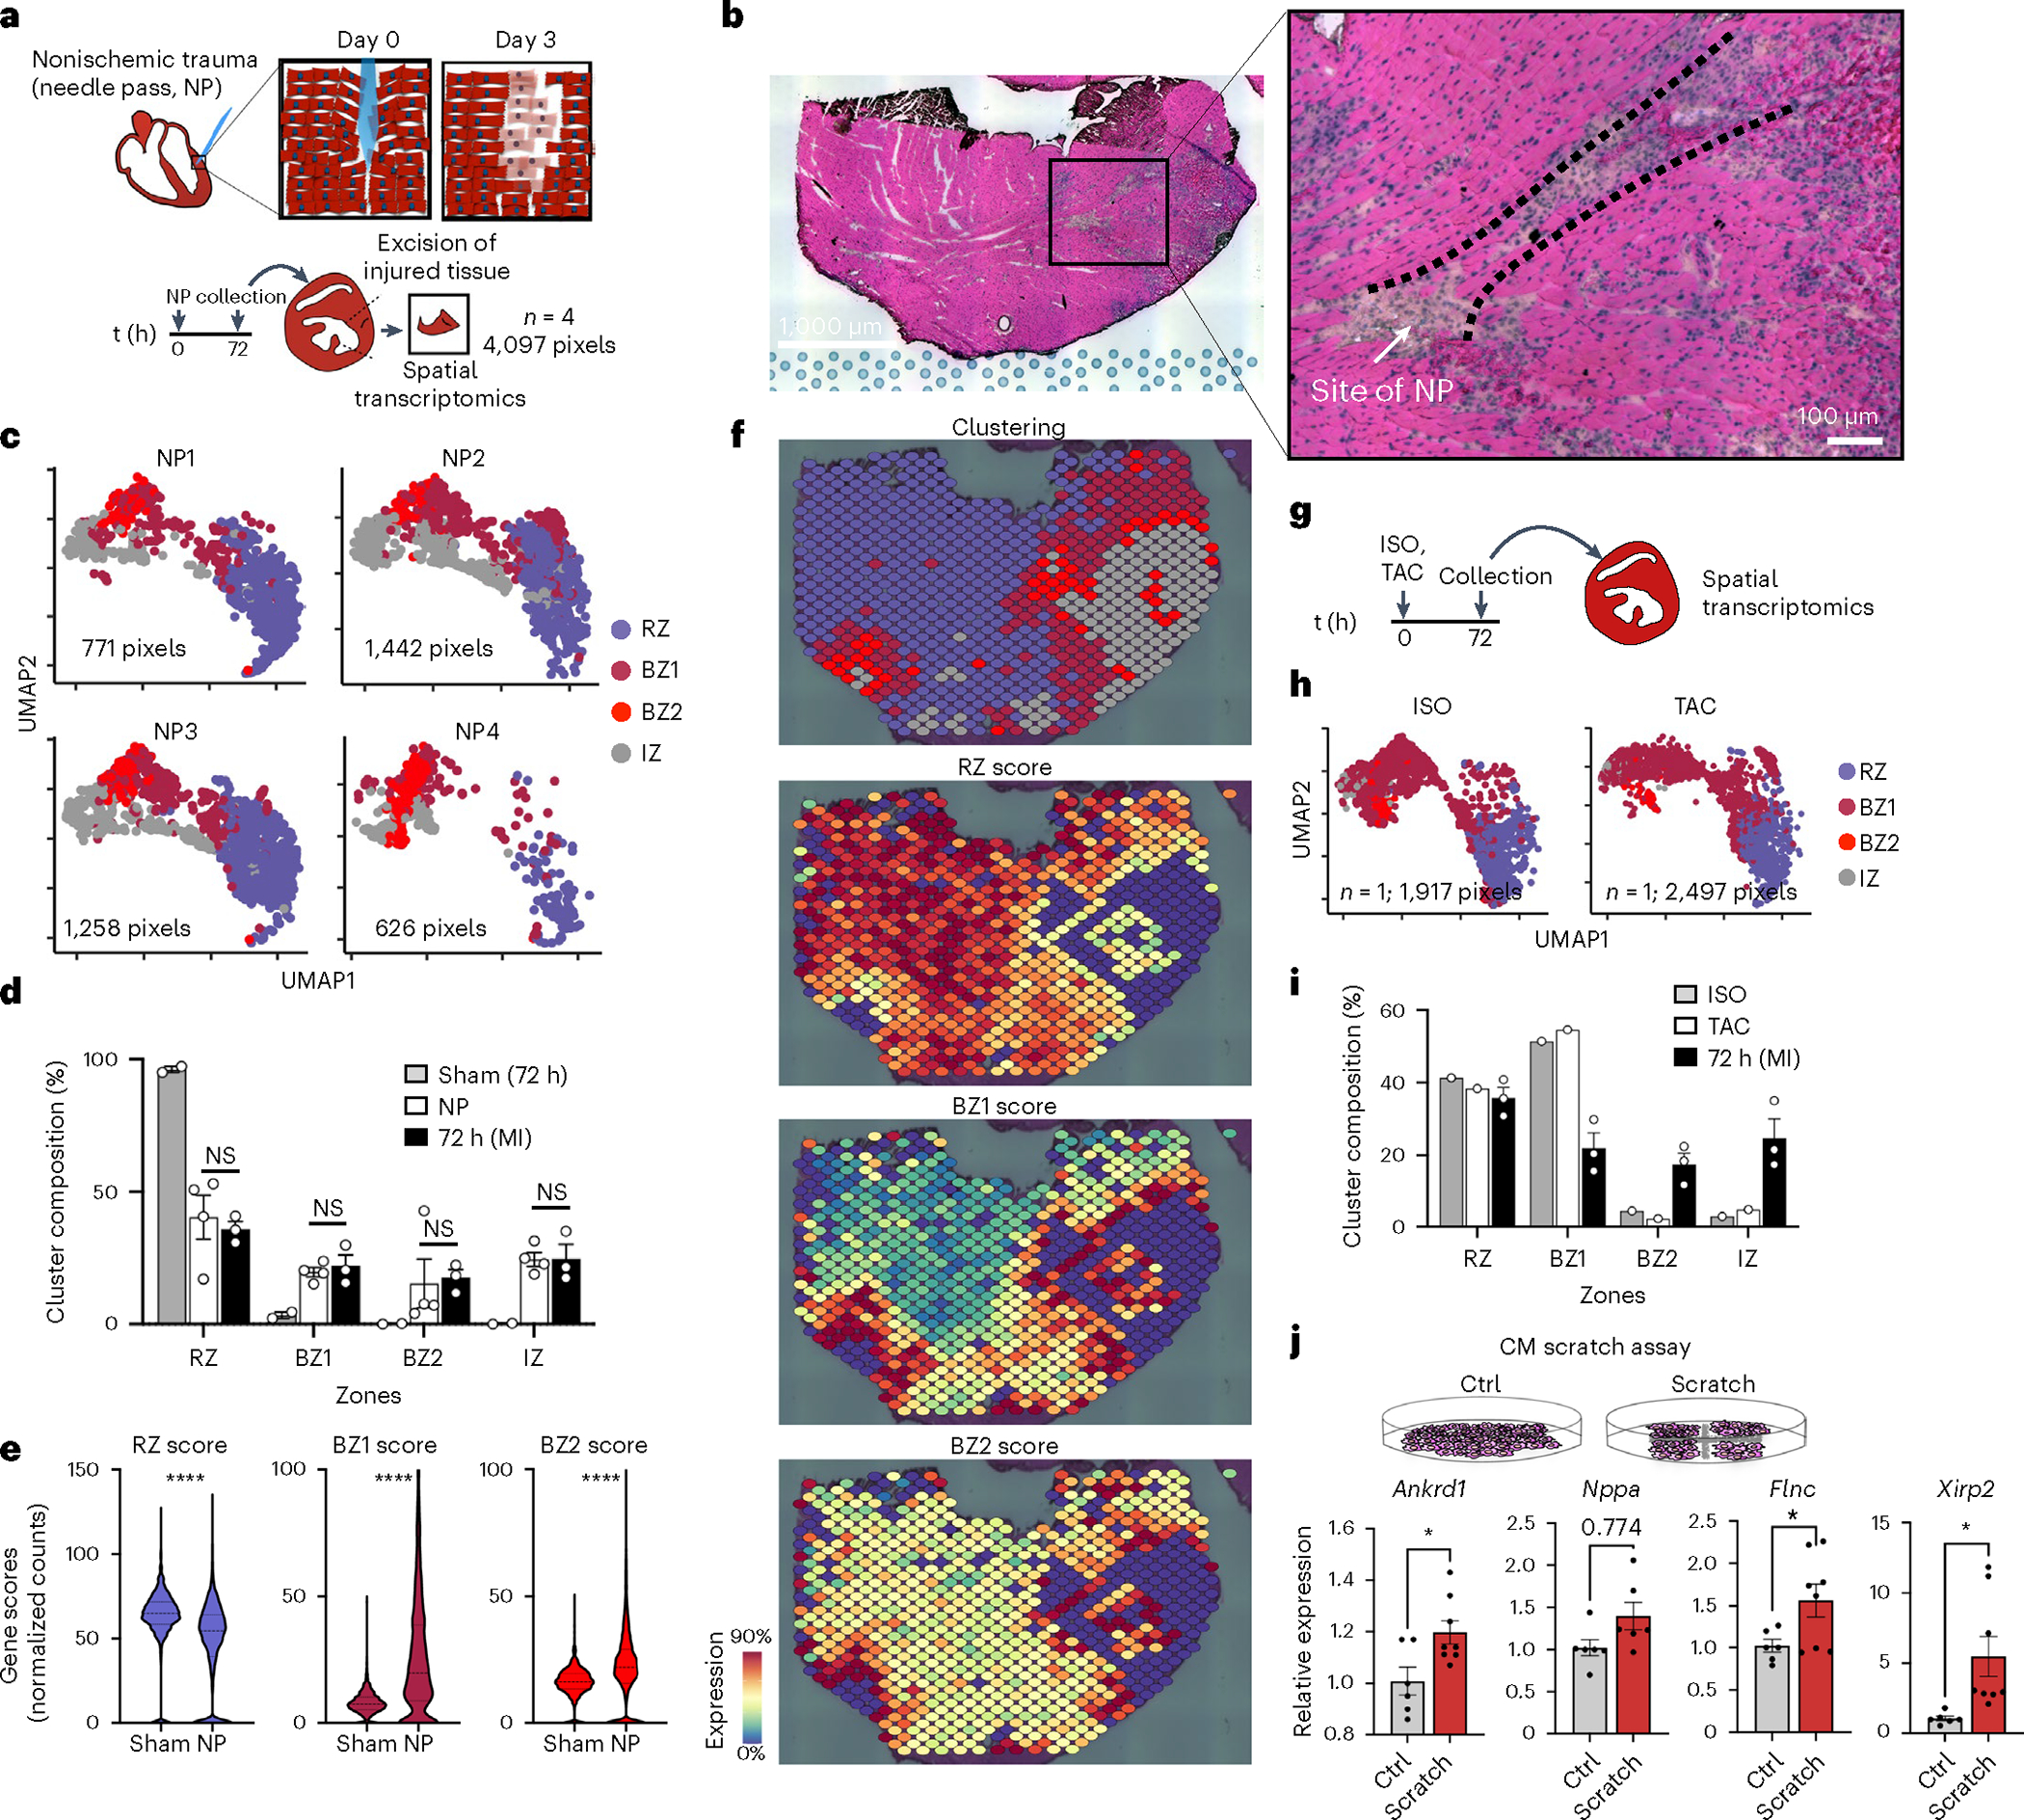
a, To induce nonischemic, mechanical trauma in the heart, we subjected hearts to NP (see Methods for full details), collected tissue 72 h after injury and excised the injured section of the left ventricle for spatial transcriptomics (n = 4; 4,097 pixels). b, The site of NP injury was identified in the H&E-stained sections by immune infiltrate and disrupted myocyte bundles. Representative image of four separate experiments. c, UMAP plots of each NP replicate in the same integrated space as the permanent ligation samples. d, Bar plots comparing the cluster composition of NP (n = 4) to sham (n = 2) and 72 h post-MI (n = 3) samples. e, Violin plots of RZ, BZ1 and BZ2 scores comparing sham to NP injury (all samples combined; median and 25th–75th percentile demarcated with dashed lines). f, Spatial plots showing BZ1 and BZ2 signatures (top, clustering; bottom, gene-set scores) surrounding the site of injury. g, Mice were subjected to either ISO treatment (n = 1) or TAC (n = 1) and collected for spatial transcriptomics after 72 h. h, UMAP plots of ISO and TAC samples in integrated space with i cluster composition quantified below (percentage of total pixels per sample, n = 1). j, Scratch assay was performed on confluent cultures of NRVMs seeded on 6-well plates; RNA was isolated from cultured cells 24 h after the scratch assay was performed. The BZ genes Ankrd1 (P = 0.0196), Flnc (P = 0.0394) and Xirp2 (P = 0.0212) were significantly increased in scratched NRVMs compared to unscratched Ctrl plates (n = 6, Ctrl; n = 8, scratch); Nppa did not reach statistical significance (P = 0.0774). d,i,j, Data are presented as mean values ± s.e.m. *P < 0.05, ****P < 0.0001. d,j, Unpaired Student’s t-test. e, Mann–Whitney U-test.
We investigated if other nonischemic injury models were also sufficient to induce BZ signatures. We subjected mice to either a single high-dose of ISO or TAC and performed spatial transcriptomics after 72 h (Fig. 7g). These data show that both injury models result in a predominant BZ1 signature, homogenously dispersed throughout the myocardium, suggesting that the BZ1 can be induced by CM stretch (Fig. 7h,i and Extended Data Fig. 8a,b). Given the dependency of force transmission and muscle fiber orientation, we quantified the anisotropy of BZ gene propagation relative to myocyte bundle direction. To reduce the confounding effects of complex three-dimensional geometries, we limited our analyses to BZs created by NP injury because they are a more focal injury. We also focused on myocyte bundles that were visualized on their longest extent (long axis), directly neighboring the site of injury (Extended Data Fig. 8e and Methods). These analyses showed that gene-set scores of BZ1 but not BZ2 propagated farther in the long axis direction of the myocyte bundle compared to the short axis (Extended Data Fig. 8g). Finally, we repurposed the canonical in vitro scratch assay to test our LON hypothesis in confluent cultures of isolated neonatal rat ventricular myocytes (NRVMs) (Fig. 7j). The physical scratches in the culture plates separated myocytes from their neighbors and we measured their transcriptional responses to the mechanical separation using quantitative PCR. The loss of CM neighbors transcriptionally upregulated the BZ2 genes, Flnc and Xirp2, and to a lesser extent the BZ1 gene, Ankrd1, compared to unscratched Ctrl plates. Taken together, these data show that nonischemic, mechanical trauma is sufficient to induce the development of BZ transcriptional phenotypes and provides support for our LON hypothesis.
Discussion
The BZ of the infarcted heart has fascinated and mystified the cardiovascular community for over a century. In this study, we show that the ischemic BZ can be transcriptionally microdissected and functionally redefined with single-cell spatial resolution using sc/snRNA-seq, spatial transcriptomics and multiplex FISH. We found that BZ CMs divide into two major populations, each with internal substructure. BZ1 CMs (Nppa+Xirp2−) extend hundreds of micrometers into the surviving myocardium and are morphologically indistinguishable from nearby RZ CMs despite being transcriptionally distinct. In contrast, BZ2 CMs (Nppa+Xirp2+) form a thin, nearly single-cell-thick layer of morphologically disturbed cells decorating the complex interface between surviving and dead myocardium.
We found that the transcriptional BZ develops rapidly, within hours after ischemia, arguing for a direct response by CMs rather than an indirect response to infiltrating immune cells. Although prevailing wisdom attributes BZ biology to residual peri-infarct ischemia, we found only minor subset of BZ CMs expressing HIF-dependent gene programs, primarily on post-MI day 1. By contrast, we found that the dominant transcriptional fingerprint of BZ CMs was detectable throughout the first week after MI and was characterized by the expression of genes encoding mechanosensing and mechanotransduction proteins. This prompted us to test whether mechanical injury was sufficient to induce BZ transcriptional profiles. Indeed, spatial transcriptomic profiling in three in vivo models (TAC, ISO and NP) as well as quantitative PCR of BZ marker genes after mechanical scratching of CM cultures all suggested that mechanical injury is sufficient to induce BZ expression patterns. This inspired the LON hypothesis, in which we propose that ischemia causes cell death in the IZ, which results in loss of cell neighbors from the perspective of surviving cells at the IZ–BZ interface. We propose that LON at the IZ–BZ interface causes mechanical destabilization that is transmitted many cell lengths (hundreds of micrometers) into the surviving myocardium to induce CMs to express BZ1 genes. We speculate that pressure overload and ISO (at the time points we analyzed) predominantly induced BZ1 because they generated destabilizing mechanical forces without frank LON whereas the NP model generates a combination of LON and mechanical destabilization, resulting in BZ2 and BZ1 CMs. The in vitro scratch test is arguably the clearest evidence that mechanical cell disruption can induce BZ genes. We suspect that induction BZ2 signatures were more prominent than BZ1 in culture due to the lack of a confluent monolayer through which to propagate. Finally, it is tempting to speculate that morphologically deranged BZ2 CMs at the IZ edge are fated to die. If so, they would create new LON events for their closest BZ1 CM neighbors and provide a plausible mechanism for ‘infarct expansion’, a long-investigated process by which infarcts extend well beyond territories of myocardium supplied by the culprit obstructed vessel13,64,65. Future work will aim to explore mechanisms of initiation, fate, evolution and modulation of BZ1 and BZ2 in the above injury models.
Our report is not the first to show that BZ CMs express unique transcriptional fingerprints. In situ hybridization has shown that CMs selectively express candidate genes at the infarct BZ in mice and humans3. Our work confirms, extends and generalizes these observations by showing that unbiased transcriptional profiling of CM nuclei encodes spatial context within the infarcted heart. The gene sets revealed by single-nucleus transcriptomics add to the growing body of literature surrounding BZ CM subsets and transcriptional regulators such as Yap/Tead, Pitx2 and Mef2− within the injured heart3,37,46,47,66,67. In addition, we defined local stromal and immune contexts within the RZ, BZ and IZ, topics that will require dedicated mechanistic exploration.
We analyzed a human MI sample and found evidence of the same BZ transcriptional fingerprints observed in mice. However, human samples must be interpreted with caution. Human heart tissue only becomes available for research when patients suffering from life-threatening ischemia, cardiogenic shock and arrhythmias require ventricular assist devices or heart transplantation, or when they die. Such patients often have prior ischemic injuries and are confounded by aggressive clinical interventions such as inotropes, defibrillations and temporary percutaneous mechanical circulatory support. Mouse models offer a complementary view because they avoid the confounding effects of clinical care while allowing for more defined injuries, more controlled sampling times and flexible mechanistic exploration using genetically modified strains. Moreover, their smaller length scale allows the entire short axis to be transcriptionally profiled from the RZ through the BZs into the IZ without interruption. Nevertheless, mice are merely a model and may lack important elements of the human disease. At the time of this writing, a complementary manuscript was published using spatial multi-omics to define the cells and niches across many post-MI human heart samples and they observed many similar BZ genes31.
The present report raises many questions for future studies. What are the molecular mechanisms that transmit information from the IZ to BZ1 cells hundreds of micrometers away? What are the functions and fates of BZ1 and BZ2 CMs? Do BZ1 and BZ2 have proliferative potential? Do BZ2 CMs represent a recoverable population or are they destined to die? Do BZ2 CMs represent the evolving edge of ‘infarct expansion’ and if so, is the process modifiable to reduce ‘infarct size’ and progression to heart failure? Future studies are needed to shed light on the multiscale biology and organ-level significance of BZ CM subsets and their stromal, immune and vascular contexts. Such studies will be challenging because the transcriptional and histological techniques employed in this work only capture snapshots in time, while the underlying processes are undoubtedly dynamic. While bioinformatics methods based on pseudotime can reveal some dynamics, techniques such as lineage tracing will be critical for defining how the transcriptional BZ evolves across space and time and how it is linked to cell fate.
In conclusion, by defining the single-cell spatial transcriptomes of the BZ specifically, and the infarcted heart more generally, we hope to offer a reference dataset for future mechanistic studies aimed at therapeutically modulating the determinants of ischemic heart disease for clinical benefit.
Methods
Animals
Adult C57BL/6J (WT, stock no. 000664) mice were purchased from the Jackson Laboratory. All experiments were performed with 10–14-week-old animals and were carried out using age- and sex-matched groups without randomization. All mice were maintained in a pathogen-free environment of the University of California San Diego (UCSD) facilities and all animal experiments were approved by the subcommittee on Animal Research Care at UCSD (Institutional Animal Care and Use Committee, S17144).
Permanent ligation (MI), TAC and ISO injection
For the following surgical procedures, mice were intubated and ventilated with 2% isoflurane. For MI, thoracotomy at the fourth left intercostal space was performed to expose the heart. The LAD was permanently ligated with an 8–0 nylon suture in mice with MI; for ischemia-reperfusion (I/R) injury, the LAD was occluded for 30 min to induce ischemia after which the ligature was released to reperfuse the myocardium. Hearts were collected at various time points postsurgery (1, 4, 24, 72 and 168 h).
Pressure overload injury was surgically produced by constriction of the transverse aorta. The chest was opened at the second left intercostal space and a 7–0 nylon suture was loosely tied around the transverse aorta between the left carotid and innominate arteries. A blunt-end 27 G needle was placed across the nylon knot along the transverse aorta to control the degree of constriction. The nylon knot was then tightened against the 27 G needle. Once the constriction was secured with a double knot, the needle was quickly removed. The ribs and intercostal muscles were closed by 6–0 absorbable nylon sutures and the skin was sutured with 6–0 nylon suture. Hearts were collected at day 3 postsurgery.
ISO hydrochloride salts were dissolved in 1 ml of saline for a final concentration of 100 mg ml−1 and administered via intraperitoneal injection at a dose of 300 mg kg−1 body weight. Hearts were collected 3 d posttreatment for downstream analysis. All mice used in these studies were monitored for signs of distress, acute heart failure and administered buprenorphine as an analgesic in surgical conditions.
Cardiac NP injury
Mice were anesthetized under 2% isoflurane. Partial thoracotomy was performed between the third and fourth left intercostal space and a chest retractor was inserted. After identification of the LAD coronary artery, a 28 G beveled needle was inserted into the lateral LV wall to the right of the LAD at the level in which the vessel is usually occluded in MI or I/R surgical models. The needle was held in position for 3 s before withdrawn. The chest retractor was removed and the chest and skin were closed with 6–0 prolene sutures. To reduce complications due to pneumothorax, a sterile 20 G flexible angiocatheter was placed within the pleural space before the chest was sutured closed. After closure of the skin, a syringe was attached to the angiocatheter and negative pressure was manually applied as the catheter was withdrawn. Surgical glue was then applied to the remainder of the skin incision.
Immunohistochemistry
Hearts were perfused with 10 ml of cold PBS through the ventricular apex to remove contaminating blood. Ventricular tissue was embedded in optimal cutting temperature (OCT) compound and flash-frozen in an isopentane bath on dry ice. OCT-embedded hearts were sectioned into serial 10-μm-thick short-axis sections to use for immunohistochemical staining with H&E according to the manufacturer’s instructions. Sections were stained with the following stains to identify cellular and biochemical features: cell boundaries (WGA Alexa Fluor 488; Invitrogen), actin (phalloidin Alexa Fluor 64; Cell Signaling Technology) and apoptosis (TUNEL Alexa Fluor 647; Invitrogen). Slides were imaged and tiled on a Nikon Eclipse Ti2-E widefield microscope.
Scratch assay
NRVMs were isolated from 1-d old Sprague Dawley hearts. CMs were liberated by collagenase II digestion (Worthington) and were then purified by Percoll density gradient. Myocytes were then seeded onto gelatin-coated, 6-well plates at a density of 6.5 × 10⁶ cells per well in 10% FCS in DMEM supplemented with 100 units ml−1 penicillin. Once confluent and simultaneously beating, myocytes were serum-starved for 24 h. Scratch was performed across the cell layer in a vertical line using a 1-mm pipette tip held perpendicular to the bottom of the well. An additional scratch was performed perpendicular to the first line. Cells were washed with PBS 24 h post-scratch and RNA was isolated from the cells using the RNeasy Mini Kit (catalog no. 74536; QIAGEN) and reverse-transcribed (catalog no. 4368813; Applied Biosystems). Real-time qPCR was performed with the following TaqMan-specific primers for Ankrd1 (Rn00566329_m1), Flnc (Rn01500378_m1), Nppa (Rn00664637_g1; catalog no. 4331182), Xirp2 (Rn01640240_m1) and Gapdh (Rn01775763_g1).
Determination of regional ischemia or hypoxia
NP injury was performed and WGA to Alexa Fluor 488 (catalog no. W11261; Invitrogen) was injected directly into the left ventricle (1 mg ml−1) at 10 min or 72 h after NP injury. Hearts were collected 30 min after WGA injection and embedded in OCT followed by flash-freezing in isopentane cooled with dry ice. The NP injury site was visualized and captured in 10-μm-thick sections using a Nikon Eclipse Ti2-E widefield microscope under 20× objective. Fluorescent pixel intensities were quantified by sampling four regions of interest (ROIs) of equal areas at the site of needle injury used as the negative Ctrl, the zone directly neighboring the site of injury designated as neighbors and an uninjured area of individual hearts designated as the positive Ctrl for WGA fluorescence. ROIs from each site were analyzed for fluorescence intensity using the ImageJ (Fiji, version 2.1.0/1.53c) image analysis software. These perfusion experiments were complemented with gene-set scores derived from unsupervised analysis of DEGs in hypoxia-inducible transcripts in the Hif1 pathway (Egln3, Vegfa, Gbe1, Atf3, Pfkp, Mthfd1l).
sNRNA-seq
Single nuclei were isolated from frozen tissue using a modified version of the protocol described by Muhl et al.52. Mice hearts were weighed and minced before flash-freezing with liquid nitrogen. Minced samples were resuspended in 0.5 ml nucleus lysis buffer (Nuclei EZ prep, product no. NUC101; Sigma-Aldrich), 0.2 U μl−1 RNase inhibitor (stock 40 U μl−1, part no. Y9240L; Enzymatics) and homogenized with a 2-ml dounce grinder for 10 strokes with A motor and at least 20 strokes with B motor (catalog no. D8938; Sigma-Aldrich). The lysates were resuspended with another 1 ml of nucleus lysis buffer and 2.5 min of incubation and were filtered through 100, 50 and 20-μm cell strainers (04–004-2318, 04–004-2317 and 04–0042-2315 filters; CellTrics). Then, they were centrifuged at 1,000g for 5 min at 4 °C to pellet nuclei. As Cui et al.30 described, the nuclear pellet was subsequently washed once in 6 ml of sucrose buffer and the cushioned suspension was centrifuged at 1,000g for 10 min at 4 °C to pellet the nuclei. The pellet then was washed with 2 ml of nucleus storage buffer with 10 μg ml−1 4′,6-diamidino-2-phenylindole (DAPI) and centrifuged at 1,000g for 5 min at 4 °C (5 mg ml−1, catalog no. D1306; Invitrogen). Then, 200 μl of nucleus wash buffer (fresh 2% bovine serum albumin (BSA) in 1× PBS, 0.2 U μl−1 RNase inhibitor and 1 mM EDTA) were added and nuclei were resuspended. Fluorescence-activated cell sorting was used to sort the extracted nuclei. Nuclei were collected based on the separation between DAPIhigh and DAPIlow (Extended Data Fig. 1c). After sorting using purity mode, DAPIhigh nuclei were pelleted at 1,000g for 15 min at 4 °C, resuspended in 2% BSA; trypan blue-stained nuclei suspension were quality-controlled and counted using a hemocytometer (3110 V; Hausser Scientific).
snRNA-seq was performed by microfluidic droplet-based encapsulation, barcoding and library preparation (Chromium, 10X Genomics). Paired-end sequencing was performed on an Illumina NovaSeq instrument. Low-level analysis, including demultiplexing, mapping to a reference transcriptome (mm10–1.2.0-premrna) and eliminating redundant unique molecular identifiers (UMIs), was performed with the Cell Ranger 3.0.2 pipeline for the 10X samples.
Quality control, normalization and integration
To account for variations in sequencing depth, the total transcript count for each cell was scaled to 10,000 molecules and raw counts for each gene were normalized to the total transcript count associated with that cell and then natural log-transformed. Cells with between at least 200 uniquely expressed genes and genes that were expressed in at least 3 cells were retained for further analysis. Ribosomal and hemoglobin genes were excluded to avoid incorporation of any artifacts such as technical variables. Since low-quality/dying cells present a mitochondrial genome, we calculated mitochondrial quality control metrics for all samples and replicates from single nuclei and single cells using the PercentageFeatureSet function. Then we excluded cells that presented more than 5% mitochondrial content. Moreover we removed doublets by determining cells that contained non-endogenous gene markers (for example, presence of CM genes such as Myh6 in the fibroblast subset) (Extended Data Fig. 1f,h,l), which showed subsets after filtering and removing doublets/multiples. Highly variable genes across individual datasets were identified with the FindVariableFeatures method from the Seurat R package v.4.1 by selecting 4,000 genes with the highest feature variance after variance-stabilizing transformation. Integration of multiple snRNA-seq datasets was performed in Seurat to enable harmonized clustering and downstream comparative analyses across conditions53,54. Anchoring cell pairs between datasets were identified by canonical correlation analysis and the mutual nearest neighbor method using the Seurat FindIntegrationAnchors function.
Spatial transcriptomics
Sections obtained from C57BL/6J (The Jackson Laboratory) mice were imaged and processed for spatially resolved gene expression using the Visium Spatial Transcriptomics Kit (10X Genomics). Samples were immediately snap-frozen in OCT using isopentane that was cooled in a liquid nitrogen bath. For cryosectioning, samples were equilibrated to −22 °C. Then 10-μm-thick short-axis sections were cut from the blocks onto Visium slides (10X Genomics) and processed according to the manufacturer’s protocol. Tissue permeabilization time was optimized at 30 min for infarcted mouse hearts. H&E images generated during the Visium protocol were captured at 20× magnification on a Nikon Eclipse Ti2-E widefield microscope and exported as tiled TIFFs for analysis. Libraries were sequenced on the Illumina NovaSeq platform and the resulting data were processed using SpaceRanger v.1.2.2 (10X Genomics).
For single-molecule FISH and sequential imaging, a panel of target genes was designed to label functionally distinct cell populations identified by single-cell/single-nucleus transcriptomic data. Primary target probes (22–96 oligonucleotides) were designed for each RNA species and the corresponding readout probes were labeled with fluorescent Atto532, Atto594 or Atto647 dyes. Samples for spatial transcriptomics were collected and flash-frozen in OCT. Ventricular short-axis cross-sections were cut on a cryostat (10 μm), mounted onto functionalized coverslips and fixed for 10 min in 4% paraformaldehyde. The sample was assembled onto a flow cell and loaded into the Rebus Esper spatial omics platform (Rebus Biosystems). The system automates sequential immunostaining and imaging of RNA spots using on-system fluidics, single-molecule FISH chemistry and synthetic aperture optical microscopy. Raw images obtained from the high-fidelity assay were reconstructed by the Rebus EsperProcess software version 1.4.1.2 to generate high-resolution images, which were then registered with immunohistochemistry staining of adjacent tissue sections.
BZ mapping strategy
Spatial transcriptomic data were integrated using the Seurat workflow, as described above (referenced to 72 h post-MI sample), and clustered (resolution = 0.8), resulting in 12 spatial clusters. We then mapped labels (RZ, BZ1, BZ2 or IZ) to spatial transcriptomic clusters using the CM-nucleus-derived gene-set scores. We first evaluated whether each spatial cluster was CM-rich (labeled RZ or BZ) versus CM-poor (labeled IZ). To classify CM-rich spatial clusters, we evaluated the gene-set scores found uniquely elevated in post-MI samples (if high, BZ; if low, RZ). Finally, for clusters labeled BZ, we evaluated BZ2 the gene-set score (if high, BZ2; if low, BZ1). The strategy is illustrated in Extended Data Fig. 4. Mapping of gene-set scores from CM-nucleus to space was performed using area under the receiver operating characteristic (AUROC) analysis. Clusters with an AUROC > 0.7 were positively classified. For IZ clusters, we performed subclustering for immune niche analyses. Zones were quantified as a fraction of the total pixels for a given sample and reported.
Neighborhood analyses and spatial correlations
After defining clusters based on CM structure, we qualitatively analyzed the colocalization of immune and stromal subsets by defining the gene signatures of major cell types (for example, macrophages), which formed distinct islands in UMAP plots. We then curated subset-specific gene lists using the FindMarkers() function (logfc.threshold = 1, min. pct = 0.25, assay = RNA) by comparing respective clusters to relevant transcriptional neighbors. Gene lists were filtered to remove genes with adjusted P values > 0.0001 and sorted by log fold change (see Supplementary Tables 1–3 for the list of DEGs). The top 10 genes of each list were then summed in the spatial assay of the integrated spatial dataset, normalized to total UMI and scaled by 10,000. Subset scores were set to zero if the respective major cell type signatures were not present (defined as gene-set scores less than 5). This analysis did not impose restrictions to the number of cells or cell types occupied in a given pixel.
We performed spatial correlation tests (Spearman rank) using R’s Giotto package. Using this package, we created a spatial network, identified genes with spatially coherent expression patterns via binary spatial extraction and clustered spatially correlated genes. This analysis was performed with all pixels from representative day 3 post-MI sample and with IZ pixels (defined by clustering) to further explore heterogeneity in this region. Correlation tests were also performed with gene-set scores to confirm colocalization patterns inferred from clustering analyses.
Spatial patterning of CM signatures
Line scans were performed by drawing a vector from RZ to IZ pixels (defined by spatial clustering analyses and Tnnt2 expression). Gene scores were reported as a function of distance from a reference line (orthogonal to line scan). Scores from pixels with similar distances were averaged.
For CM neighbor analysis, we quantified the fraction of RZ, BZ1 and BZ2 pixels in second-order neighbors (defined by clustering analyses). IZ pixels were not considered. Results were binned based on the reference pixel CM classification and reported.
For muscle fiber and gene expression analyses, due to the complex three-dimensional geometry of heart muscle fibers, we limited our analyses to the BZ created by NP injury rather than ischemia because it creates a more focal injury and to myocyte bundles on their longest extent (cut long axis) directly neighboring the site of injury. This increased the chance of analyzing bundles traveling in the same plane as the two-dimensional section. We examined the H&E-stained sections of NP injury to qualify corresponding spatial transcriptomic pixels and determine the orientation of vectors parallel and lateral to the muscle fiber. From this, we quantified BZ scores as a function of distance (0–200 μm) relative to the qualified reference pixels in both directions (parallel and lateral) and calculated an anisotropy ratio (parallel/lateral).
Pseudotime analysis
Trajectory analysis of CMs was performed using the R package Monocle v.3 with standard functions and inputs. Resolution for clustering was selected such that the resulting trajectory had no branching points. The nodes of the trajectory were selected based on cluster composition of Ctrl samples.
Motif enrichment analysis and gene ontology
Motif enrichment and GO were performed with HOMER v.4.11 using the findMotifs.pl function with the following tags: -start -400 -end 100 -len 8,10 -p 4. We used the FindMarkers function (adjusted P < 0.001; log fold change threshold > 0.25) in the R package Seurat to define DEGs between nearest CM clusters for inputs into motif enrichment and GO analyses.
Segmentation, classification and quantification of FISH images
Image analyses were performed using ImageJ (Fiji, version 2.1.0/1.53c) or MATLAB 2020a. After FISH imaging, sections were immediately stained with WGA (as described above) to define CM perimeters and create ROIs for subsequent quantification (Extended Data Fig. 5a,b). WGA and FISH images were tiled using imtile and registered using cpselect, fitgeotrans and imwrap to create large, full-section, aligned images. ROIs were then classified as RZ, BZ1 or BZ2 based on the percentage of Tnnt2, Ankrd1+Nppa and Xirp2+Flnc-positive pixels as shown in Extended Data Fig. 5c. To quantify neighborhood composition, we counted ROIs with centroids within an approximate 100-μm radius of each CM of each classification (Extended Data Fig. 5b). We used Tnnt2 values to define the IZ border and hand-measured the minimum distance to each CM using the pdist function in MATLAB (Extended Data Fig. 5d). To quantify contact with neighboring CMs, we created ROI perimeters with various thickness (4, 8, 12, 16 μm) and calculated the percentage of Tnnt2 pixels (Extended Data Fig. 5d). The thickness of BZ1/2 was quantified by hand-measuring contiguous regions of respective CMs using the pdist function in MATLAB (Extended Data Fig. 5f).
Human tissue collection
The study was approved by the UCSD Medical Center institutional review board (no. 181206) and written informed consent was obtained from the patient before LV assist device implantation surgery. The LV apical core biopsy was collected at the time of LV assist device implantation and flash-frozen in liquid nitrogen within 10 min of explantation and stored at −80 °C until spatial transcriptomic processing.
Statistics
Statistical analysis was performed using Prism 9 (GraphPad Software). All data are represented as mean values ± s.e.m. unless indicated otherwise. Unpaired Mann–Whitney U-tests, Wilcoxon rank-sum tests, Spearman correlation or one-way analysis of variance with Tukey’s post-hoc analysis to determine statistical significance. P < 0.05 was considered significant. P values are indicated as follows: *P < 0.05, **P < 0.01, ***P < 0.001, ****P < 0.0001. To account for multiple hypotheses testing, P values derived by Seurat during differential gene expression analysis were false discovery rate-adjusted.
Extended Data
Extended Data Fig. 1 |. Integration of single cell and nuclei RNA-seq heart datasets during acute responses to MI.
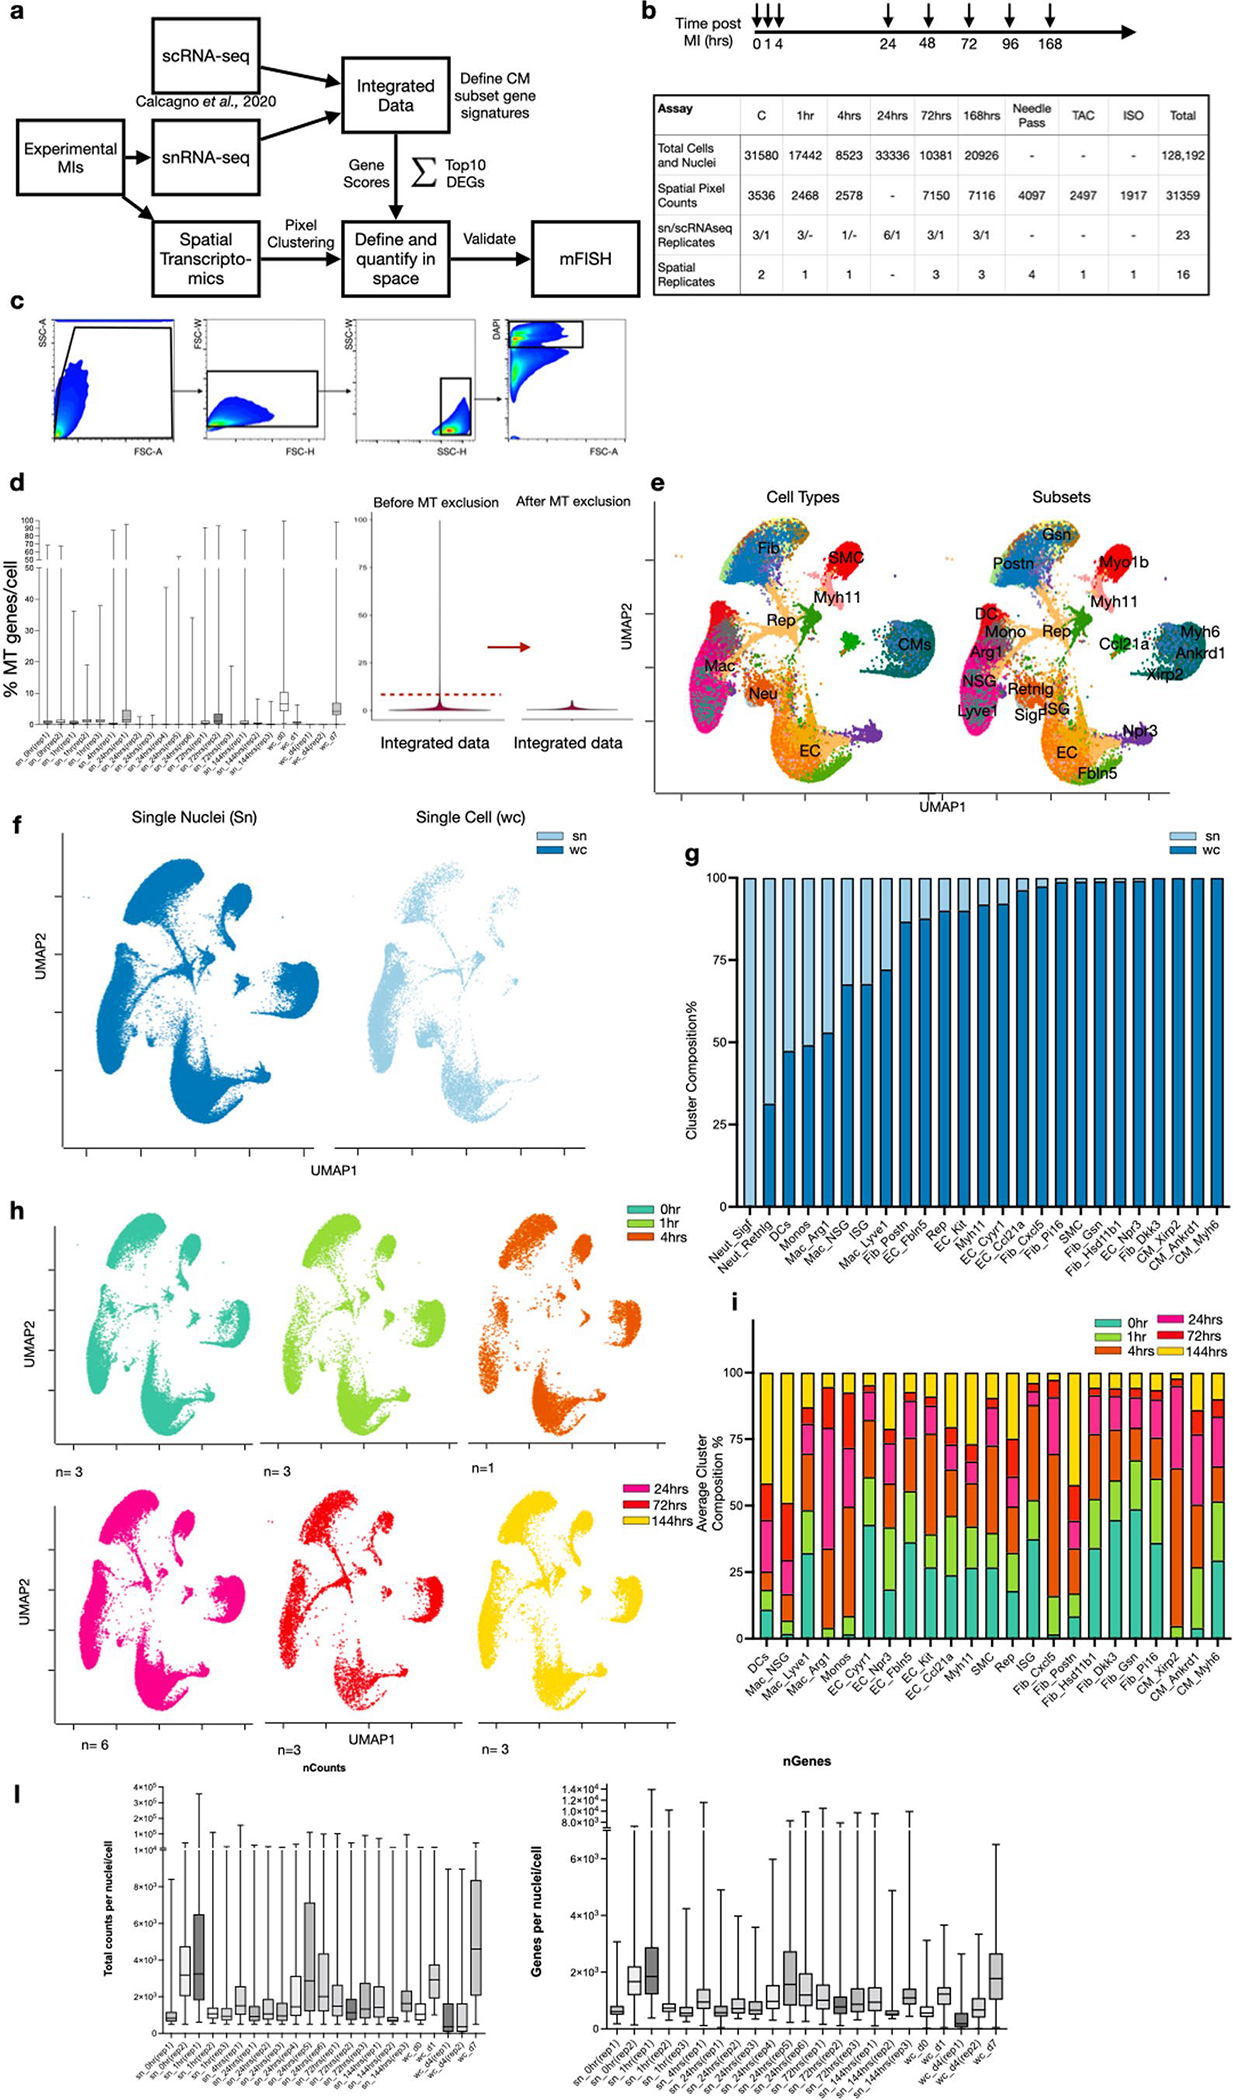
(a) Overall experimental design and integration of sc/snRNA-seq data with whole transcriptome spatial data. Hearts were harvested at several time points following experimental MI and collected for snRNA-seq. The resulting data matrices were integrated with available scRNA-seq data. (b) Experimental timepoints post-MI that were examined in our study with a summary table of total numbers of cells, nuclei and spatial pixels analyzed to support the robustness of our claims across biological replicates. (c) Gating strategy to isolate nuclei using DAPI and FACS. (d) Mitochondrial QC metrics of samples and replicates for both single nuclei, single cell and integrated sn/sc data. (e) UMAP plots annotated by major cell types (left) and subsets (right) after removing nuclei and cells that have more than 5% mitochondrial counts. (f) UMAP plots displaying composition of single nuclei (left) and single cell (right) derived samples. (g) Subcluster composition as derived from UMAPs shown in (f). (h) UMAP plots split by timepoint and across biological replicates. (i) Average subcluster composition displayed in (h). (l) QC metric of samples and replicates for both single nuclei and single cell represented in counts per sample (nCounts) and features per sample (nGenes).
Extended Data Fig. 2 |. Integration and quantification of spatial transcriptomic datasets.
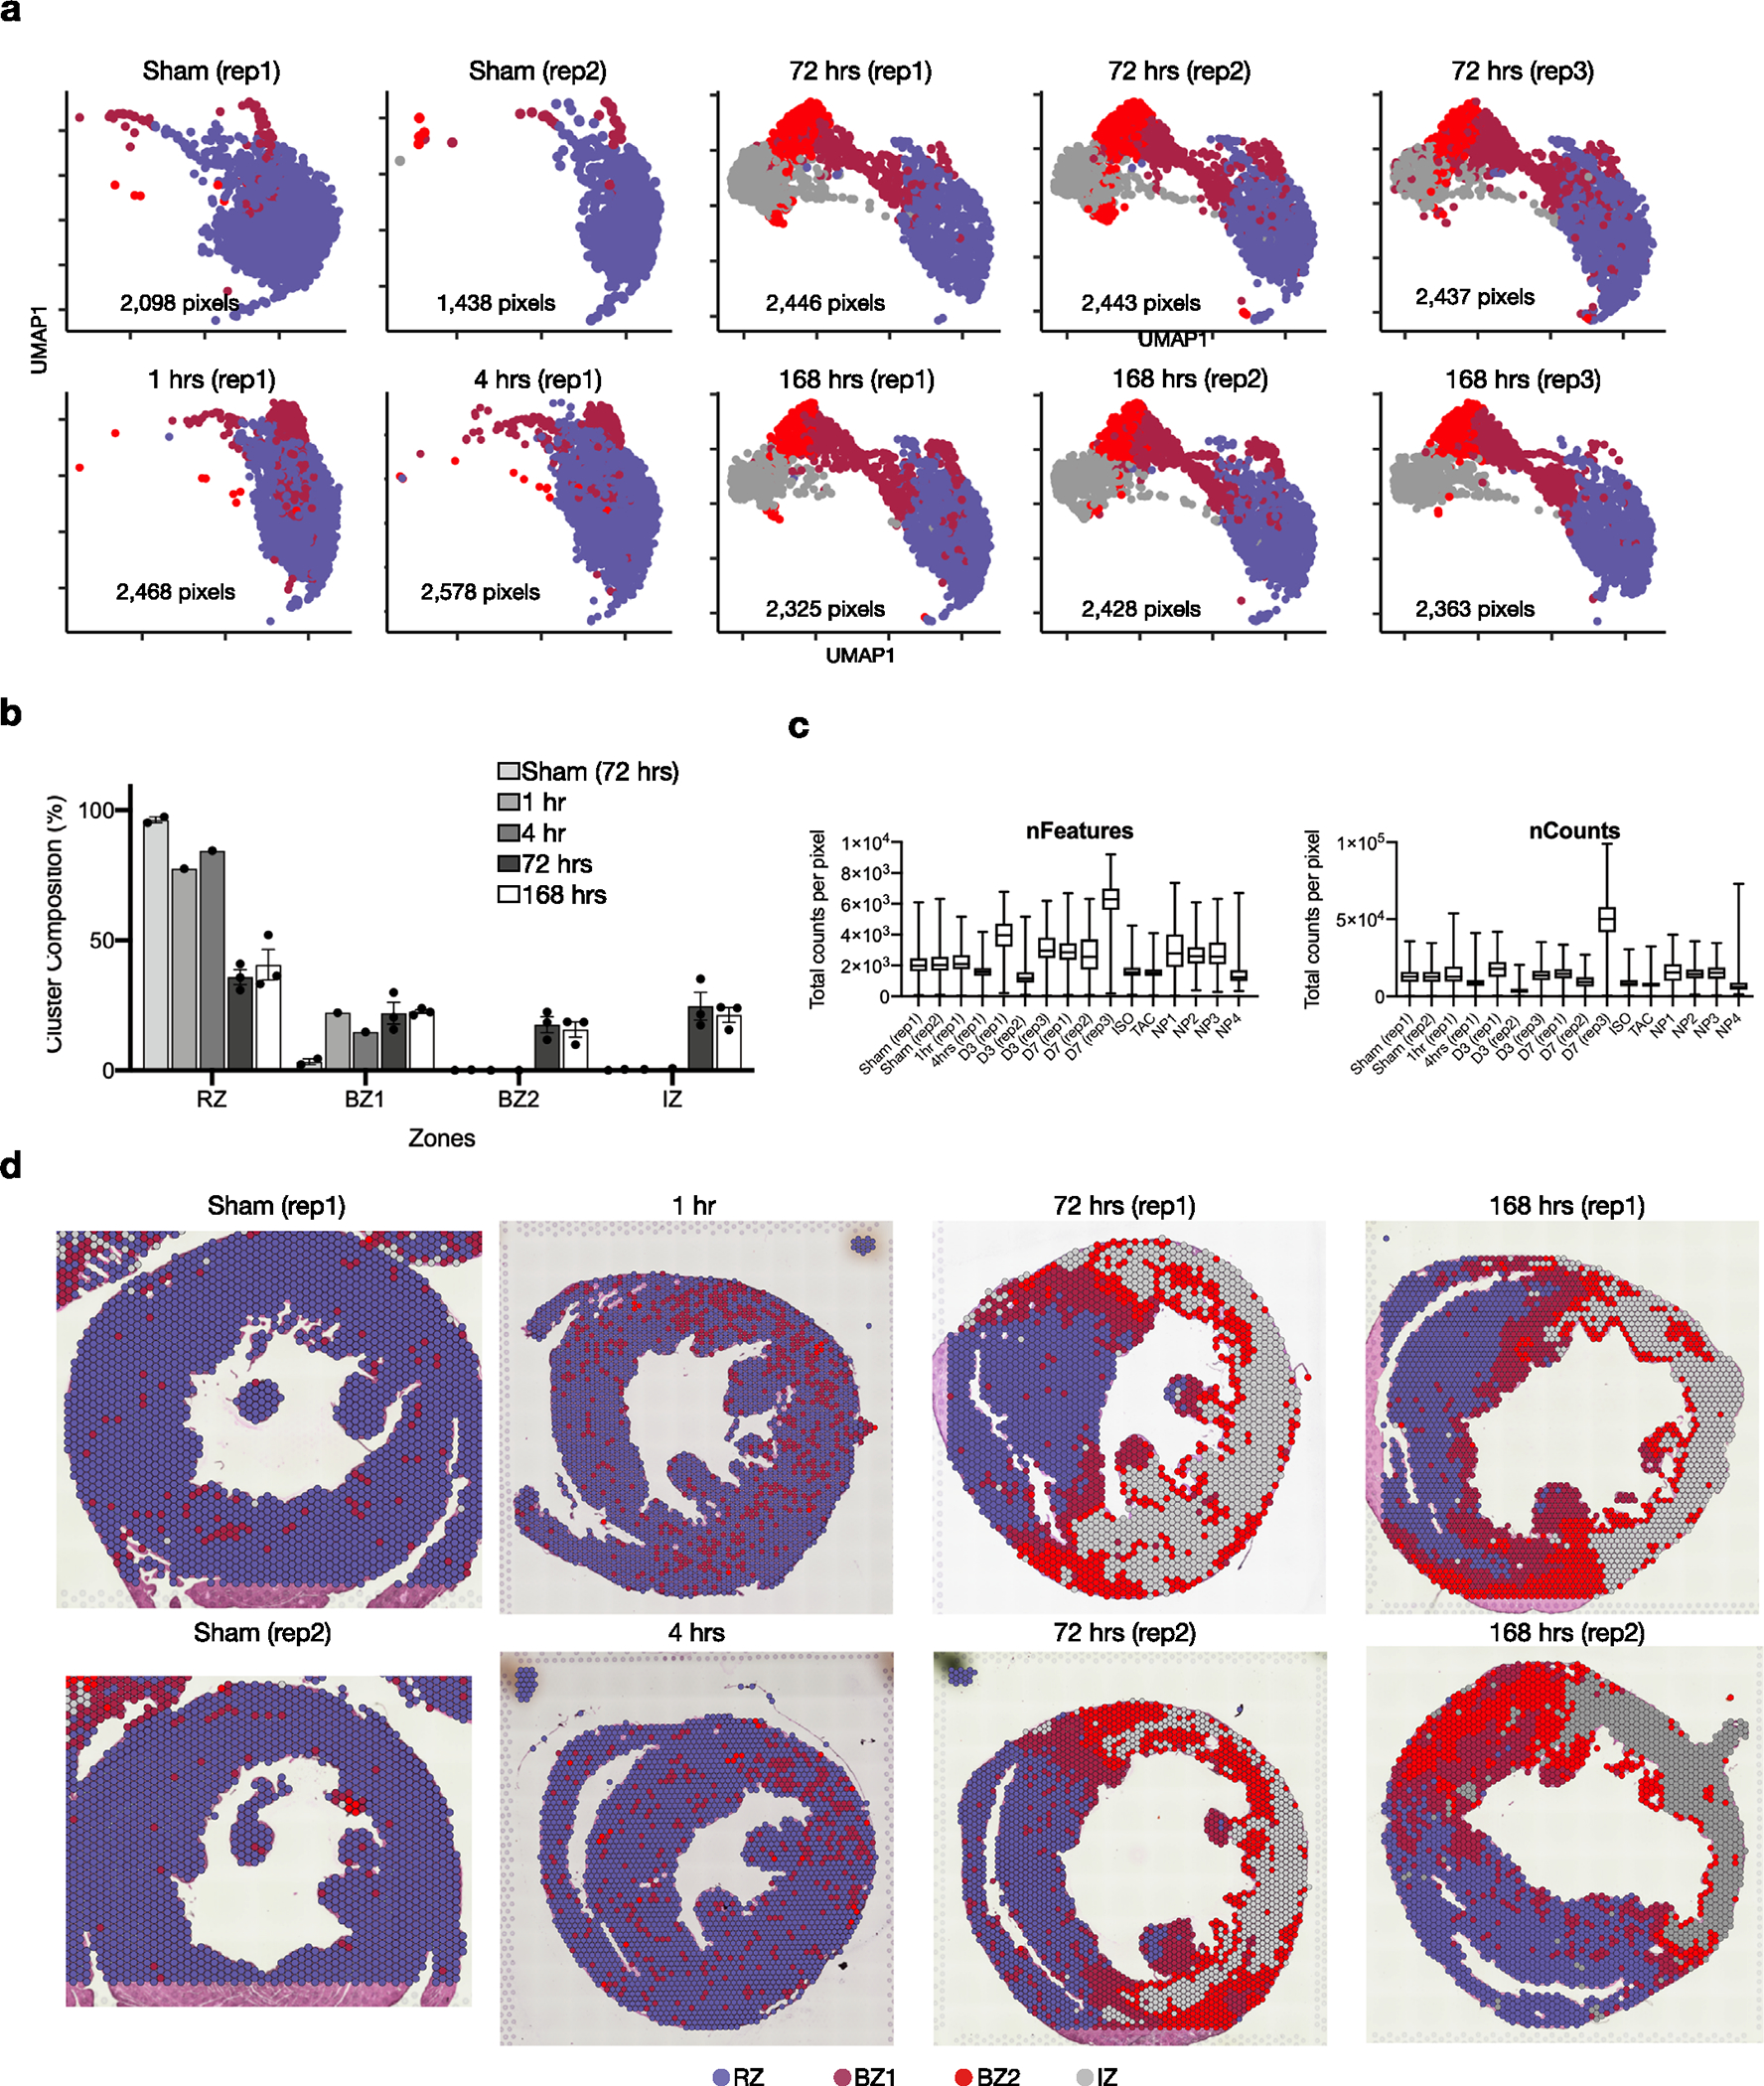
(a) UMAP plots split by sample. (b) Quantification of cluster classification as a percentage of total pixels captured by sample (data presented as mean values ± SEM; n = 2, sham; n = 1, 1 hr and 4hrs; n = 3, 72 hrs and 168hrs post-MI). (c) Quality control metrics, split by sample. (d) Spatial plot showing results of clustering across different time points after MI and replicates.
Extended Data Fig. 3 |. High resolution clustering of CMs at 24 hrs and 72 hrs post-MI.
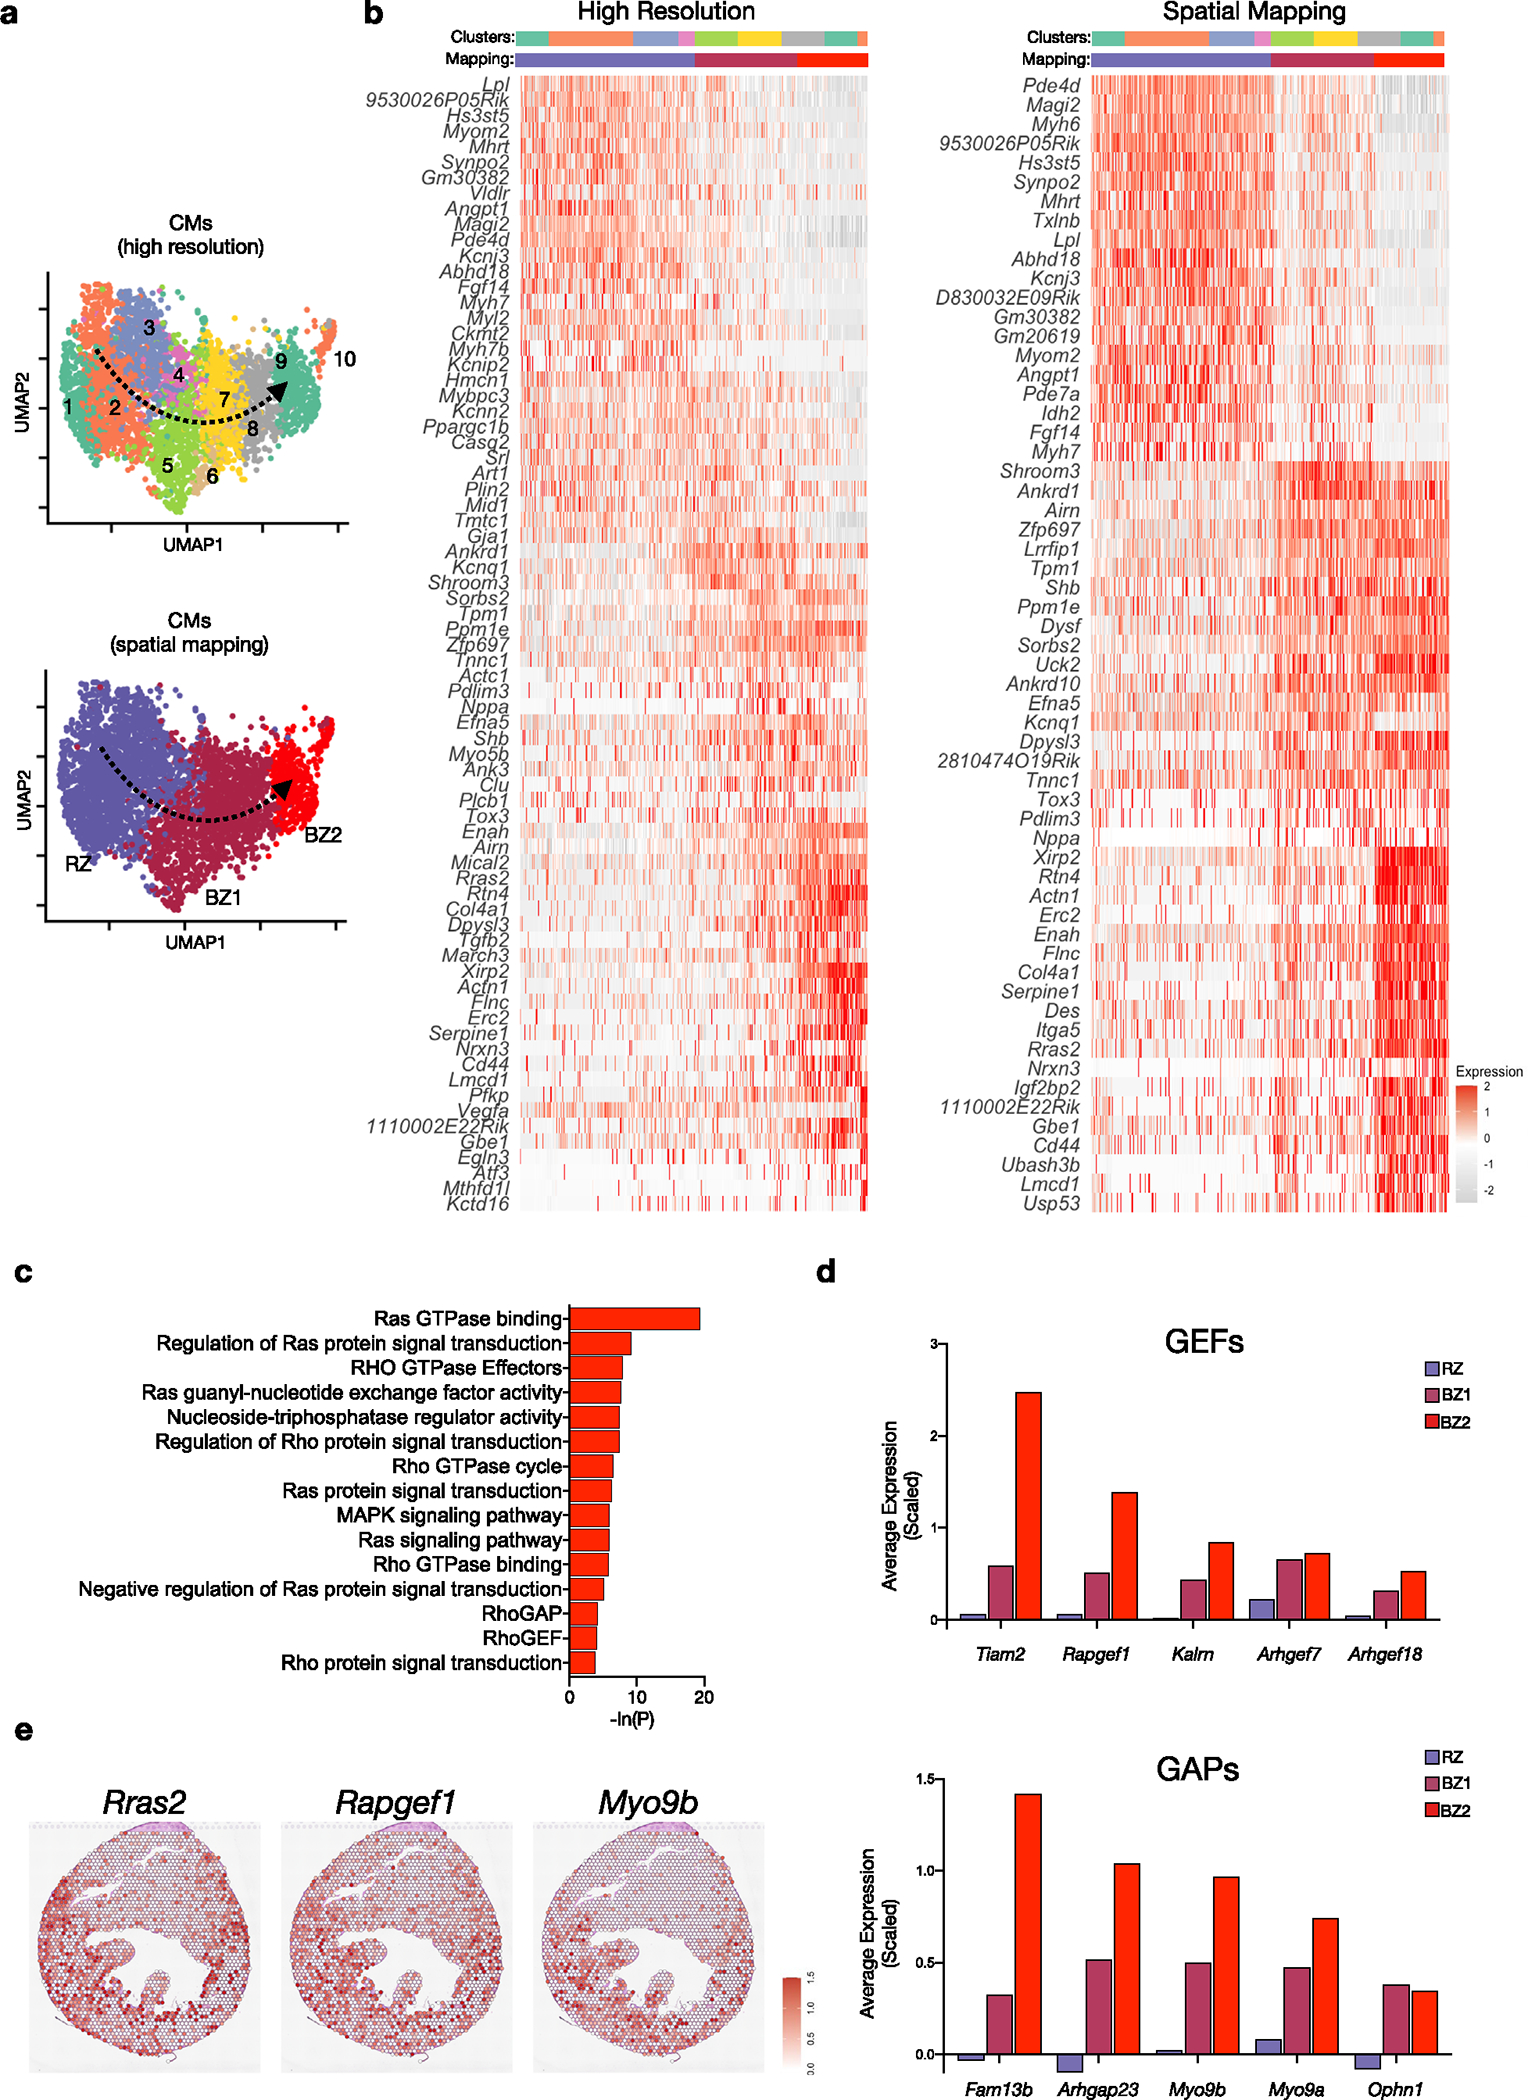
(a) UMAP plots of subset and reclustered CMs as shown in Fig. 1b with higher resolution (top) and annotated based on spatial mapping (bottom). (b) Heatmap of resulting DEGs based on resolution. (f) Heatmap of DEGs based on spatial mapping. (c) Select gene ontology terms enriched in BZ2 CMs related to Ras/Rho signaling. (d) Average scaled expression of guanine nucleotide exchange factors (GEFs) and GTPase activating proteins (GAPs) in CM subsets. (e) Spatial feature plots of representative Ras/Rho related genes showing distribution in BZ.
Extended Data Fig. 4 |. Mapping of snRNA-seq derived CM subsets to space.
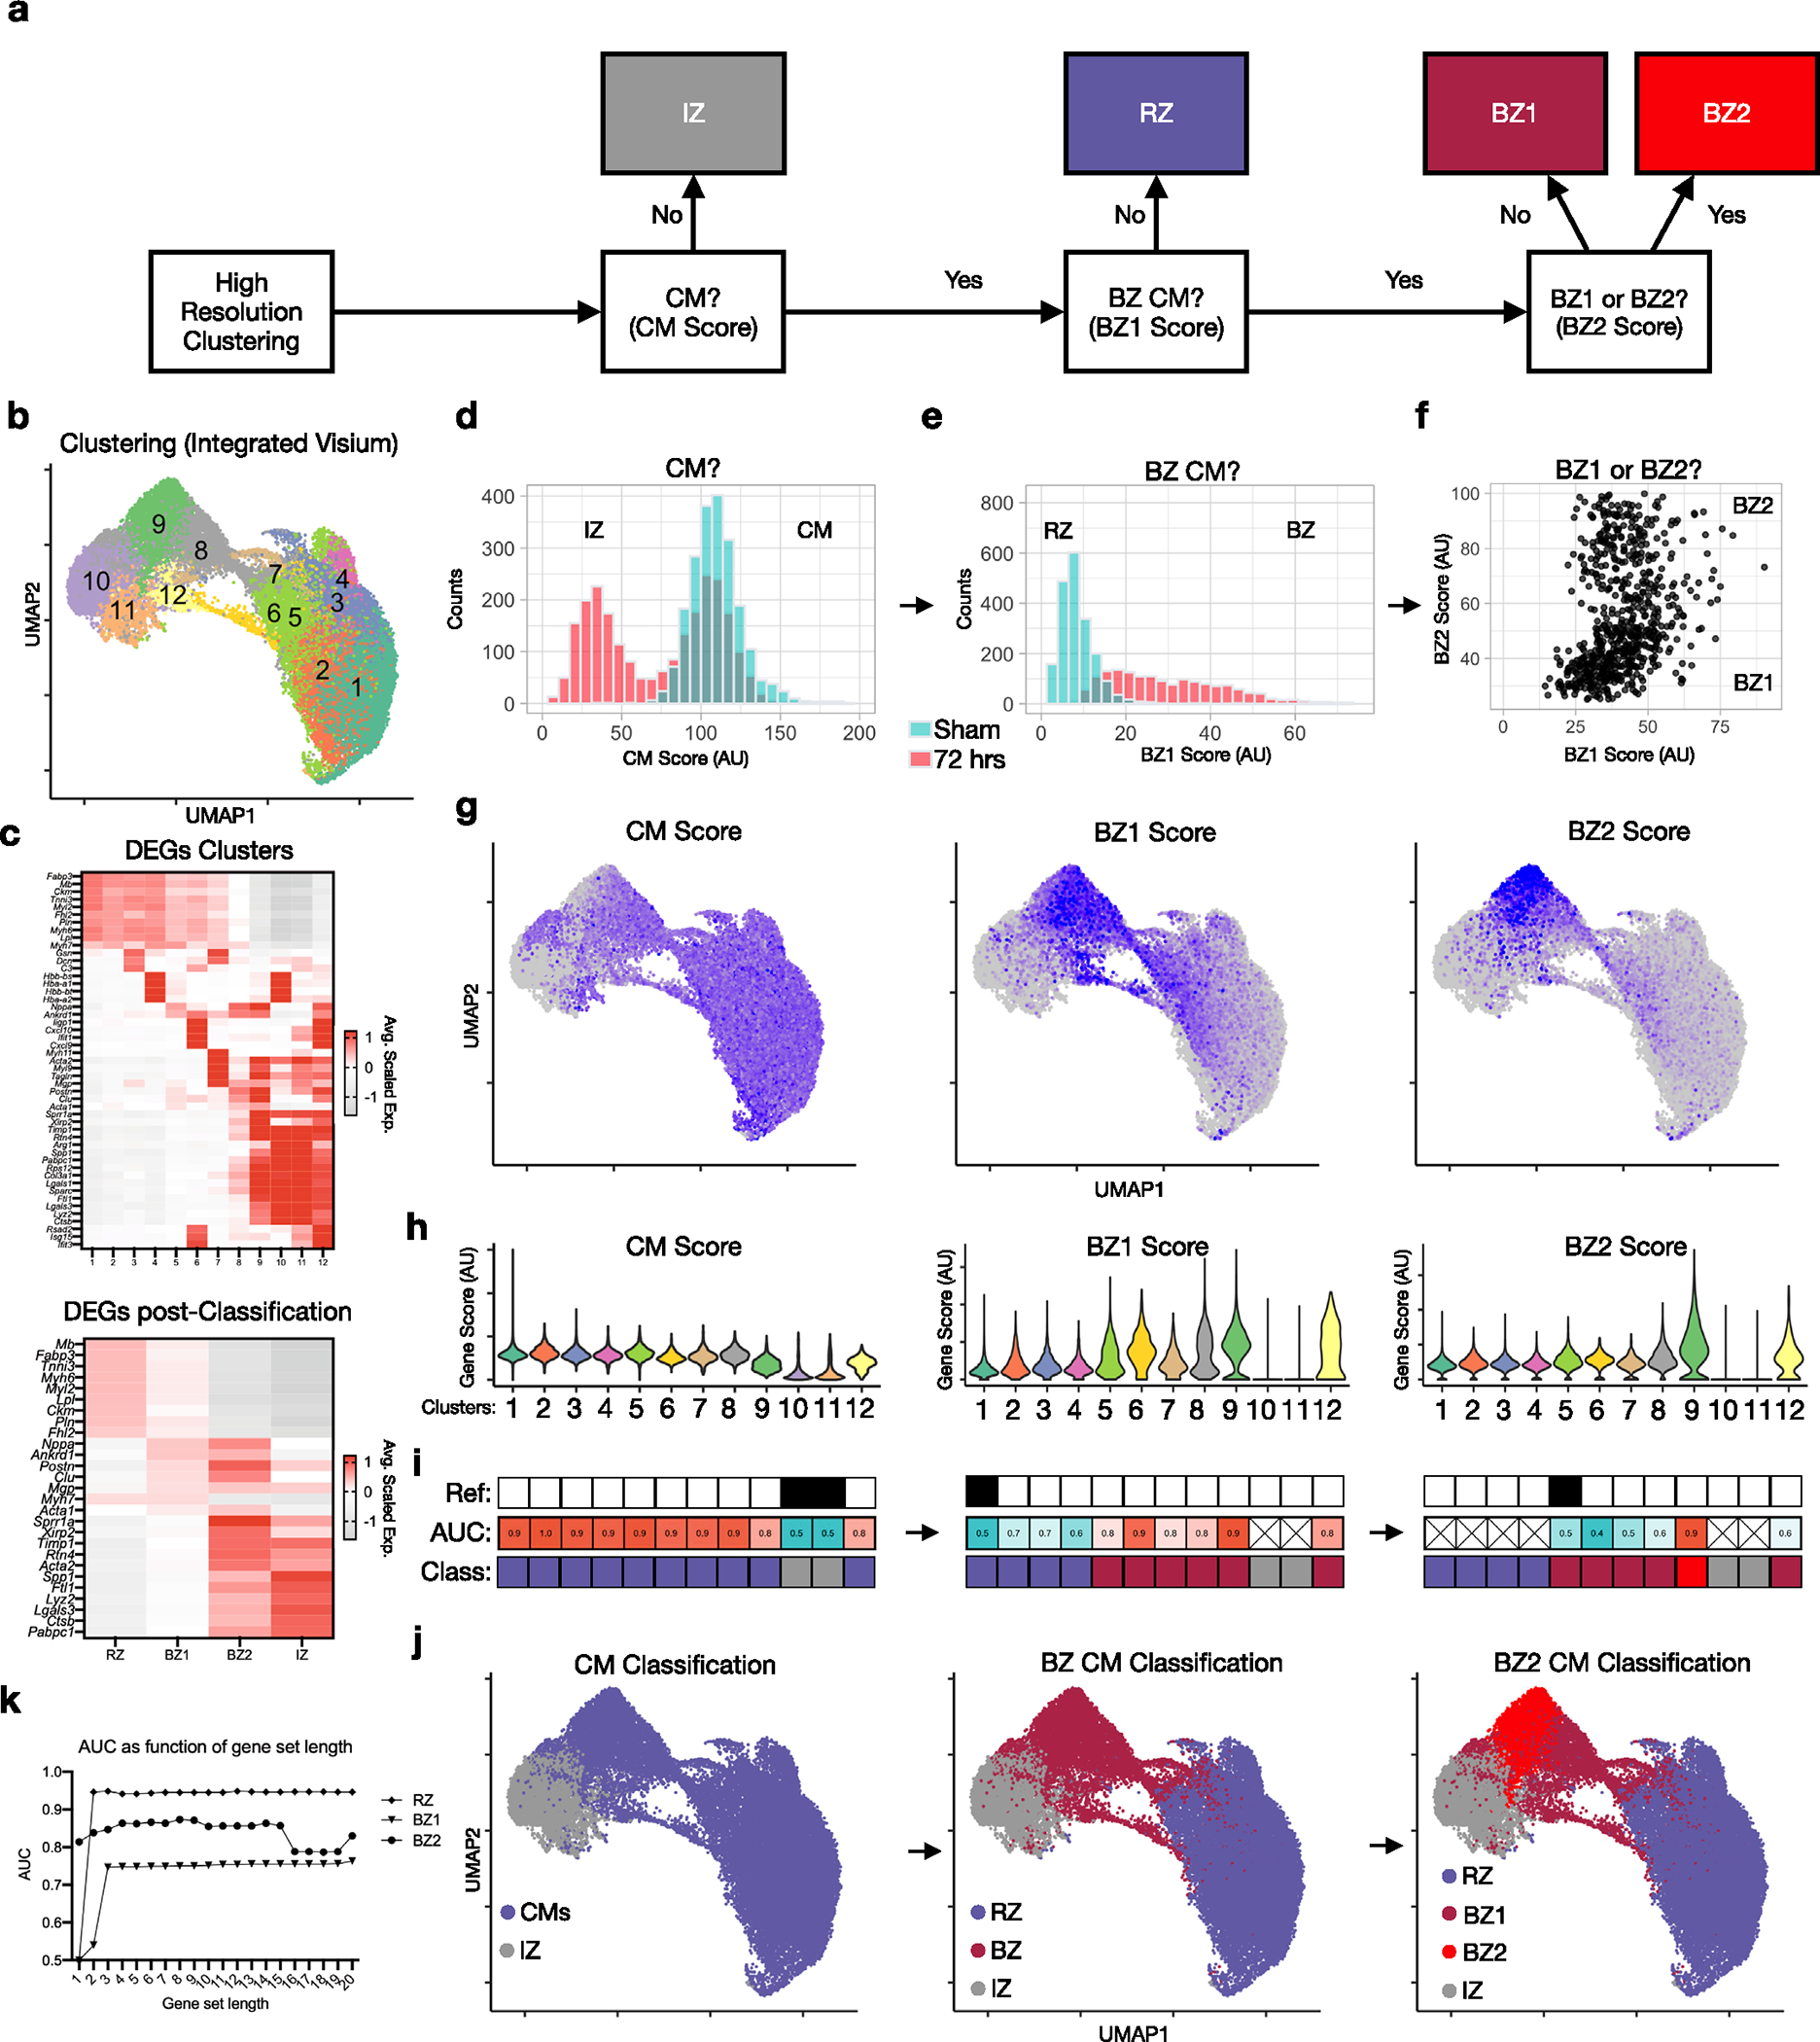
(a) Strategy for mapping labels (IZ, RZ, BZ1 and BZ2) from CM nuclei to spatial clusters (see methods). (b) UMAP plot of integrated dataset composed of 34,116 pixels in 16 samples (summarized in Extended Data Fig. 1b, see Extended Data fig. 8). (c) DEGs based on high-resolution clustering (top) and post-classification regions (bottom). (d) Histogram of counts from representative samples (green, sham; red, 72 hrs post-MI). (e) Histogram of BZ1 scores. (f) Dot plot of BZ1 and BZ2 scores. (g,h) Feature plots (g) and violin plots (h) of CM, BZ1 and BZ2 scores. (i) Results of ROC analysis (AUC, area under the curve) and stepwise label-mapping (reference cluster indicated above). (j) Classification results shown in UMAP space. (k) AUC as a function of gene-set length.
Extended Data Fig. 5 |. Spatial transcriptomics of human STEMI tissue.
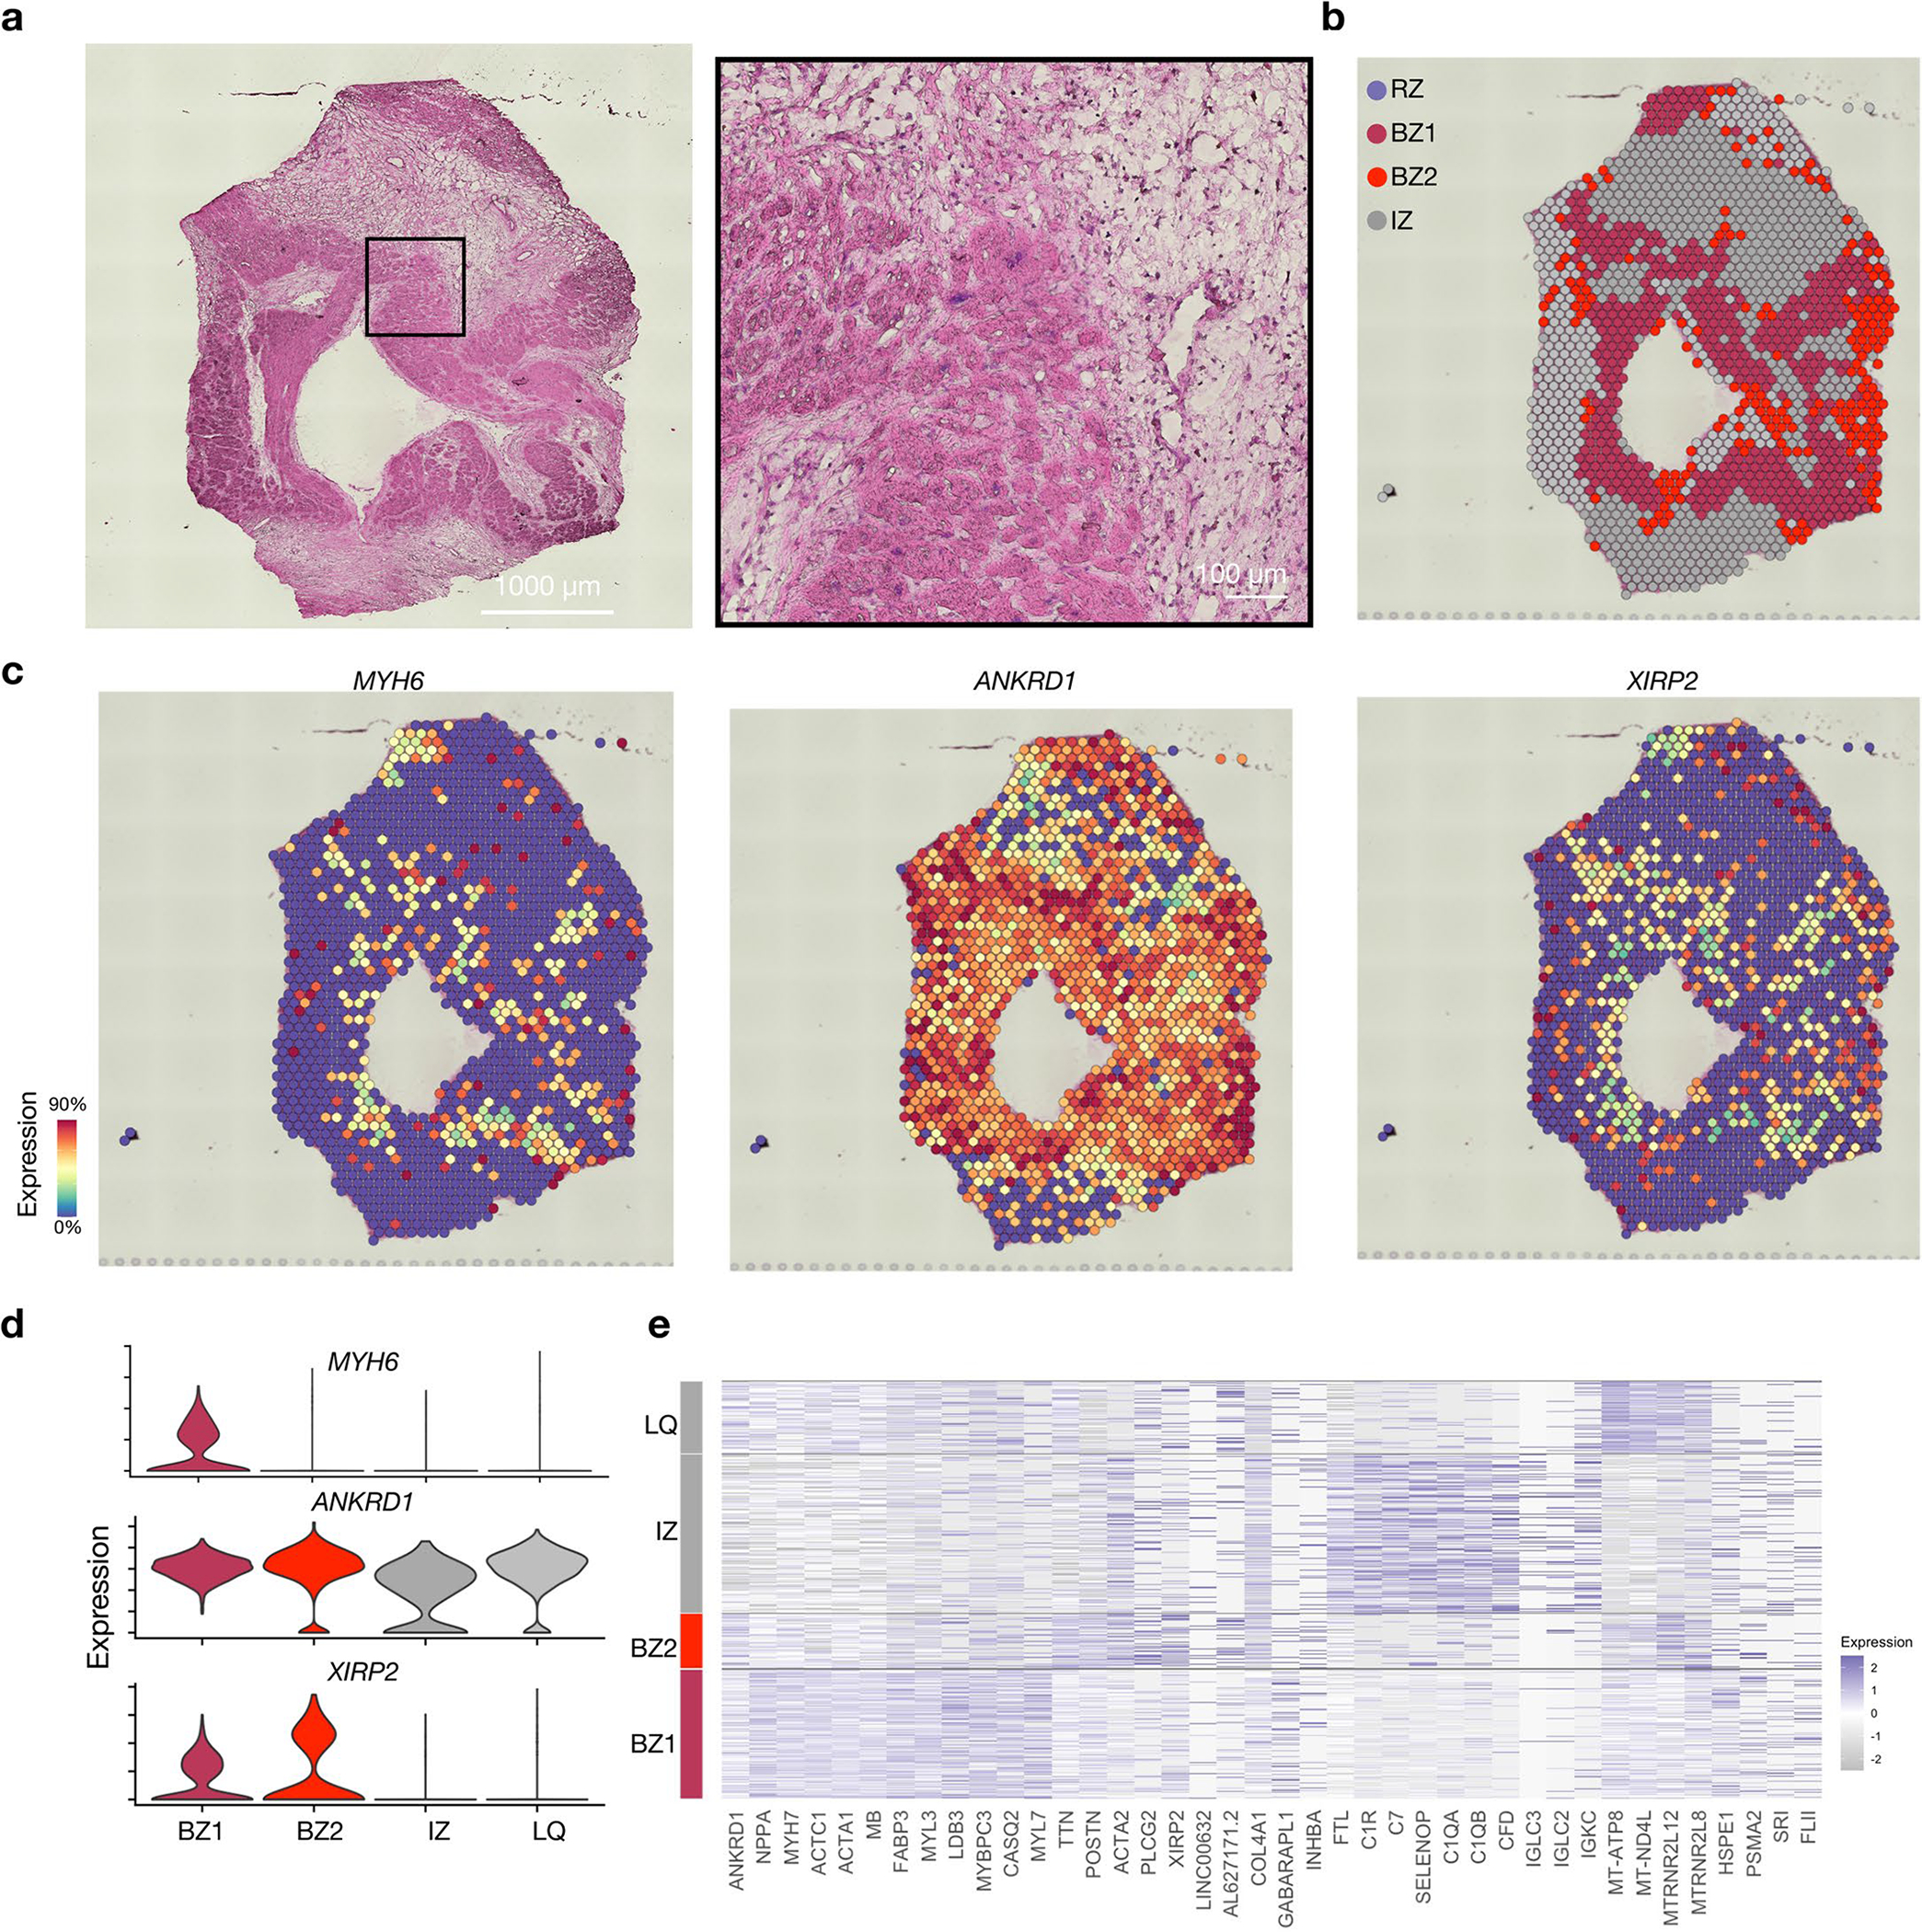
(a) H&E of cross section of a single human heart sample from a patient presenting with anterior wall STEMI. (b) Spatial transcriptomic clustering results based on DEG analysis and assessment of BZ marker genes shown in space in (c) and by violin plots in (d). (e) Heatmap of cluster defining DEGs. LQ, low quality.
Extended Data Fig. 6 |. Segmentation, classification and quantification of mFISH data.
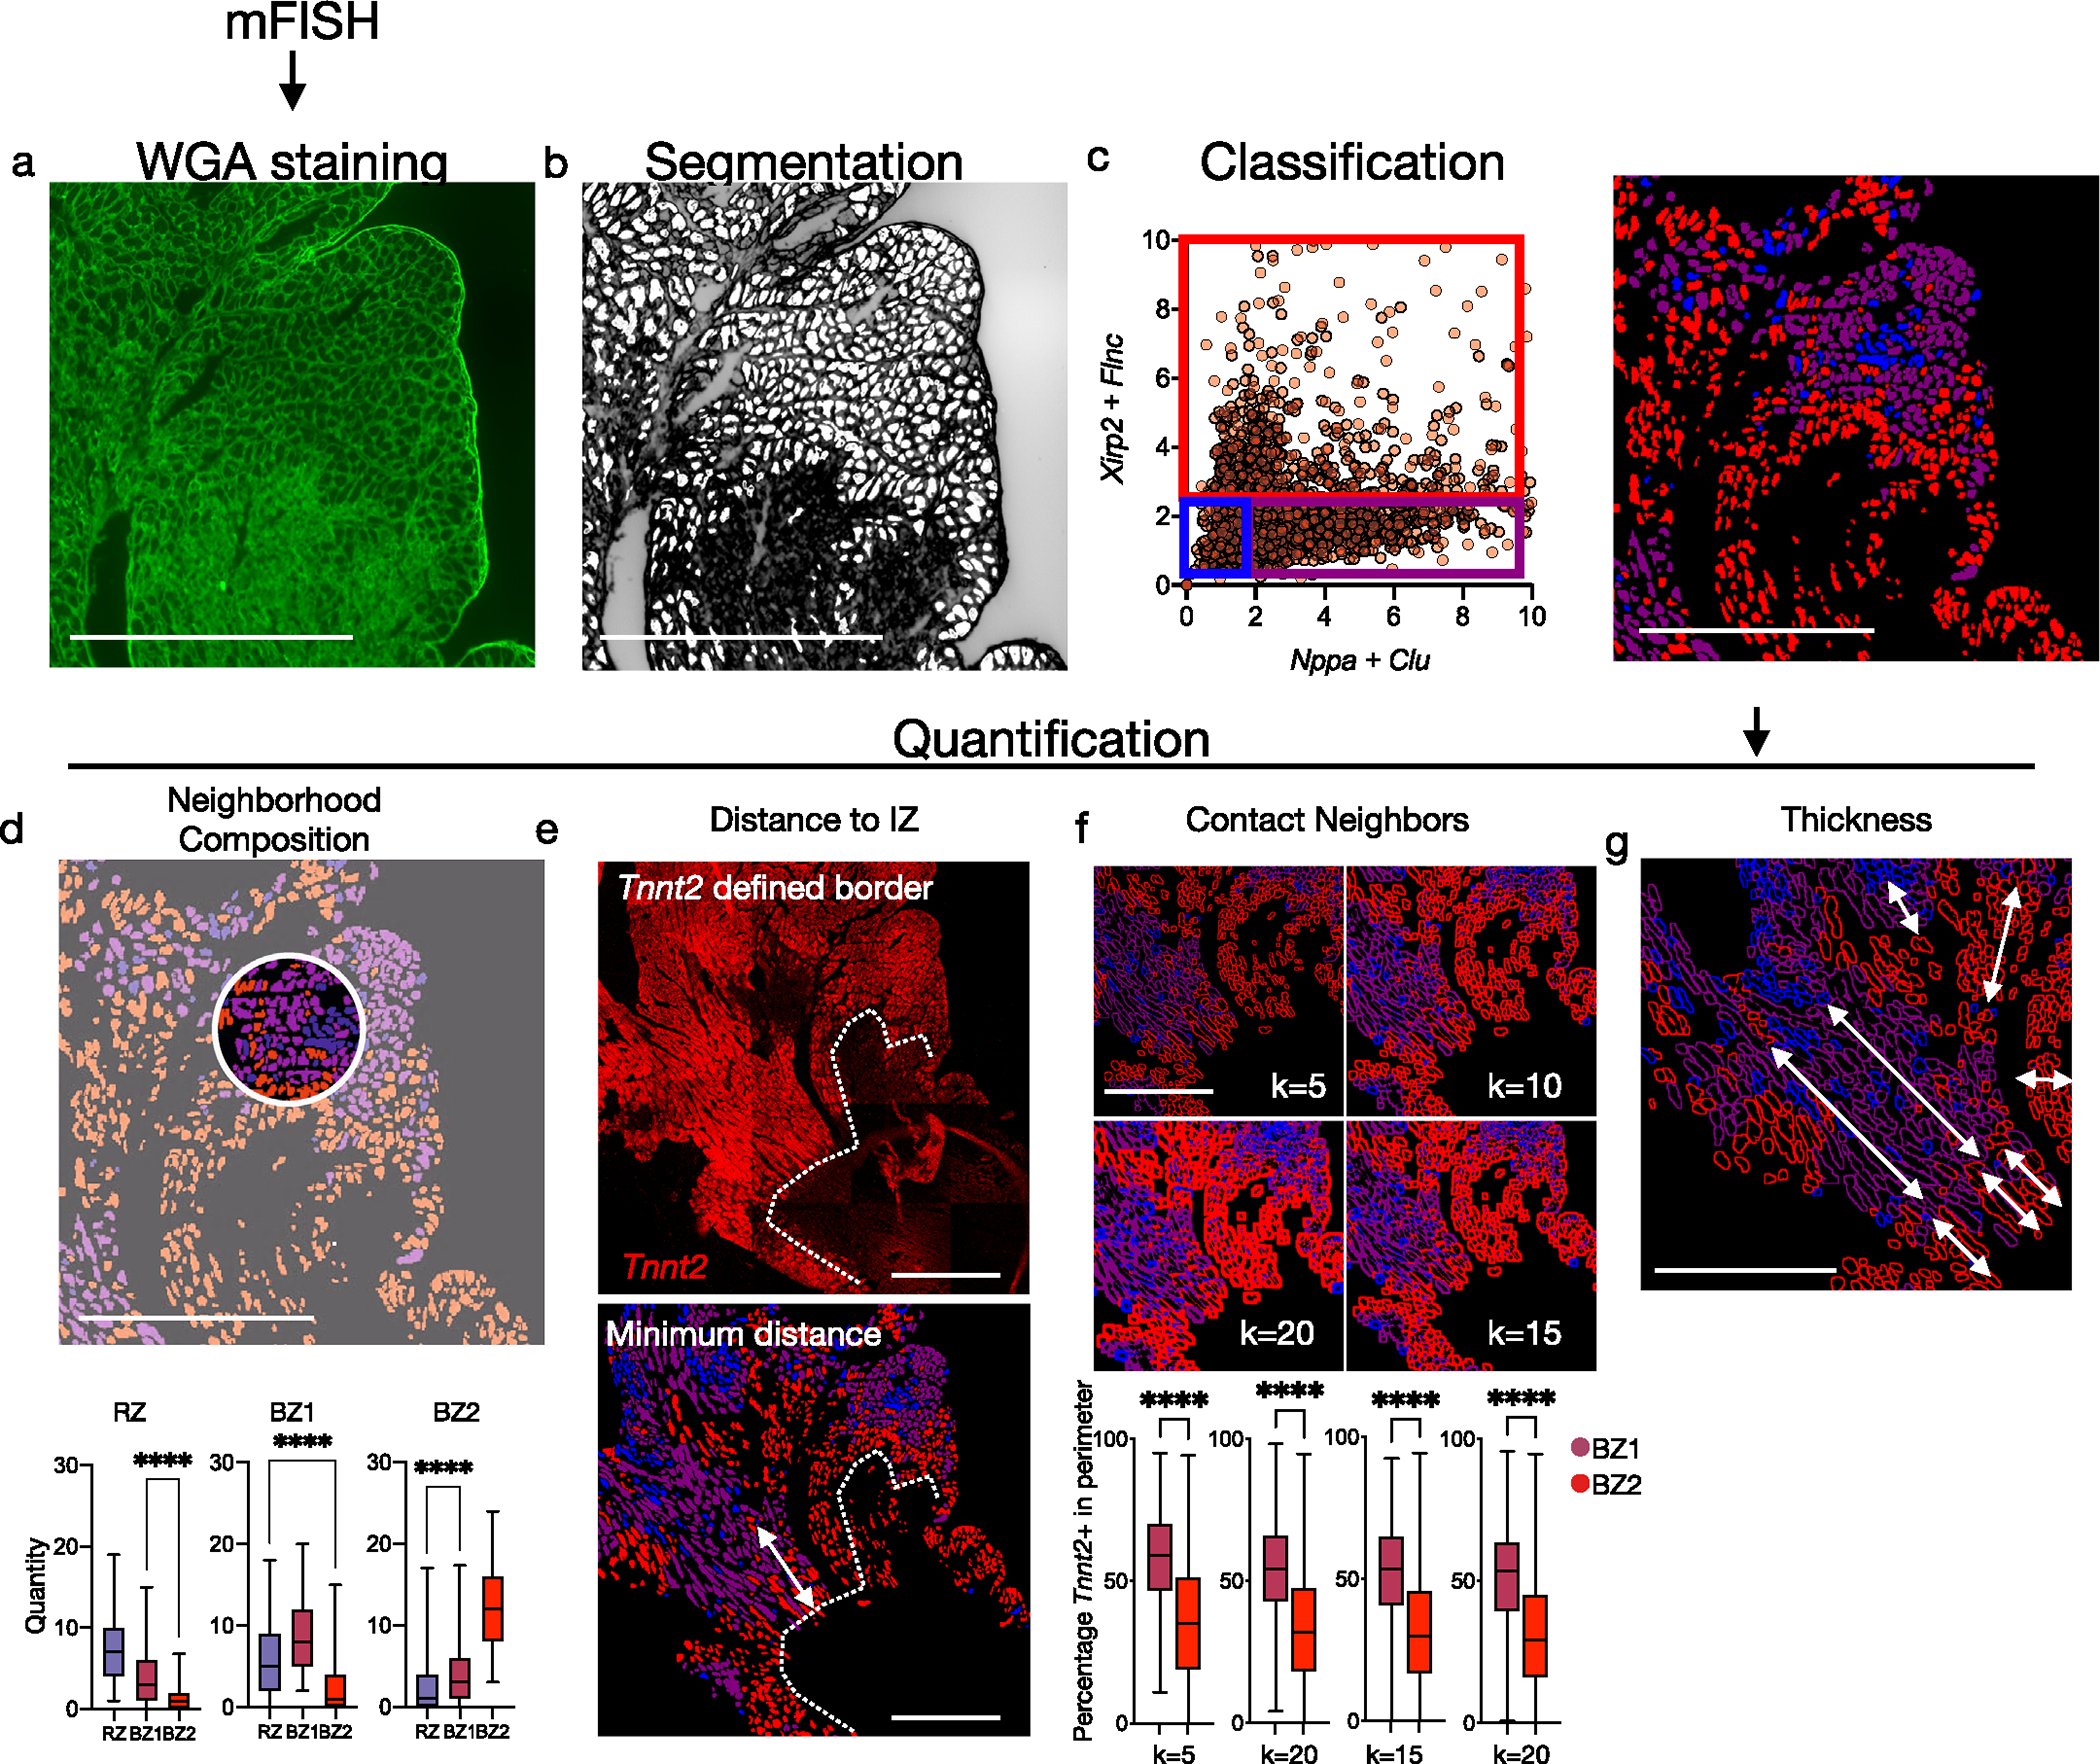
(a) After mFISH imaging, slides were stained for WGA to label the CM membrane. (b) Areas with well-defined perimeters were converted to regions-of-interest (shown in white). (c) Expression of BZ1 markers (Nppa, Clu) and BZ2 markers (Xirp2, Flnc) across ROIs. Scatter plot was visually inspected to establish thresholds and classify ROIs as RZ, BZ1, or BZ2 (blue, purple, red). (d) Quantification of neighbor composition in 25-pixel radius (n = 625 cells, and 1008 cells examined over 1 sample for BZ1 and BZ2, respectively). (e) Quantification of minimum distance to the IZ border defined by Tnnt2 staining. (f) To quantify direct contact of CMs, the percentage of Tnnt2 + pixels were calculated in ROI perimeters with various degrees of thickness (n = 625 cells, and 1008 cells examined over 1 sample for BZ1 and BZ2, respectively). (g) Contiguous regions of respective CM subsets were measured. Images shown are representative of 2 separate experiments. Scale bars indicate 500 μm. Boxplots presented with mean; box: 25th-75th%; whiskers: 2.5th-97.5th %. **** P-value < .0001; Mann-Whitney Test, two-sided.
Extended Data Fig. 7 |. Colocalization of immune and fibroblast subsets across time.
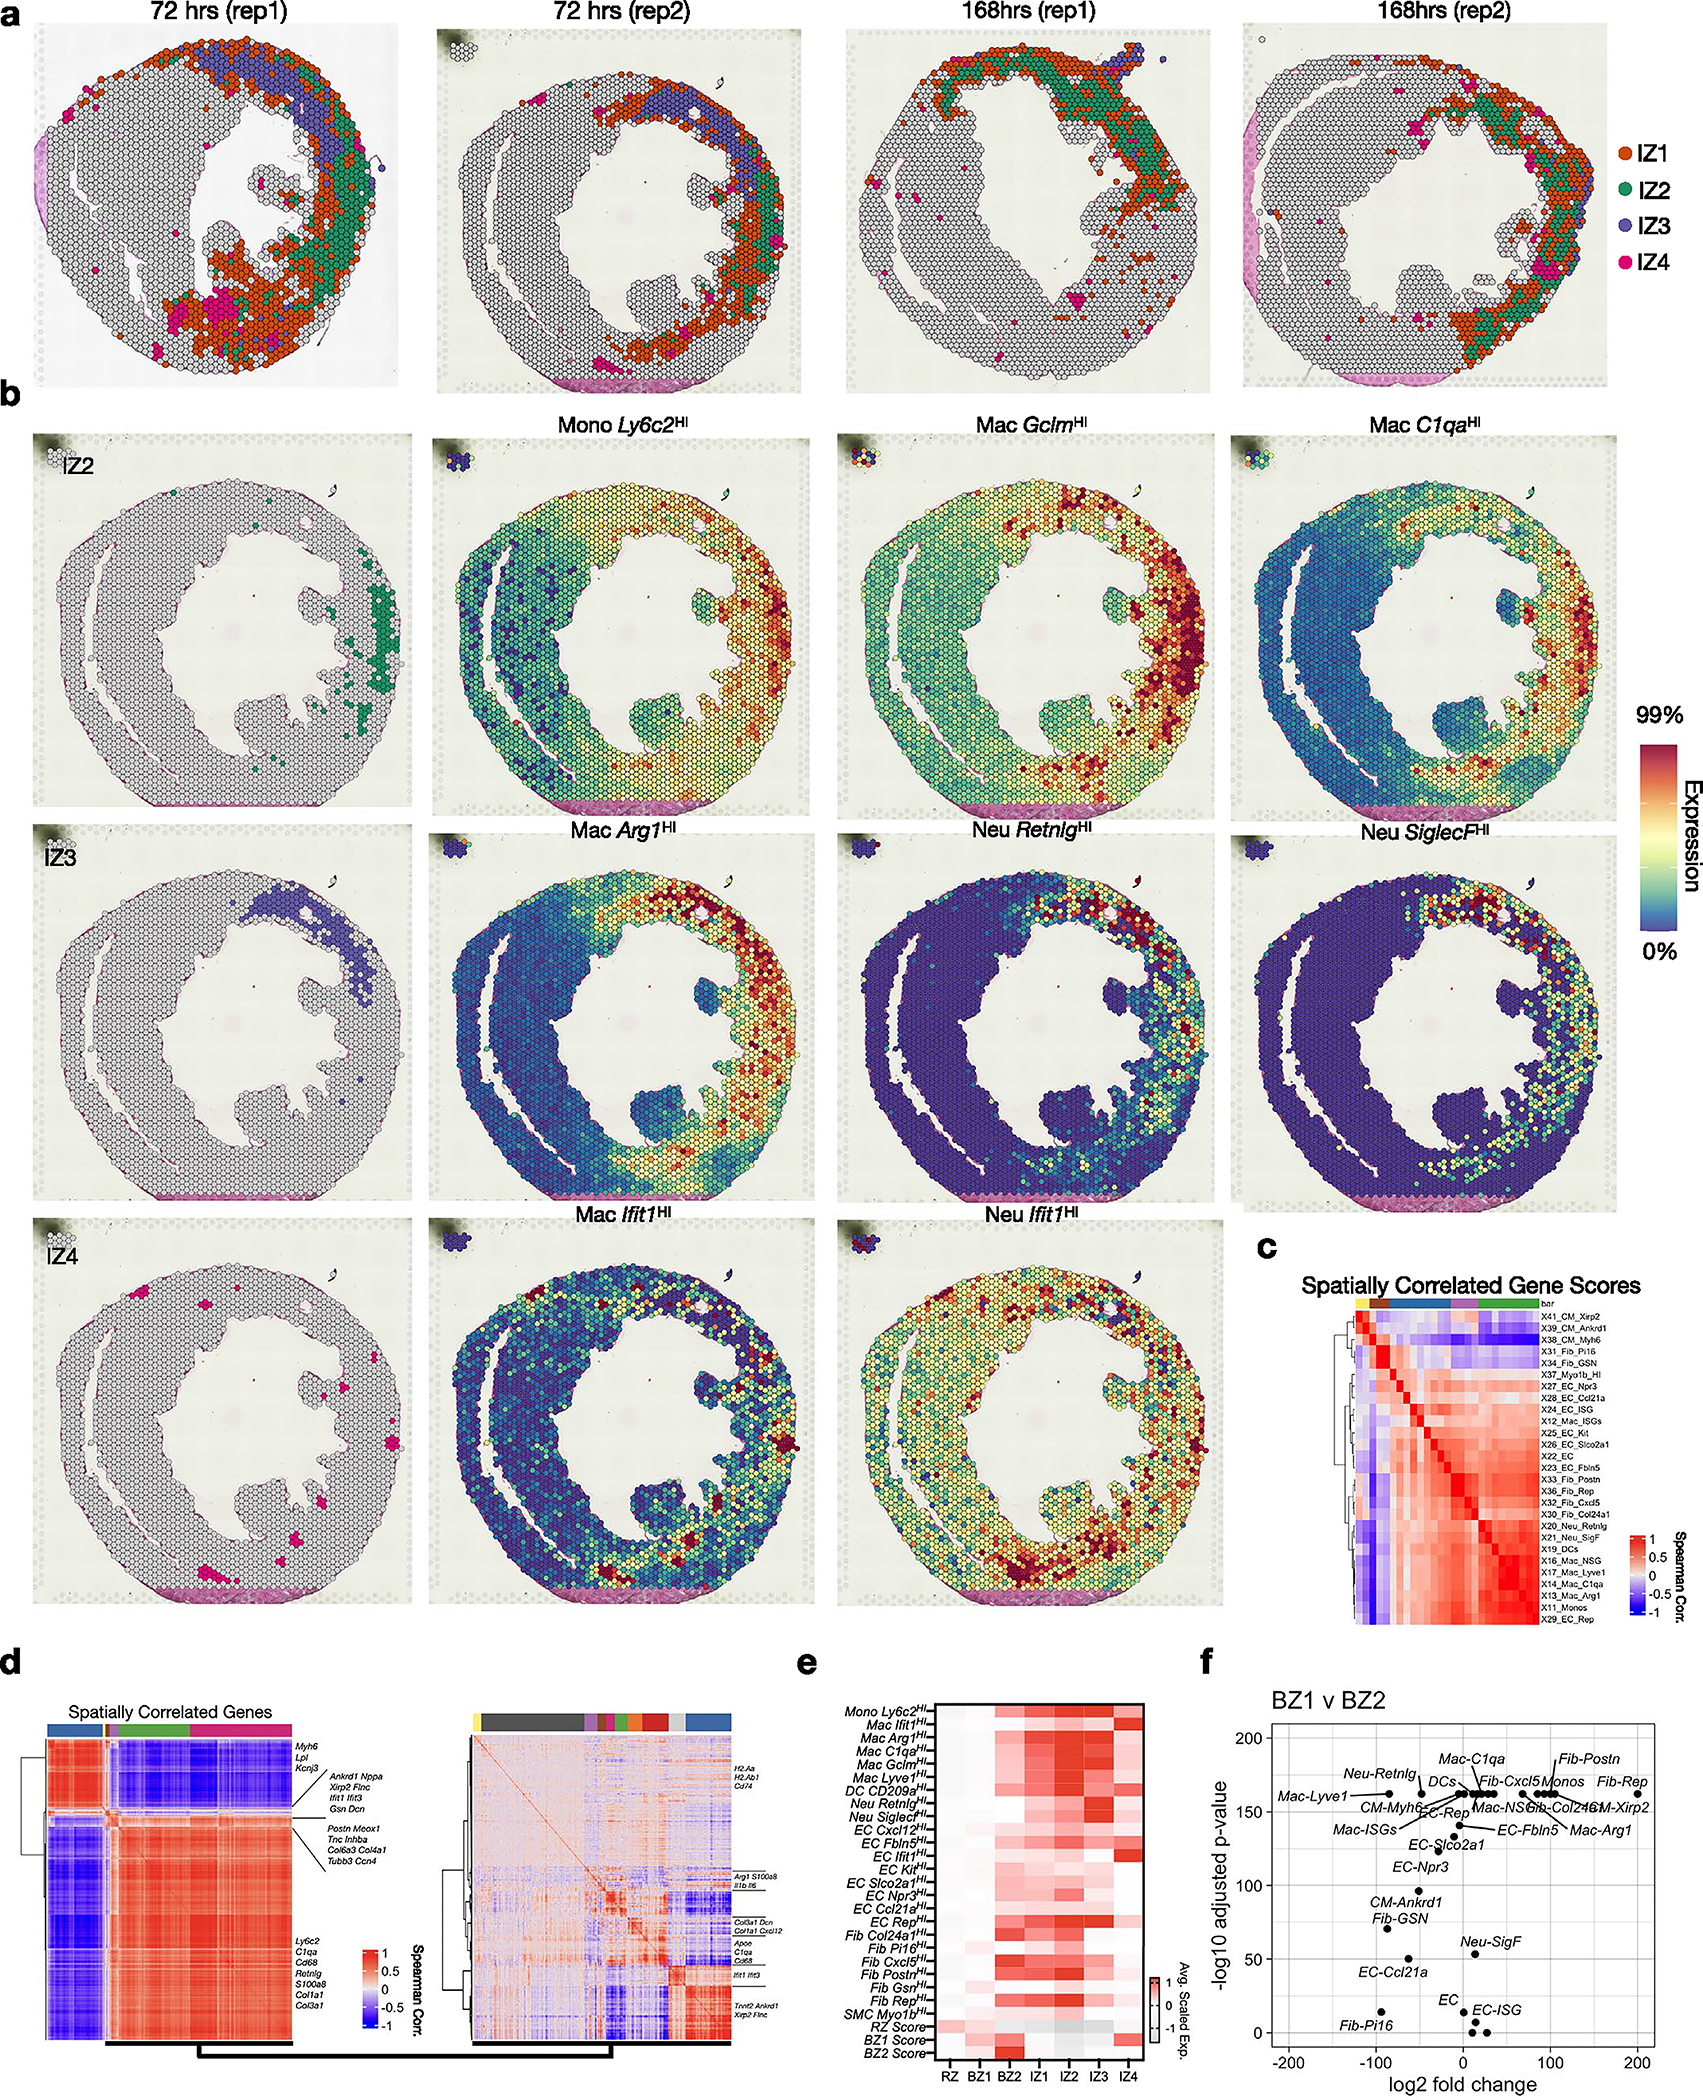
(a) Spatial plots showing subclustering results (shown in 3c) across 72 hrs post-MI and 168 hrs post-MI replicates. (b) Colocalized immune subsets in 72 hrs post-MI replicate. (c) Spatially correlated and clustered gene-set scores. (d) Spatially correlated and clustered genes based on spearman rank correlation analysis for all regions (left) and infarct zone (right) of 72 hrs post-MI sample. (e) All gene-set scores projected to clusters. (f) Volcano plot comparing gene-set scores in BZ1 and BZ2 (Wilcoxon Ranked Sum Test, two-sided).
Extended Data Fig. 8 |. Spatial transcriptomics on mechanical injury models.
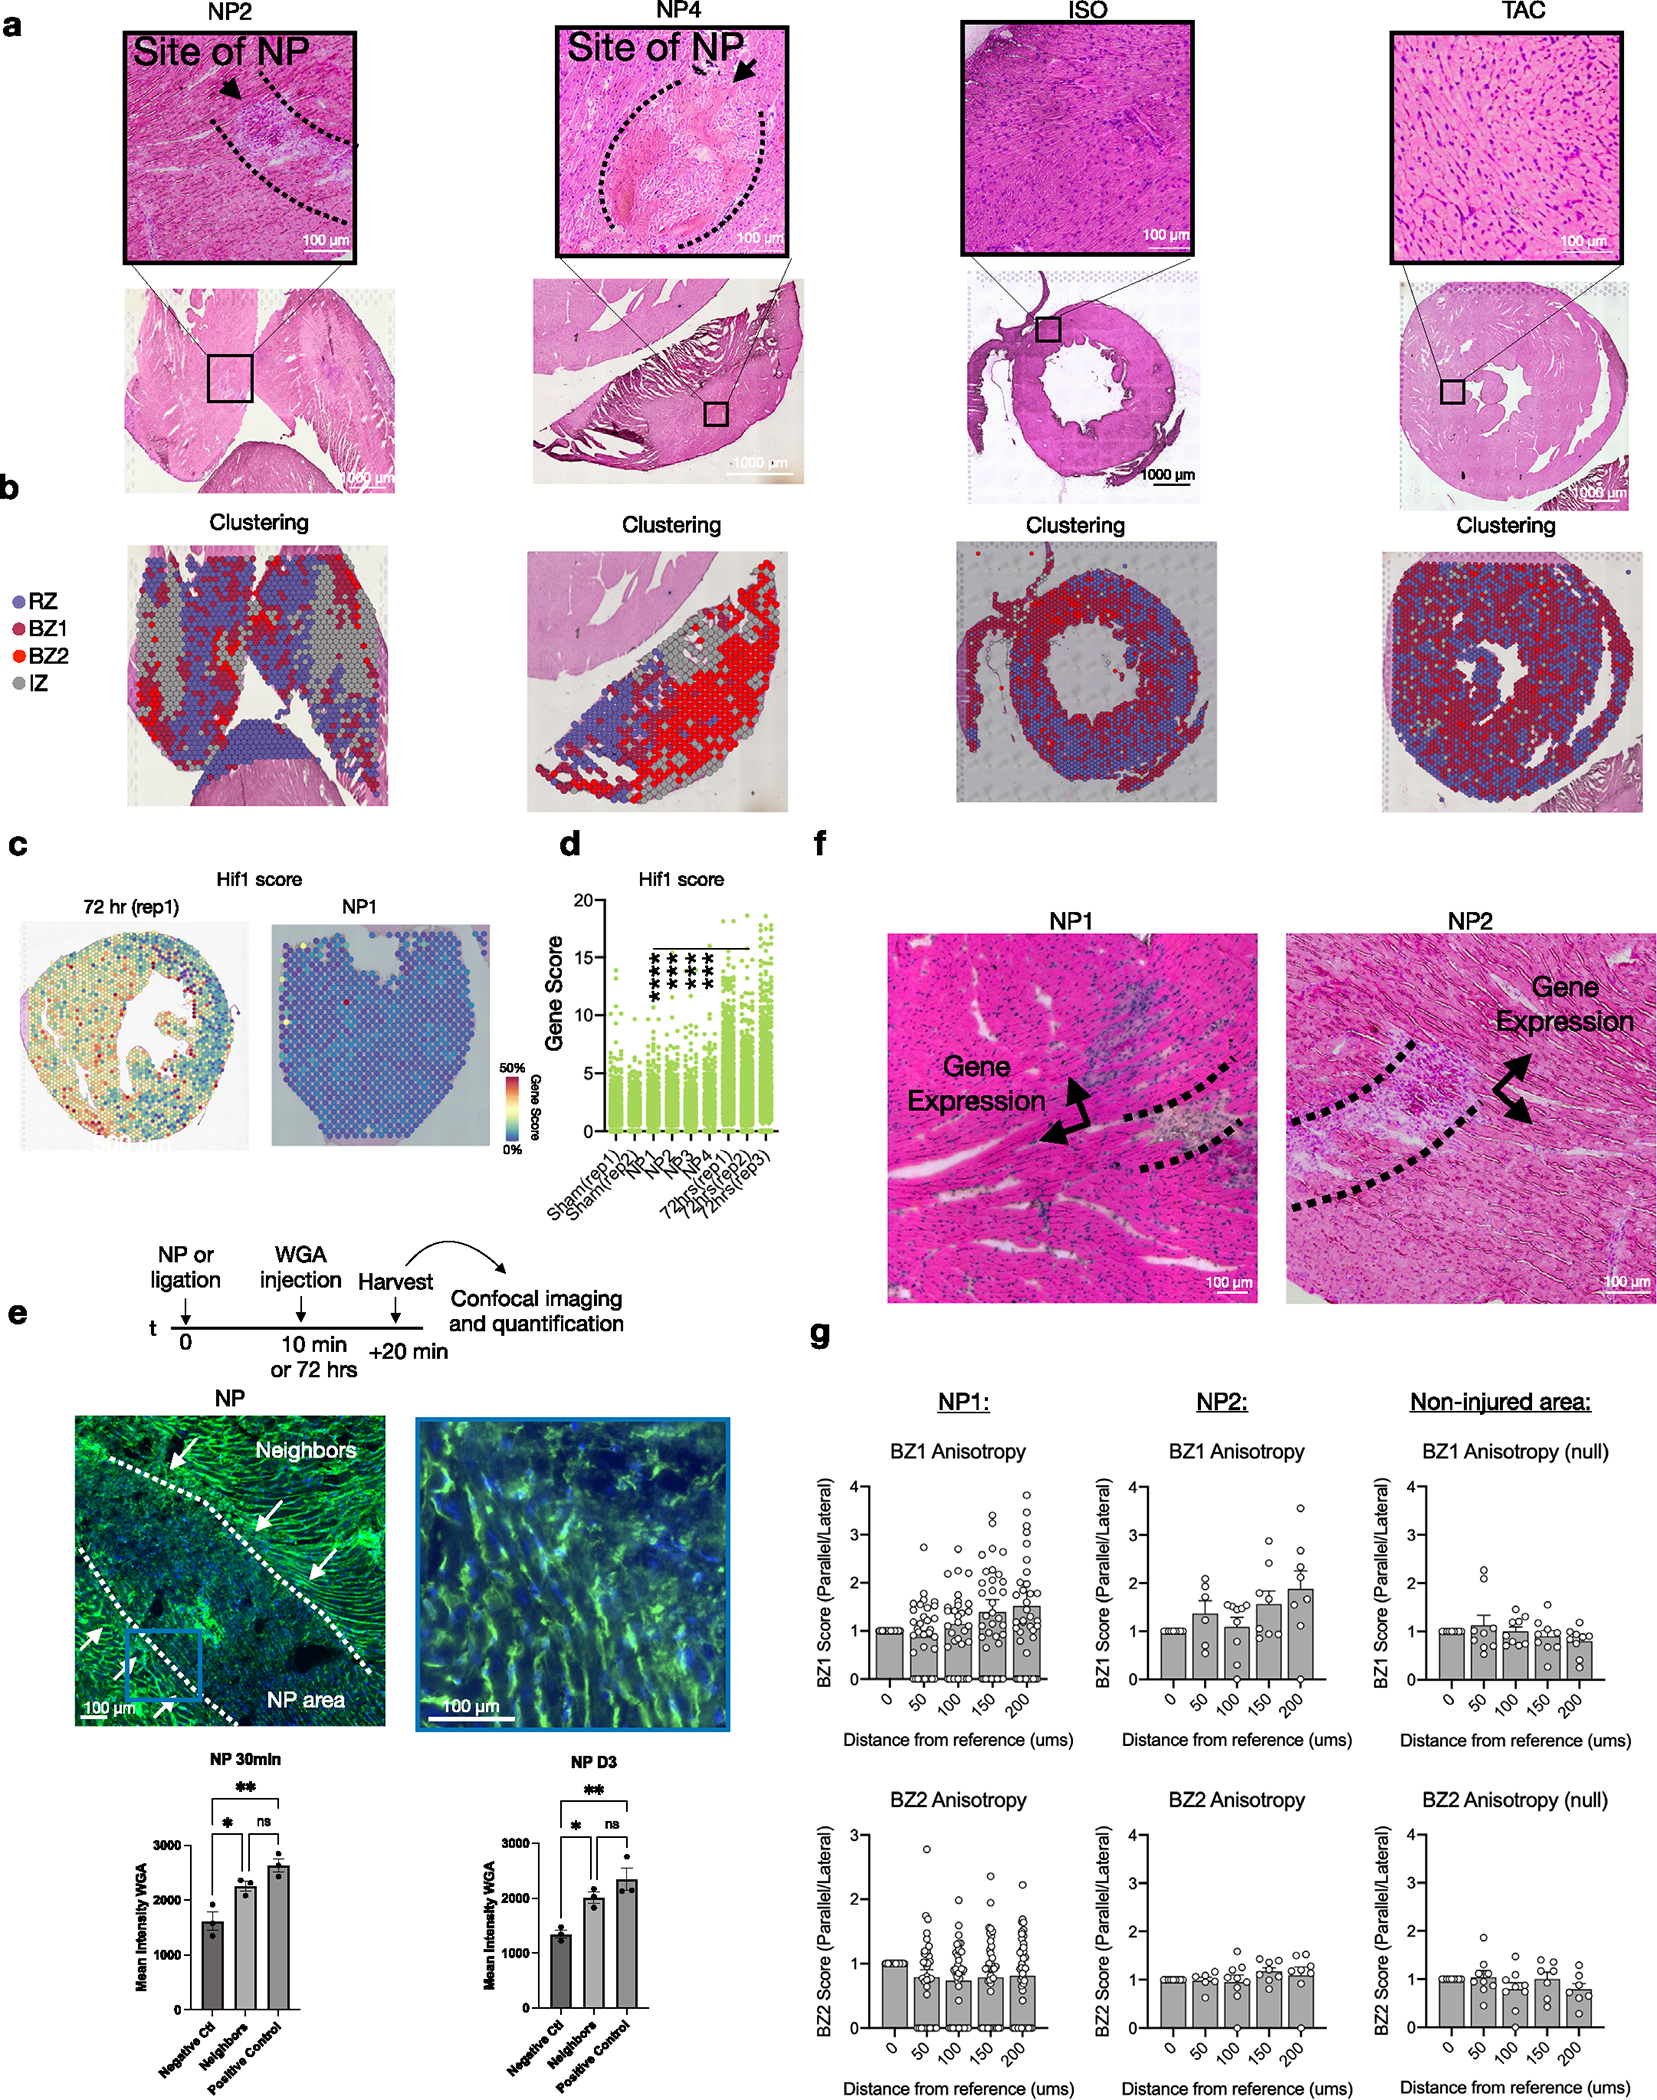
(a) H&E sections at low magnification (lower panel) and high magnification (top panel). Representative of at least 2 separate experiments. (b) Clustering results of spatial transcriptomic data based on integrated dataset as shown in Extended Data Fig. 3. (c) Hif1 scores applied to representative 72 hrs post-MI sample (left) and NP (right) with quantifications plotted per pixel in (d). In comparison to post-MI hearts, needle pass injuries have a significantly lower Hif1 score compared to the positive control (72 hr MI) samples and is unchanged from negative controls in sham samples. (e) Experimental design of fluorescent dye assay to assess regional perfusion. Wheat germ agglutinin (WGA) conjugated to AlexaFluor 488 was injected directly into LV 10 min or 72 hrs post NP injury and hearts were harvested 20 minutes after injection for imaging and quantification (data presented as mean values ± SEM n = 3 biologically independent samples). The representative image in the left panel designates the visualization of the needle pass area designated as the negative control and the reference site designated as neighbors, and the right panel represents a positive control area remote from the site of injury. Quantification of samples harvested 30 minutes and 72 hrs post-NP injury reveal that in both time courses, Neighbors and Positive controls are significantly increased as compared to the Negative Control (Needle pass) sites and are not different from each other (f) Representative H&E-stained sections of NP injuries highlighting area of injury in dash lines and directions of adjacent myocyte bundles in arrows used to quantify gene expression. Representative of 2 separate experiments, each of which had tissue sections aligned with the long axis of the needle insertion. (g) Anisotropy ratios in each sample with non-injured area (right) showing no significant anisotropy in the borderzones of needle pass injuries (n = 2 biologically independent samples). Data presented as mean values ± SEM. *P-value < 0.05, **P-value < 0.01, ***P-value < 0.001, ****P-value < 0.0001; One-way ANOVA with Tukey’s post-hoc analysis.
Supplementary Material
Acknowledgements
This publication includes data generated at the UC San Diego IGM Genomics Center utilizing an Illumina NovaSeq 6000 that was purchased with funding from a National Institutes of Health SIG grant (#S10 OD026929). We thank IGM and the Nikon Imaging Center at UCSD for technical assistance. The work was funded by National Institutes of Health (NIH) grants NIH UL1TR001442 (UCSD), AHA17IRG33410543 (K.R.K.), NIH R00HL129168 (K.R.K.), NIH DP2AR075321 (K.R.K.), NIH HL142251 (F.S.) and NIH T32HL105373 (D.M.C.), National Heart Lung and Blood Institute (NHLBI) grants NHLBI T32HL007444 (V.K.N.) and NHLBI HL162369 (F.S.) and Department of Defense grant no. W81XWH1810380 (F.S.).
Footnotes
Competing interests
F.S. is a cofounder and has an equity interest in Papillon Therapeutics; he is a consultant and has equity interest and a research grant from LEXEO Therapeutics. The other authors declare no competing interests.
Reporting summary
Further information on research design is available in the Nature Research Reporting Summary linked to this article.
Additional information
Extended data is available for this paper at https://doi.org/10.1038/s44161-022-00160-3.
Supplementary information The online version contains supplementary material available at https://doi.org/10.1038/s44161-022-00160-3.
Peer review information Nature Cardiovascular Research thanks Rafael Kramann and the other, anonymous, reviewer(s) for their contribution to the peer review of this work.
Reprints and permissions information is available at www.nature.com/reprints.
Code availability
The code used to process this data is publicly available at Zenodo (https://zenodo.org/record/7055957#.Y00deezMIqu)
Data availability
sc/snRNA-seq data and spatial transcriptomic sequencing data have been deposited to the Gene Expression Omnibus under accession no. GSE214611. All other data supporting the findings in this study are included in the main article and associated files.
References
- 1.Factor SM, Sonnenblick EH & Kirk ES The histologic border zone of acute myocardial infarction—islands or peninsulas? Am. J. Pathol. 92, 111–124 (1978). [PMC free article] [PubMed] [Google Scholar]
- 2.Janse MJ et al. The “border zone” in myocardial ischemia. An electrophysiological, metabolic, and histochemical correlation in the pig heart. Circ. Res. 44, 576–588 (1979). [DOI] [PubMed] [Google Scholar]
- 3.van Duijvenboden K et al. Conserved NPPB+ border zone switches from MEF2- to AP-1-driven gene program. Circulation 140, 864–879 (2019). [DOI] [PubMed] [Google Scholar]
- 4.Vivien CJ, Hudson JE & Porrello ER Evolution, comparative biology and ontogeny of vertebrate heart regeneration. NPJ Regen. Med. 1, 16012 (2016). [DOI] [PMC free article] [PubMed] [Google Scholar]
- 5.Smith RM, Black AJ, Velamakanni SS, Akkin T & Tolkacheva EG Visualizing the complex 3D geometry of the perfusion border zone in isolated rabbit heart. Appl. Opt. 51, 2713–2721 (2012). [DOI] [PubMed] [Google Scholar]
- 6.Pirolo JS, Hutchins GM & Moore GW Infarct expansion: pathologic analysis of 204 patients with a single myocardial infarct. J. Am. Coll. Cardiol. 7, 349–354 (1986). [DOI] [PubMed] [Google Scholar]
- 7.Erlebacher JA, Richter RC, Alonso DR, Devereux RB & Gay WA Jr. Early infarct expansion: structural or functional? J. Am. Coll. Cardiol. 6, 839–844 (1985). [DOI] [PubMed] [Google Scholar]
- 8.Gao XM, Xu Q, Kiriazis H, Dart AM & Du XJ Mouse model of post-infarct ventricular rupture: time course, strain- and gender-dependency, tensile strength, and histopathology. Cardiovasc Res. 65, 469–477 (2005). [DOI] [PubMed] [Google Scholar]
- 9.Mounier-Vehier F et al. Borderzone infarct subtypes: preliminary study of the presumed mechanism. Eur. Neurol. 34, 11–15 (1994). [DOI] [PubMed] [Google Scholar]
- 10.Wetstein L, Michelson EL, Simson MB, Moore EN & Harken AH Increased normoxic-to-ischemic tissue borderzone as the cause for reentrant ventricular tachyarrhythmias. J. Surg. Res. 32, 526–534 (1982). [DOI] [PubMed] [Google Scholar]
- 11.Hearse DJ & Yellon DM The “Border zone” and myocardial protection: a time for reassessment? Acta Med. Scand. Suppl. 651, 37–46 (1981). [PubMed] [Google Scholar]
- 12.Duncanson ER & Mackey-Bojack SM Histologic examination of the heart in the forensic autopsy. Acad. Forensic Pathol. 8, 565–615 (2018). [DOI] [PMC free article] [PubMed] [Google Scholar]
- 13.Jackson BM et al. Extension of borderzone myocardium in postinfarction dilated cardiomyopathy. J. Am. Coll. Cardiol. 40, 1160–1167 (2002). [DOI] [PubMed] [Google Scholar]
- 14.Yang Y et al. Age-related differences in postinfarct left ventricular rupture and remodeling. Am. J. Physiol. Heart Circ. Physiol. 294, H1815–H1822 (2008). [DOI] [PubMed] [Google Scholar]
- 15.Cavasin MA, Tao Z, Menon S & Yang X-P Gender differences in cardiac function during early remodeling after acute myocardial infarction in mice. Life Sci. 75, 2181–2192 (2004). [DOI] [PubMed] [Google Scholar]
- 16.Tsao CW et al. Heart Disease and Stroke Statistics-2022 Update: A Report From the American Heart Association. Circulation 145, e153–e639 (2022). [DOI] [PubMed] [Google Scholar]
- 17.von Lueder TG, Kotecha D, Atar D & Hopper I Neurohormonal blockade in heart failure. Card. Fail. Rev. 3, 19–24 (2017). [DOI] [PMC free article] [PubMed] [Google Scholar]
- 18.Aizarani N et al. A human liver cell atlas reveals heterogeneity and epithelial progenitors. Nature 572, 199–204 (2019). [DOI] [PMC free article] [PubMed] [Google Scholar]
- 19.Halpern KB et al. Single-cell spatial reconstruction reveals global division of labour in the mammalian liver. Nature 542, 352–356 (2017). [DOI] [PMC free article] [PubMed] [Google Scholar]
- 20.Calcagno DM et al. The myeloid type I interferon response to myocardial infarction begins in bone marrow and is regulated by Nrf2-activated macrophages. Sci. Immunol. 5, eaaz1974 (2020). [DOI] [PMC free article] [PubMed] [Google Scholar]
- 21.Calcagno DM et al. SiglecF(HI) marks late-stage neutrophils of the infarcted heart: a single-cell transcriptomic analysis of neutrophil diversification. J. Am. Heart Assoc. 10, e019019 (2021). [DOI] [PMC free article] [PubMed] [Google Scholar]
- 22.Dick SA et al. Self-renewing resident cardiac macrophages limit adverse remodeling following myocardial infarction. Nat. Immunol. 20, 29–39 (2019). [DOI] [PMC free article] [PubMed] [Google Scholar]
- 23.King KR et al. IRF3 and type I interferons fuel a fatal response to myocardial infarction. Nat. Med. 23, 1481–1487 (2017). [DOI] [PMC free article] [PubMed] [Google Scholar]
- 24.Forte E et al. Dynamic interstitial cell response during myocardial infarction predicts resilience to rupture in genetically diverse mice. Cell Rep. 30, 3149–3163.e6 (2020). [DOI] [PMC free article] [PubMed] [Google Scholar]
- 25.Hu P et al. Single-nucleus transcriptomic survey of cell diversity and functional maturation in postnatal mammalian hearts. Genes Dev. 32, 1344–1357 (2018). [DOI] [PMC free article] [PubMed] [Google Scholar]
- 26.Martini E et al. Single-cell sequencing of mouse heart immune infiltrate in pressure overload-driven heart failure reveals extent of immune activation. Circulation 140, 2089–2107 (2019). [DOI] [PubMed] [Google Scholar]
- 27.Ren Z et al. Single-cell reconstruction of progression trajectory reveals intervention principles in pathological cardiac hypertrophy. Circulation 141, 1704–1719 (2020). [DOI] [PubMed] [Google Scholar]
- 28.Tucker NR et al. Transcriptional and cellular diversity of the human heart. Circulation 142, 466–482 (2020). [DOI] [PMC free article] [PubMed] [Google Scholar]
- 29.Wang Z et al. Cell-type-specific gene regulatory networks underlying murine neonatal heart regeneration at single-cell resolution. Cell Rep. 33, 108472 (2020). [DOI] [PMC free article] [PubMed] [Google Scholar]
- 30.Cui M et al. Dynamic transcriptional responses to injury of regenerative and non-regenerative cardiomyocytes revealed by single-nucleus RNA sequencing. Dev. Cell 53, 102–116.e8 (2020). [DOI] [PMC free article] [PubMed] [Google Scholar]
- 31.Kuppe C et al. Spatial multi-omic map of human myocardial infarction. Nature 608, 766–777 (2022). [DOI] [PMC free article] [PubMed] [Google Scholar]
- 32.Heinz S et al. Simple combinations of lineage-determining transcription factors prime cis-regulatory elements required for macrophage and B cell identities. Mol. Cell 38, 576–589 (2010). [DOI] [PMC free article] [PubMed] [Google Scholar]
- 33.Sinn HW, Balsamo J, Lilien J & Lin JJ Localization of the novel Xin protein to the adherens junction complex in cardiac and skeletal muscle during development. Dev. Dyn. 225, 1–13 (2002). [DOI] [PubMed] [Google Scholar]
- 34.Gustafson-Wagner EA et al. Loss of mXinalpha, an intercalated disk protein, results in cardiac hypertrophy and cardiomyopathy with conduction defects. Am. J. Physiol. Heart Circ. Physiol. 293, H2680–H2692 (2007). [DOI] [PMC free article] [PubMed] [Google Scholar]
- 35.Long PA, Larsen BT, Evans JM & Olson TM Exome sequencing identifies pathogenic and modifier mutations in a child with sporadic dilated cardiomyopathy. J. Am. Heart Assoc. 4, e002443 (2015). [DOI] [PMC free article] [PubMed] [Google Scholar]
- 36.Huang Y-S, Xing Y-L & Li H-W Heterozygous desmin gene (DES) mutation contributes to familial dilated cardiomyopathy. J. Int. Med. Res. 49, 3000605211006598 (2021). [DOI] [PMC free article] [PubMed] [Google Scholar]
- 37.McCalmon SA et al. Modulation of angiotensin II-mediated cardiac remodeling by the MEF2A target gene Xirp2. Circ. Res. 106, 952–960 (2010). [DOI] [PMC free article] [PubMed] [Google Scholar]
- 38.Verdonschot JAJ et al. A mutation update for the FLNC gene in myopathies and cardiomyopathies. Hum. Mutat. 41, 1091–1111 (2020). [DOI] [PMC free article] [PubMed] [Google Scholar]
- 39.Ortiz-Genga MF et al. Truncating FLNC mutations are associated with high-risk dilated and arrhythmogenic cardiomyopathies. J. Am. Coll. Cardiol. 68, 2440–2451 (2016). [DOI] [PubMed] [Google Scholar]
- 40.Hall CL et al. Filamin C variants are associated with a distinctive clinical and immunohistochemical arrhythmogenic cardiomyopathy phenotype. Int. J. Cardiol. 307, 101–108 (2020). [DOI] [PubMed] [Google Scholar]
- 41.Oz S et al. Reduction in filamin C transcript is associated with arrhythmogenic cardiomyopathy in Ashkenazi Jews. Int. J. Cardiol. 317, 133–138 (2020). [DOI] [PubMed] [Google Scholar]
- 42.Begay RL et al. Filamin C truncation mutations are associated with arrhythmogenic dilated cardiomyopathy and changes in the cell–cell adhesion structures. JACC Clin. Electrophysiol. 4, 504–514 (2018). [DOI] [PMC free article] [PubMed] [Google Scholar]
- 43.Valdés-Mas R et al. Mutations in filamin C cause a new form of familial hypertrophic cardiomyopathy. Nat. Commun. 5, 5326 (2014). [DOI] [PubMed] [Google Scholar]
- 44.Han P et al. A long noncoding RNA protects the heart from pathological hypertrophy. Nature 514, 102–106 (2014). [DOI] [PMC free article] [PubMed] [Google Scholar]
- 45.Günthel M Epigenetic state changes underlie metabolic switch in mouse post-infarction border zone cardiomyocytes. J. Cardiovasc. Dev. Dis. 8, 134 (2021). [DOI] [PMC free article] [PubMed] [Google Scholar]
- 46.Guo H et al. Intercalated disc protein Xinβ is required for Hippo-YAP signaling in the heart. Nat. Commun. 11, 4666 (2020). [DOI] [PMC free article] [PubMed] [Google Scholar]
- 47.Tao G et al. Pitx2 promotes heart repair by activating the antioxidant response after cardiac injury. Nature 534, 119–123 (2016). [DOI] [PMC free article] [PubMed] [Google Scholar]
- 48.Nadadur RD et al. Pitx2 modulates a Tbx5-dependent gene regulatory network to maintain atrial rhythm. Sci. Transl. Med. 8, 354ra115 (2016). [DOI] [PMC free article] [PubMed] [Google Scholar]
- 49.Man JCK et al. Genetic dissection of a super enhancer controlling the Nppa-Nppb cluster in the heart. Circ. Res. 128, 115–129 (2021). [DOI] [PubMed] [Google Scholar]
- 50.Cao DJ et al. Cytosolic DNA sensing promotes macrophage transformation and governs myocardial ischemic injury. Circulation 137, 2613–2634 (2018). [DOI] [PMC free article] [PubMed] [Google Scholar]
- 51.Farbehi N et al. Single-cell expression profiling reveals dynamic flux of cardiac stromal, vascular and immune cells in health and injury. eLife 8, e43882 (2019). [DOI] [PMC free article] [PubMed] [Google Scholar]
- 52.Muhl L et al. Single-cell analysis uncovers fibroblast heterogeneity and criteria for fibroblast and mural cell identification and discrimination. Nat. Commun. 11, 3953 (2020). [DOI] [PMC free article] [PubMed] [Google Scholar]
- 53.Dela Paz NG & D’Amore PA Arterial versus venous endothelial cells. Cell Tissue Res. 335, 5–16 (2009). [DOI] [PMC free article] [PubMed] [Google Scholar]
- 54.Vanlandewijck M et al. A molecular atlas of cell types and zonation in the brain vasculature. Nature 554, 475–480 (2018). [DOI] [PubMed] [Google Scholar]
- 55.Kalucka J et al. Single-cell transcriptome atlas of murine endothelial cells. Cell 180, 764–779.e20 (2020). [DOI] [PubMed] [Google Scholar]
- 56.Fujimoto N et al. Single-cell mapping reveals new markers and functions of lymphatic endothelial cells in lymph nodes. PLoS Biol. 18, e3000704 (2020). [DOI] [PMC free article] [PubMed] [Google Scholar]
- 57.Gerarduzzi C, Hartmann U, Leask A & Drobetsky E The matrix revolution: matricellular proteins and restructuring of the cancer microenvironment. Cancer Res. 80, 2705–2717 (2020). [DOI] [PubMed] [Google Scholar]
- 58.Nishioka T et al. Tenascin C may aggravate left ventricular remodeling and function after myocardial infarction in mice. Am. J. Physiol. Heart Circ. Physiol. 298, H1072–H1078 (2010). [DOI] [PubMed] [Google Scholar]
- 59.McCurdy SM et al. SPARC mediates early extracellular matrix remodeling following myocardial infarction. Am. J. Physiol. Heart Circ. Physiol. 301, H497–H505 (2011). [DOI] [PMC free article] [PubMed] [Google Scholar]
- 60.Murry CE, Giachelli CM, Schwartz SM & Vracko R Macrophages express osteopontin during repair of myocardial necrosis. Am. J. Pathol. 145, 1450–1462 (1994). [PMC free article] [PubMed] [Google Scholar]
- 61.Schellings MWM et al. Absence of SPARC results in increased cardiac rupture and dysfunction after acute myocardial infarction. J. Exp. Med. 206, 113–123 (2009). [DOI] [PMC free article] [PubMed] [Google Scholar]
- 62.Oka T et al. Genetic manipulation of periostin expression reveals a role in cardiac hypertrophy and ventricular remodeling. Circ. Res. 101, 313–321 (2007). [DOI] [PMC free article] [PubMed] [Google Scholar]
- 63.Trueblood NA et al. Exaggerated left ventricular dilation and reduced collagen deposition after myocardial infarction in mice lacking osteopontin. Circ. Res. 88, 1080–1087 (2001). [DOI] [PubMed] [Google Scholar]
- 64.Richardson WJ & Holmes JW Why is infarct expansion such an elusive therapeutic target? J. Cardiovasc. Transl. Res. 8, 421–430 (2015). [DOI] [PMC free article] [PubMed] [Google Scholar]
- 65.Luther DJ, Thodeti CK & Meszaros JG Injury models to study cardiac remodeling in the mouse: myocardial infarction and ischemia–reperfusion. Methods Mol. Biol. 1037, 325–342 (2013). [DOI] [PubMed] [Google Scholar]
- 66.Monroe TO et al. YAP partially reprograms chromatin accessibility to directly induce adult cardiogenesis in vivo. Dev. Cell 48, 765–779.e7 (2019). [DOI] [PMC free article] [PubMed] [Google Scholar]
- 67.Xiao Y, Leach J, Wang J & Martin JF Hippo/Yap signaling in cardiac development and regeneration. Curr. Treat. Options Cardiovasc. Med. 18, 38 (2016). [DOI] [PubMed] [Google Scholar]
Associated Data
This section collects any data citations, data availability statements, or supplementary materials included in this article.
Supplementary Materials
Data Availability Statement
sc/snRNA-seq data and spatial transcriptomic sequencing data have been deposited to the Gene Expression Omnibus under accession no. GSE214611. All other data supporting the findings in this study are included in the main article and associated files.


