Abstract
Background:
The approach to managing and admitting patients with syncope in an emergency setting lacks standardization. Our study aims to evaluate regional variation in management and resource utilization of emergency department (ED) patients presenting with syncope.
Methods:
We used the 2006 to 2014 Nationwide Emergency Department Sample to identify adults ≥ 18 years old with an ICD-9 principal diagnosis code (780.2) of syncope. Basic patient demographics, socio-economic and comorbidity characteristics were compared across predefined federal geographic regions in the US: Northeast, Midwest, South and West. ED service charges were adjusted for inflation using the Consumer Price Index with 2019 as the reference year. Multivariate logistic regression models were constructed to compare hospitalization rates and mortality among regions with the Northeast as the reference while accounting for possible confounders. Similarly, negative binomial regression models were constructed to compare ED service charges.
Results:
From 2006 to 2014, 9,132,176 adult syncope ED visits were included in the analysis. Syncope visits in the Northeast (n=1,831,889) accounted for 20.1% of all included visits; visits in the Midwest (n=2,060,940) accounted for 22.6%; visits in the South (n=3,527,814) accounted for 38.6% and visits in the West (n=1,711,533) accounted for 18.7%. Mean age was 56 years with 57.7% being female. The majority (65.2%) of the syncope visits were to hospital EDs without a trauma designation and 42.2% of the visits were evaluated and treated in metropolitan non-teaching hospitals. The Northeast region had the highest risk-adjusted hospitalization rate (24.5%) followed by the South (18.6%, AOR 0.58; 95% CI 0.52–0.65, p<0.001), the Midwest (17.2%, AOR 0.51; 95% CI 0.46–0.58, p<0.001) and the West (15.8%, AOR 0.45; 95% CI 0.39–0.51, p<0.001). The risk-adjusted rate of Syncope hospitalization significantly declined over the study period from 25.8% (95% CI 24.8%−26.7%) in 2006 to 11.7% (95% CI 11.0%−12.5%) in 2014 (Ptrend <0.001). The Northeast region had the lowest risk-adjusted ED service charge per visit ($3,320) followed by the Midwest ($4,675, IRRadj 1.41; 95% CI 1.30–1.52, p<0.001), the West ($4,814, IRRadj 1.45; 95% CI 1.31–1.60, p<0.001) and the South ($4,969, IRRadj 1.50; 95% CI 1.38–1.62, p<0.001). ED service charges increased during the study period from $3,047/visit (95% CI $2,912-$3,182) in 2006 to $6,267/visit (95% CI $5,947-$6,586) in 2014 (Ptrend <0.001). Compared to the Northeast, all regions had significantly lower risk-adjusted inpatient length of hospital stay (all p<0.001) but only the West had a significantly lower mortality (AOR 0.53; 95% CI 0.33–0.87, p<0.001)
Conclusions:
We found significant regional variability in hospitalization rates, mortality and ED service charges in ED patients presenting with syncope. Standardized practices for management of this patient population are needed to reduce variability and the impact of such variability on healthcare delivery optimization and allocation of expensive resources.
Keywords: Hospitalization, Emergency Department, Syncope, Outcomes, Trends, Healthcare Utilization
Introduction
Syncope is a transient loss of consciousness due to cerebral hypoperfusion followed by spontaneous complete recovery (1). Each year an average of 1.2 million syncope emergency department (ED) visits occur in the United States accounting for 1–3% of all ED visits and approximately 6% of all hospitalizations (2–4). While utilization of advanced imaging for syncope increased between 2002 and 2007, hospitalization for syncope has since plateaued or steadily down trended (including both hospital admission and observation care), perhaps reflecting the increasing shift towards ED management of syncope patients (5, 6).
As the differential diagnosis for syncope is broad including many benign as well as life-threatening conditions, physicians in the ED are able to determine the underlying etiology in approximately 50% of the cases (7). As such, many patients often remain undiagnosed despite exhaustive and expensive testing (8). Several professional societies have collaborated and published guidelines to standardize clinical practice in order to reduce unnecessary services for patients with syncope (9–11). However, it is unclear how often care for syncope patients in the ED adheres to published guidelines. In addition, management trends and outcomes from the broad national population comprising each specific geographic region of the United States are unknown. Thus, in the current study, we evaluate regional variation in the US for ED syncope visits, hospitalization rates and associated resource utilization using the Nationwide Emergency Department Sample (NEDS). We hypothesized that trends in hospitalization, overall charges and resource utilization rates among patients presenting to the ED with syncope would be similar across the four geographic regions in the US.
Materials and Methods
Database
We used data files from the Nationwide Emergency Department Sample (NEDS) database 2006–2014. Annually, the NEDS collects data covering ~138 million ED visits regardless of whether that visit resulted in hospital admission, reflecting all visits from ~945 hospitals and covering 34 States and the District of Columbia in 2014 (12). Using a sampling probability of ~20%, the design of NEDS is stratified and reflects U.S. hospital-based EDs. Approval for the use of the NEDS patient-level data was obtained from the Institutional Review Board of Johns Hopkins University and from the Healthcare Cost and Utilization Project.
Study Population
We used the International Classification of Diseases, Ninth Edition Clinical Modification (ICD-9-CM) code of syncope and collapse (780.2) to identify adults ≥ 18 years of age with a principal diagnosis of syncope. Previous studies have used similar methodology to identify patients with syncope (13, 14). In addition, a previous study of claims data has demonstrated the reliability of using ICD-9-CM codes, at the principle diagnosis position, in identifying patients with syncope (positive predictive value of 92%). (15)
Definition of variables
We used NEDS variables to identify patients’ age, sex, primary expected payer, weekday versus weekend admission, and comorbidities. (16) Clinically relevant comorbidities not readily available in the NEDS (e.g. atrial fibrillation/flutter, acute renal failure, head trauma, epilepsy… etc.) were identified using ICD-9-CM codes (Supplemental eTable 1). NEDS hospital variables included trauma center level, location and teaching status. In addition, all these variables were studied across the four predefined federal geographic regions of the United States (Northeast, Midwest, South and West).
Outcomes Measured
The two primary outcomes for our study were hospitalization rate and ED service charges. Hospitalization was defined as an ED visit that resulted in admission of the patient to inpatient care. Secondary outcomes included mortality, and disposition after ED visits. Charges were adjusted for inflation using the year-specific Consumer Price Index provided by the US Bureau of Labor Statistics, with 2019 as the index base. (17)
Statistical analyses
Statistical analyses were performed using Stata 13.0, accounting for survey design complexity, sampling weights, primary sampling units and strata. First, patient demographics, co-morbidities and hospital characteristics were compared between the four federal regions of the United States using Pearson χ2 test for categorical variables and linear regression (1-way ANOVA) for continuous variables. Second, means and proportions of the primary and secondary outcomes of interest were similarly compared. Third, multiple logistic regression models for categorical outcomes (hospitalization rate & mortality) and negative binomial regression model for continuous outcome (ED service charges) were conducted to examine the association between geographic regions and these outcomes of interest. These models were adjusted for patient age, sex, primary payer, median income, weekend admission, comorbidities and hospital trauma designation and teaching status. Adding calendar year to the model, risk-adjusted trends in hospitalization rate and ED service charges, overall and by region, were estimated taking 2006 as the referent year. Standard errors were estimated using Taylor series linearization, all P values were 2 sided and type I error was set at 0.05.
Results
Baseline Characteristics
Our study included 9,132,176 ED syncope visits with a mean patient age of 56.1 years and 57.7% females. Of those visits, 1,831,889 were evaluated in the Northeast, 2,060,940 in the Midwest, 3,527,814 in the South and 1,711,533 in the West region. Around 70.1 % of all ED visits were by patients with no associated comorbidities and Medicare was the largest payer covering 40.7% of all ED syncope visits. The majority (65.2%) of syncope visits were to hospital EDs without a trauma designation and 42.2% of visits were evaluated and treated in metropolitan non-teaching hospitals. Baseline characteristics of patients were significantly different between the four regions. Distribution of patient characteristics, co-morbidities and hospital characteristics overall and by region are presented in Table 1 and Supplemental eTable 2.
Table 1:
Regional Baseline Characteristics of Patients Presenting to the ED with Syncope, NEDS 2006–2014
| Characteristics | All Patients (n = 9,132,176) | Northeast (n = 1,831,889) | Midwest (n = 2,060,940) | South (n = 3,527,814) | West (n = 1,711,533) | P Value |
|---|---|---|---|---|---|---|
| Age, yrs | 56.1 ± 0.1 | 56.1 ± 0.3 | 55.7 ± 0.2 | 55.9 ± 0.2 | 57.0 ± 0.2 | 0.036 |
| Female | 5,268,297 (57.7) | 1,067,597 (58.3) | 1,176,401 (57.1) | 2,050,533 (58.1) | 973,766 (56.9) | <0.001 |
| Primary Payor | <0.001 | |||||
| Medicare | 3,720,102 (40.7) | 716,427 (39.1) | 850,796 (41.3) | 1,457,908 (41.3) | 694,971 (40.6) | |
| Medicaid | 914,853 (10.0) | 194,316 (10.6) | 205,157 (9.9) | 333,322 (9.4) | 182,058 (10.6) | |
| Private insurance | 3,116,039 (34.1) | 704,421 (38.4) | 733,057 (35.6) | 1,080,729 (30.6) | 597,832 (34.9) | |
| Other | 1,356,497 (14.9) | 210,477 (11.5) | 265,297 (12.9) | 647,188 (18.3) | 233,535 (13.6) | |
| Missing | 24,685 (0.3) | 6,248 (0.3) | 6,633 (0.3) | 8,667 (0.2) | 3,137 (0.2) | |
| Weekend presentation | 2,456,729 (26.9) | 486,927 (26.6) | 557,334 (27.0) | 942,473 (26.7) | 469,995 (27.5) | <0.001 |
| Charlson Comorbidity Index | <0.001 | |||||
| 0 | 6,405,316 (70.1) | 1,319,340 (72.0) | 1,443,293 (70.0) | 2,406,727 (68.2) | 1,235,956 (72.2) | |
| 1 | 1,608,715 (17.6) | 302,854 (16.5) | 360,441 (17.5) | 671,539 (19.1) | 273,881 (16.0) | |
| ≥2 | 1,118,145 (12.3) | 209,695 (11.5) | 257,206 (12.5) | 449,548 (12.7) | 201,696 (11.8) | |
| Hospital trauma center designation | <0.001 | |||||
| Non-trauma | 5,954,528 (65.2) | 1,161,775 (63.4) | 1,113,332 (54.0) | 2,526,056 (71.6) | 1,153,365 (67.4) | |
| Trauma center (Level 1,2,3) | 3,177,648 (34.8) | 670,114 (36.6) | 947,608 (46.0) | 1,001,758 (28.4) | 558,168 (32.6) | |
| Hospital location/teaching status | <0.001 | |||||
| Metropolitan non-teaching hospital | 3,853,193 (42.2) | 621,080 (33.9) | 716,395 (34.8) | 1,565,013 (44.4) | 950,705 (55.5) | |
| Metropolitan teaching hospital | 3,761,593 (41.2) | 1,019,907 (55.7) | 880,904 (42.7) | 1,304,945 (37.0) | 555,837 (32.5) | |
| Non-metropolitan hospital | 1,517,390 (16.6) | 190,902 (10.4) | 463,641 (22.5) | 657,856 (18.6) | 204,991 (12.0) |
Data are n (%) or mean ± SE
Hospitalization Rate
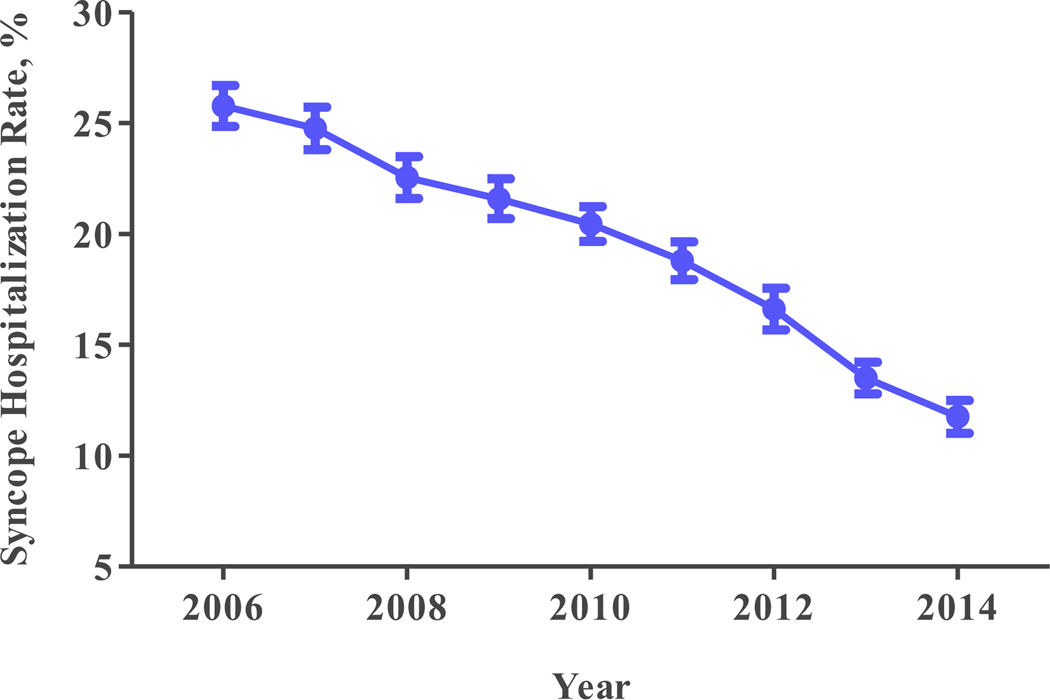
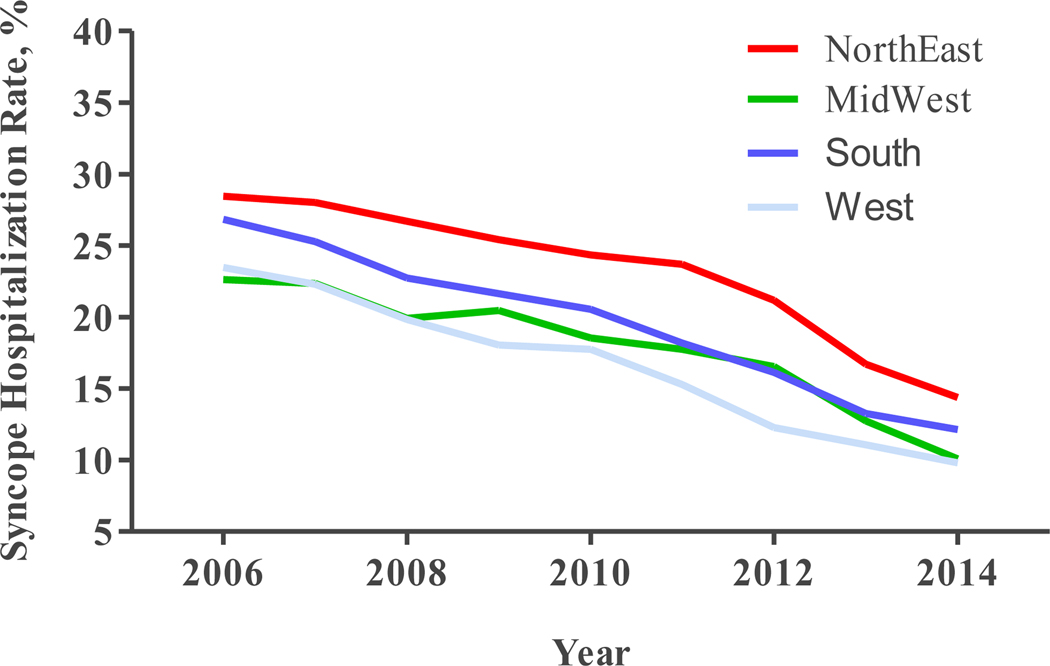
Risk-adjusted hospitalization rate for ED syncope visits was highest in the Northeast region at 24.5% (95% CI 23.3%‒25.7%), followed by the South region at 18.6% (95% CI 17.8%‒19.4%), the Midwest region at 17.2% (95% CI 16.5%‒17.9%) and lowest in the West at 15.8% (95% CI 14.9%‒16.7%) (Figure 1A). Crude hospitalization rates as well as adjusted and unadjusted odds of hospitalization for the various regions with the Northeast taken as a reference are displayed in Table 2. During the study period, overall risk-adjusted rate of hospitalization decreased significantly from 25.8% (95% CI 24.8%‒26.7%) in 2006 to 11.7% (95% CI 11.0%‒12.5%) in 2014 (Ptrend<0.001) (Figure 2A). Similarly, risk-adjusted hospitalization rates in all four regions decreased between 2006 and 2014 (all Ptrend<0.001) (Figure 2B).
Fig. 1A: Risk-adjusted Hospitalization Rate for Syncope by Region United States 2006-2014.
Table 2:
Regional Outcomes of Patients Presenting to the ED with Syncope, NEDS 2006–2014
| Northeast | Midwest | South | West | P Value | |
|---|---|---|---|---|---|
| ED services charges, $ | 3,544 ± 133 | 4,897 ± 127 | 5,392 ± 124 | 5,240 ± 255 | <0.001 |
| Unadjusted IRR | Reference | 1.38 [1.26‒1.51] | 1.52 [1.40‒1.66] | 1.48 [1.31‒1.67] | |
| Adjusted IRR* | Reference | 1.41 [1.30‒1.52] | 1.50 [1.38‒1.62] | 1.45 [1.31‒1.60] | |
| Rate of hospitalization | 549,415 (30.0) | 420,184 (20.4) | 827,772 (23.5) | 321,682 (18.8) | <0.001 |
| Unadjusted OR | Reference | 0.60 [0.54‒0.66] | 0.72 [0.65‒0.79] | 0.54 [0.48‒0.60] | |
| Adjusted OR* | Reference | 0.51 [0.46‒0.58] | 0.58 [0.52‒0.65] | 0.45 [0.39‒0.51] | |
| Mortality | 919 (0.05) | 1,621 (0.08) | 3,219 (0.09) | 544 (0.03) | 0.002 |
| Unadjusted OR | Reference | 1.57 [0.87‒2.83] | 1.82 [1.08‒3.07] | 0.63 [0.38‒1.05] | |
| Adjusted OR* | Reference | 1.44 [0.80‒2.61] | 1.73 [0.98‒3.07] | 0.53 [0.33‒0.87] |
Data are n (%), mean ± SE or OR/IRR [95% CI]
ED, emergency department; IRR, incident rate ratio; NEDS, national emergency department sample; OR, odds ratio
Multivariable regression analyses adjusted for patient age, sex, primary payor, median income, weekend admission, comorbidities and hospital trauma designation and teaching status
Fig. 2A: Overall Trend in Risk-adjusted Syncope Hospitalization United States 2006-2014.
OR: 0.85 95% CI [0.84-0.86], p<0.001
Fig. 2B: Trend in Risk-adjusted Syncope Hospitalization By Region United States 2006-2014.
NE -- OR: 0.85 95% CI [0.83-0.88], p<0.001
MW -- OR: 0.88 95% CI [0.86-0.89], p<0.001
S -- OR: 0.85 95% CI [0.83-0.86], p<0.001
W -- OR: 0.84 95% CI [0.82-0.87], p<0.001
Emergency Department Service Charges
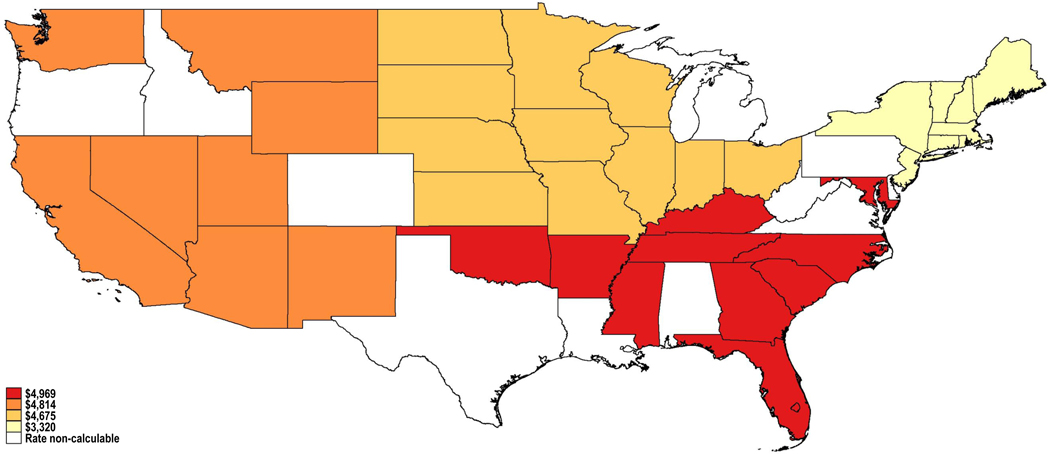
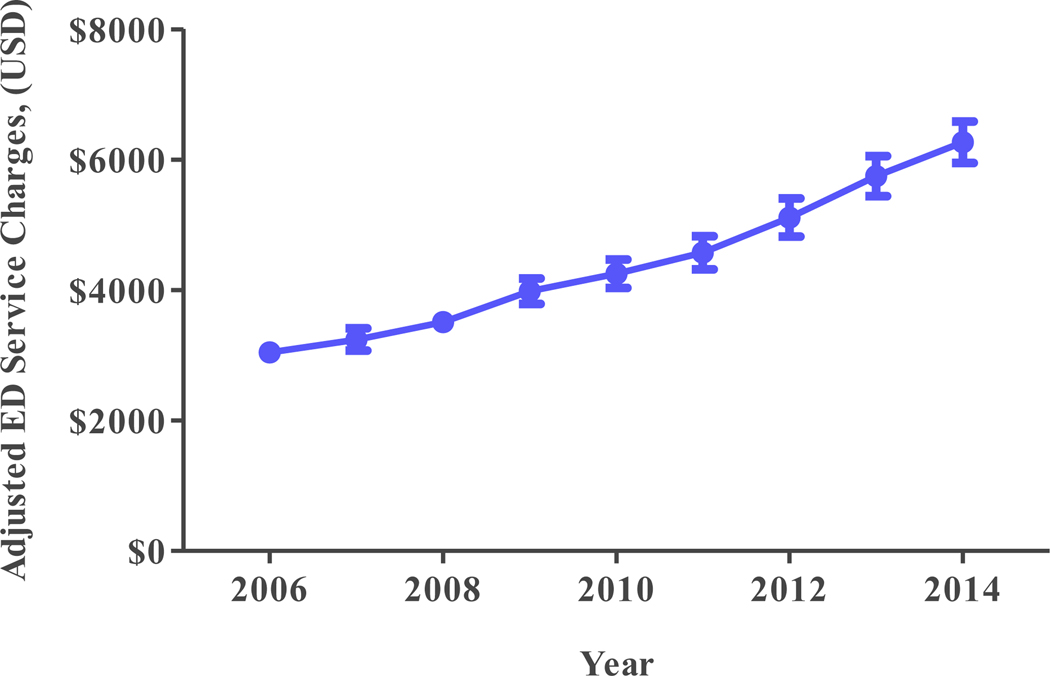
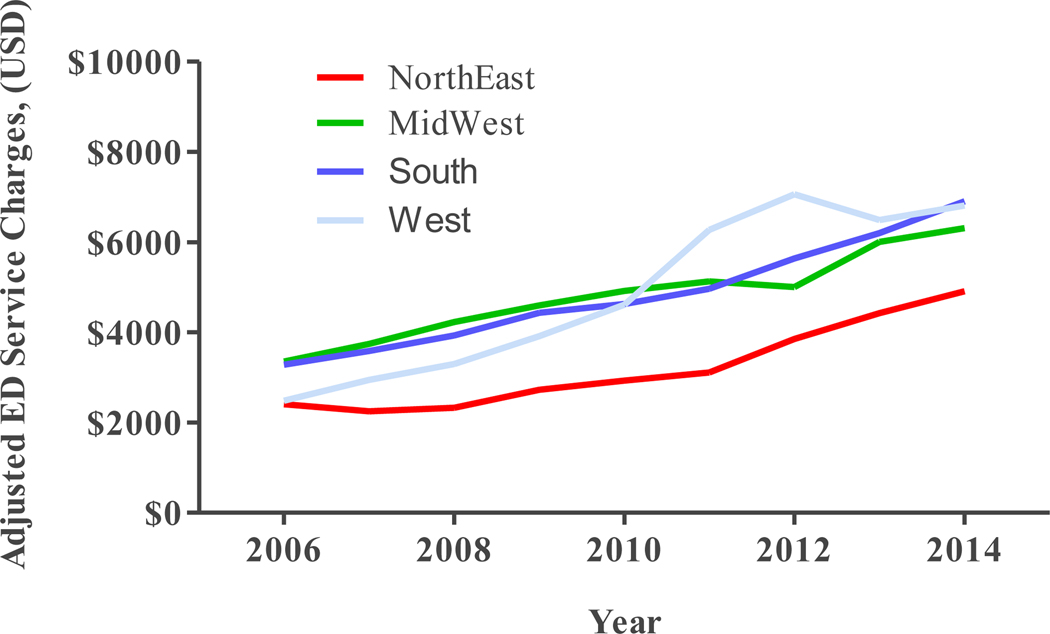
Risk-adjusted ED service charges were highest in the South region at an average of $4,969 per visit (95% CI $4,763‒$5,175 per visit), followed by the West at $4,814 per visit (95% CI $4,445‒$5,183 per visit), the Midwest at $4,674 per visit (95% CI $4,468‒$4,881 per visit) and lowest in the Northeast at an average of $3,320 per visit (95% CI $3,108‒$3,532 per visit) (Figure 1B). Crude ED service charges as well as adjusted and unadjusted incident rates for the various regions with the Northeast taken as a reference are displayed in Table 2. During the study period, overall risk-adjusted ED service charges increased significantly from $3,047 per visit (95% CI $2,912‒$3,182 per visit) in 2006 to $6,267 per visit (95% CI $5,947‒$6,586 per visit) in 2014 (Ptrend<0.001) (Figure 2C). Similarly, risk-adjusted ED service charges in all four regions increased between 2006 and 2014 (all Ptrend<0.001) (Figure 2D).
Fig. 1B: Risk-adjusted ED Service Charges for Syncope by Region United States 2006-2014.
Fig. 2C: Overall Trend in Adjusted ED Service Charges United States 2006-2014.
IRR: 1.10 95% CI [1.09-1.10], p<0.001
Fig. 2D: Trend in Adjusted ED Service Charges By Region United States 2006-2014.
NE -- IRR: 1.11 95% CI [1.09-1.12], p<0.001
MW -- IRR: 1.07 95% CI [1.06-1.08], p<0.001
S -- IRR: 1.09 95% CI [1.08-1.11], p<0.001
W -- IRR: 1.15 95% CI [1.12-1.17], p<0.001
Mortality and Disposition
Overall mortality for patients presenting to the ED with syncope was low at 0.07% (95% CI 0.06%‒0.08%). Compared to the Northeast region, only the West had a significantly lower mortality rate (AOR 0.53, 95% CI 0.33‒0.87, P=0.012). Compared to the Northeast’s rate of 64.05% (95% CI 62.19%‒65.86%), the rate of home disposition after an ED visit for syncope was significantly higher in the Midwest (75.04%; 95% CI 74.05%‒76.01%), South (70.80%; 95% CI 69.55%‒72.01%) and West (76.63%; 95% CI 75.39%‒77.82%). Disposition with home healthcare or to a skilled nursing facility was similar among the 4 regions (Figure 3).
Fig. 3: Syncope Disposition From the ED by Region United States 2006-2014.
Discussion
In this large nationally representative study of patients presenting to the ED with syncope, we observed significant variation in hospitalization rates and emergency department charges across geographic regions within the United States. In addition, the overall risk-adjusted rate of hospitalization significantly decreased from 2006 to 2014 while ED service charges increased during the same time period. We also noted similar trends from 2006 to 2014 for both hospitalization rates and ED service charges across the geographic regions of the United States.
To our knowledge, this study represents the first inquiry to explore regional variation in outcomes and healthcare resources utilization amongst patients presenting with syncope to EDs across the United States. Our findings were similar to work conducted by Anand et al that found a decrease in hospitalizations and increase in hospital costs for patients with a principal diagnosis for syncope (14). However, that study used the Nationwide Inpatient Sample database, which targets hospitalized inpatients; in contrast, the NEDS uniquely captures outcomes related to ED services. In a separate study using the NEDS, Anand did identify a decrease in syncope related hospitalizations, but hospital cost was not assessed (18). Neither study explored detailed regional trend analysis that might have added to these findings. Despite the development and promulgation of syncope guidelines, our data supports significant variability in regional hospitalization rates even after adjusting for confounders. Such variability may be due to lack of standardization in ED syncope management.
This heterogeneity among hospital regions is not clear given the novelty of our regional findings, available literature is sparse and causality will need to be determined from non-observational studies. However, a plausible explanation for variability in rates of hospitalizations may be regional availability of ED observational units. For example, it has been reported that Southern hospitals have a lower percent of ED observational units compared to Western hospitals (19). This may explain the lower hospitalization rates we observed in Western compared to Southern hospitals in our study as observational status would not be counted as a hospitalization. Additionally, literature suggests that academic hospitals have higher admission rates for syncope when compared to health maintenance organizations that have close outpatient follow up. In our study, Northeastern hospitals were most likely academic and had the highest admissions for syncope versus Western hospitals, which had the least academic hospitals, and lower admissions for syncope (20). We addressed this possibility in our study by adjusting for hospital academic status. It is encouraging that hospitalizations for syncope in all studied regions has significantly decreased over time, and adoption of some form of standardization tools may eventually and positively narrow the gap in these regional differences. However, Quinn et al reported that standardization of any protocol is dependent on both inter and intra-regional variability of risk-stratification protocols along with clinical judgment and comfort level among ED physicians (21, 22). Thus, future studies may further investigate regional differences in development and adoption of standardization protocols, which may further reveal resource or culture limitations/barriers to effective implementation. That said, our study is consistent with previous studies, in that we observed a substantial decline in overall hospital admission rate over time (5, 21, 23–24). As also noted by Anand, this may be due to implementation of guidelines with general implementation (14), though as we have stated earlier, regional nuances need to be tackled to address disparate work up and management of syncope.
Similar to earlier studies, our data shows an incremental up-trend in ED service charges. In addition, trends across the geographic regions seem to mirror the overall trend. An increase in ED charges is likely reflective of either over utilization of advanced imaging or extended care provided in the ED under observation status (23). Although we didn’t explore the expenses related to advance imaging, we know that charges associated with advanced imaging in the ED is more expensive as compared to the inpatient or outpatient setting (23). In addition to lack of standardization of syncope risk-stratification protocols, other possible explanations for variance in admission rate and ED service charges can be explained by average number of hours spent in the ED for care of syncope. Similar regional variation has also been reported in Canada, where disparities exist for ED utilization of work up, disposition and serious outcome (24–26). The standardization of risk-stratification based on work up/scheme is also important because of recurrent admissions for syncope are on the rise, with up to 50% being readmitted from the ED with no underlying etiological cause defined. (27).
We observed overall increase in ED service charges for syncope patients in the ED both throughout the years 2006–2014 and all regions, which might have been partially due to over utilization of invasive cardiac and neurological imaging that is on the rise over the last 10 years (2, 28). Furthermore, we also report slight statistically significant decrease in mortality in the West, hence higher service charges in the West may suggest that these patients had more diagnostic testing and management in the ED. It is also possible that fewer admissions in the West coincided with fewer observed deaths (such as patients more likely to be under observation status in the West and thus not captured in NEDS). Further studies are required to identify the key regional differences in the management of these patients in the ED.
Our study using NEDS had several limitations that are notable to mention. First, NEDS is an administrative database dependent on correct incorporation of ICD-9 codes. Errors can arise if codes were not entered or incorporated inaccurately. Second, NEDS lacks comprehensive laboratory, medication and imaging data. Third, this is a retrospective analysis of the US claims database using the ICD-9 code 780.2, which included not just syncope but also collapse, a vague diagnosis that could, among other conditions, incorporate accidental falls and undiagnosed epilepsy. Thus risk of outcome disease misclassification still exists. Fourth, the NEDS database does not include data on specific testing or procedures that might have been scheduled after dismissal from the hospital. Thus, certain costs may be underestimated. Fifth, cause of death is not available in the NEDS database. The latter deficiency limits our ability to determine whether the death was related to syncope or to comorbidities. Lastly, it is possible that confounders from unmeasured variables were not addressed, which is a common problem with observational studies. That said, we attempted to follow similar studies using the NEDS on previously established common confounders. NEDS coding does not allow us to differentiate between patients admitted for the first vs recurrent syncope, the workup and outcomes of which are likely to be significantly different. The strengths of the study however are that NEDS represents up to 45 or 46 states, and results reflect what can be expected in the larger population.
Conclusion
Our study suggests that there are significant regional differences in rate of hospitalization and ED service charges for patients presenting to the emergency department with syncope. Future studies are needed to explore reasons for these regional differences including utilization of advance imaging and number of hours spent in ED care vs the inpatient setting.
Supplementary Material
Funding Sources, and Acknowledgements:
This research was supported in part by the Intramural research Program of the NIH, National institute on Aging.
Footnotes
Disclaimer: The views expressed in this manuscript are those of the authors and do not necessarily reflect the official policy or position of Fort Belvoir Community Hospital, the Defense Health Agency, the Department of Defense, or the U.S. Government.
Conflict of Interest: All authors report no conflict of interest germane to this paper.
Reference:
- 1.Task Force for the Diagnosis and Management of Syncope; European Society of Cardiology (ESC); European Heart Rhythm Association (EHRA); Heart Failure Association (HFA); et al. Guidelines for the diagnosis and management of syncope (version 2009). Eur Heart J 2009;30:2631–71. [DOI] [PMC free article] [PubMed] [Google Scholar]
- 2.Probst MA, Kanzaria HK, Gbedemah M, Richardson LD, Sun BC. National trends in resource utilization associated with ED visits for syncope. Am J Emerg Med 2015;33 (8):998–1001 [DOI] [PMC free article] [PubMed] [Google Scholar]
- 3.Toarta C, Mukarram M, Diercks D, et al. Syncope Prognosis Based on Emergency Department Diagnosis: A Prospective Cohort Study. Academic Emergency Medicine (AEM)[serial online]. April 1, 2018;25(4):388–396. [DOI] [PubMed] [Google Scholar]
- 4.Shin TG, Kim JS, Song HG, Jo IJ, Sim MS, Park SJ. Standardized approaches to syncope evaluation for reducing hospital admissions and costs in overcrowded emergency departments. Yonsei Med J. 2013;54(5):1110–1118. doi: 10.3349/ymj.2013.54.5.1110 [DOI] [PMC free article] [PubMed] [Google Scholar]
- 5.Chou SC, Nagurney JM, Weiner SG, Hong AS, Wharam JF. Trends in advanced imaging and hospitalization for emergency department syncope care before and after ACEP clinical policy. Am J Emerg Med. 2019;37(6):1037–1043. doi: 10.1016/j.ajem.2018.08.043 [DOI] [PMC free article] [PubMed] [Google Scholar]
- 6.Schuur JD, Baugh CW, Hess EP, Hilton JA, Pines JM, Asplin BR Critical pathways for post-emergency outpatient diagnosis and treatment: tools to improve the value of emergency care. Acad Emerg Med. 2011. Jun; 18(6):e52–63.) [DOI] [PMC free article] [PubMed] [Google Scholar]
- 7.Linzer M, Yang EH, Estes NA 3rd, et al. Diagnosing syncope. Part 1: Value of history, physical examination, and electrocardiography. Clinical Efficacy Assessment Project of the American College of Physicians. Ann Intern Med 1997;126(12):989. [DOI] [PubMed] [Google Scholar]
- 8.Sun BC, Emond JA, Camargo CA Jr. Direct medical costs of syncope-related hospitalizations in the United States. Am J Cardiol 2005; 95:668–671 [DOI] [PubMed] [Google Scholar]
- 9.Linzer M, Yang EH, Estes III NA, Wang P, Vorperian VR, KapoorDiagnosing syncope WN. Part 1: value of history, physical examination, and electrocardiography. Clinical Efficacy Assessment Project of the American College of Physicians. Ann Intern Med, 126 (1997), pp. 989–996 [DOI] [PubMed] [Google Scholar]
- 10.Shen WK, Sheldon RS, Benditt DG, Cohen MI, Forman DE, Goldberger ZD, Grubb BP, Hamdan MH, Krahn AD, Link MS, Olshansky B, Raj SR, Sandhu RK, Sorajja D, Sun BC, Yancy CW 2017 ACC/AHA/HRS Guideline for the Evaluation and Management of Patients With Syncope: A Report of the American College of Cardiology/American Heart Association Task Force on Clinical Practice Guidelines and the Heart Rhythm Society. J Am Coll Cardiol. 2017. Aug 1; 70(5):e39–e110. [DOI] [PubMed] [Google Scholar]
- 11.Brignole Michele, Moya Angel, de Lange Frederik J, Jean-Claude, Elliott Perry M, Fanciulli Alessandra, Fedorowski Artur, Furlan Raffaello, Anne Kenny Rose, Martín Alfonso, Probst Vincent, Reed Matthew J, Rice Ciara P, Sutton Richard, Ungar Andrea, van Dijk J Gert, 2018 ESC Guidelines for the diagnosis and management of syncope, European Heart Journal, Volume 39, Issue 21, 01 June 2018, Pages 1883–1948. [DOI] [PubMed] [Google Scholar]
- 12.U.S. Agency for Healthcare Research and Quality. Overview of the Nationwide Emergency Department Sample. Available at: https://www.hcup-us.ahrq.gov/nedsoverview.jsp Published March 2018. Accessed December 27, 2019. [Google Scholar]
- 13.Probst MA, Kanzaria HK, Gbedemah M, Richardson LD, & Sun BC (2015). National trends in resource utilization associated with ED visits for syncope. American Journal of Emergency Medicine, 33(8), 998–1001. [DOI] [PMC free article] [PubMed] [Google Scholar]
- 14.Anand V, Benditt DG, Adkisson WO, Garg S, George SA, & Adabag S. (2018). Trends of hospitalizations for syncope/collapse in the United States from 2004 to 2013–An analysis of national inpatient sample. Journal of Cardiovascular Electrophysiology, 29(6), 916–922. [DOI] [PubMed] [Google Scholar]
- 15.Sun B, Derose S, Liang L, & Gabayan G. (2009). Predictors of 30-day serious events in older patients with syncope. Annals of Emergency, 54(May), 769–778. [DOI] [PMC free article] [PubMed] [Google Scholar]
- 16.U.S. Agency for Healthcare Research and Quality. NEDS Description of Data Elements. https://www.hcup-us.ahrq.gov/db/nation/neds/nedsdde.jsp Published July, 2018. Accessed December 27, 2019. [Google Scholar]
- 17.United States Department of Labor. Bureau of Labor Statistics. CPI Inflation Calculator. http://www.bls.gov/data/inflation_calculator.htm Accessed December 27, 2019. [Google Scholar]
- 18.Anand VGS, Benditt D, Adkisson W, Adabag S. Trends of emergency department visits for syncope/collapse in USA: Analysis of 2006–2013 National Emergency Department Sample database. Abstract. Circulation. 2016;134:A17264. [Google Scholar]
- 19.Wiler JL, Ross MA, Ginde AA. National Study of Emergency Department Observation Services. Acad Emerg Med. 2011. Sep;18(9):959–65. [DOI] [PubMed] [Google Scholar]
- 20.Sun BC, Emond JA, Camargo CA Jr. Characteristics and admission patterns of patients presenting with syncope to U.S. emergency departments, 1992–2000. Acad Emerg Med. 2004;11(10):1029–1034. [DOI] [PubMed] [Google Scholar]
- 21.Kessler C, Tristano J. and De Lorenzo R. (2010). The Emergency Department Approach to Syncope: Evidence-based Guidelines and Prediction Rules. Emergency Medicine Clinics of North America, 28(3), pp.487–500. [DOI] [PubMed] [Google Scholar]
- 22.Quinn J. (2003). San Francisco Syncope Rule (SFSR) vs Physician Judgment for Predicting Patients with Serious Outcomes. Academic Emergency Medicine, 10(5), pp.539-b-540. [Google Scholar]
- 23.Anderson T, Thombley R, Dudley R. and Lin G. (2018). Trends in Hospitalization, Readmission, and Diagnostic Testing of Patients Presenting to the Emergency Department With Syncope. Annals of Emergency Medicine, 72(5), pp.523–532. [DOI] [PubMed] [Google Scholar]
- 24.Sandhu R, Sheldon R, Savu A. and Kaul P. (2017). Nationwide Trends in Syncope Hospitalizations and Outcomes From 2004 to 2014. Canadian Journal of Cardiology, 33(4), pp.456–462. [DOI] [PubMed] [Google Scholar]
- 25.Abulhamayel A, Savu A, Sheldon R, Kaul P. and Sandhu R. (2018). Geographical Differences in Comorbidity Burden and Outcomes in Adults With Syncope Hospitalizations in Canada. Canadian Journal of Cardiology, 34(7), pp.937–940. [DOI] [PubMed] [Google Scholar]
- 26.Thiruganasambandamoorthy V, Taljaard M, Stiell I, Sivilotti M, Murray H, Vaidyanathan A, Rowe B, Calder L, Lang E, McRae A, Sheldon R. and Wells G. (2015). Emergency department management of syncope: need for standardization and improved risk stratification. Internal and Emergency Medicine, 10(5), pp.619–627. [DOI] [PubMed] [Google Scholar]
- 27.Califf T. (2017). Syncope: Outcomes and Conditions Associated with Hospitalization. The Journal of Emergency Medicine, 53(3), pp.448–449. [Google Scholar]
- 28.Edvardsson N, Garutti C, Rieger G. and Linker N. (2014). Unexplained Syncope: Implications of Age and Gender on Patient Characteristics and Evaluation, the Diagnostic Yield of an Implantable Loop Recorder, and the Subsequent Treatment. Clinical Cardiology, 37(10), pp.618–625. [DOI] [PMC free article] [PubMed] [Google Scholar]
Associated Data
This section collects any data citations, data availability statements, or supplementary materials included in this article.


