Abstract
Diffusion tensor imaging (DTI) and fiber tracking (FT) were used to measure the occipital lobe fiber tracts connecting the two hemispheres in individual human subjects. These tracts are important for normal vision. Also, damage to portions of these tracts is associated with alexia. To assess the reliability of the DTI-FT measurements, occipital-callosal projections were estimated from each subject's left and right hemispheres independently. The left and right estimates converged onto the same positions within the splenium. We further characterized the properties of the estimated occipital-callosal fiber tracts by combining them with functional MRI. We used functional MRI to identify visual field maps in cortex and labeled fibers by the cortical functional response at the fiber endpoint. This labeling reveals a regular organization of the fibers within the splenium. The dorsal visual maps (dorsal V3, V3A, V3B, V7) send projections through a large band in the middle of the splenium, whereas ventral visual maps (ventral V3, V4) send projections through the inferior-anterior corner of the splenium. The agreement between the independent left/right estimates, further supported by previous descriptions of homologous tracts in macaque, validates the DTI-FT methods. However, a principal limitation of these methods is low sensitivity: a large number of fiber tracts that connect homotopic regions of ventral and lateral visual cortex were undetected. We conclude that most of the estimated tracts are real and can be localized with a precision of 1-2 mm, but many tracts are missed because of data and algorithm limitations.
Keywords: diffusion imaging, occipital lobe, splenium, visual cortex, alexia
The white matter fiber tracts connecting widely separated cortical regions are important for neural information processing. Identifying such fiber tracts in animal models usually involves measuring degenerating axons subsequent to lesion, or using active transport of tracers that are injected while the animal is still alive (e.g., refs. 1 and 2). In human, controlled lesions and tracers are rarely used and only in certain patient populations; hence, information about normal human white matter tracts has been difficult to obtain and is limited in scope (3, 4).
The magnetic resonance imaging method of diffusion tensor imaging (DTI), coupled with fiber-tracking (FT) algorithms, promises to provide substantial information about human fiber tracts. The first reports using DTI-FT were quite exciting (5-13). Investigators showed that large fiber tracts known to exist in the human brain could be identified. However, the validity of new DTI-FT discoveries and the precision of tract estimates have yet to be established.
Here we describe DTI-FT measurements in human occipital lobe, focusing on fiber tracts that pass through the corpus callosum (occipital-callosal fiber tracts). The data obtained from the left and right occipital lobes provide independent estimates of the occipital-callosal fiber tracts. By comparing the relative positions and properties of these estimated tracts, we evaluate the precision of the DTI-FT methods within individual subjects. Furthermore, we combine DTI-FT methods with functional MRI (fMRI) visual field map measurements to subdivide the estimated tracts within the callosum. Specifically, the gray matter closest to the endpoints of the estimated fiber tracts is identified, and the gray matter fMRI properties are associated with these tracts. Finally, we estimate the paths of these tracts within the white matter; mapping the topography of these callosal pathways is critical for understanding the consequences of white matter lesions in the human brain (14-16).
We find good agreement of the positions where the left and right occipital lobe fiber tracts meet in the splenium. We further find a general organization of these tracts within the splenium: dorsal visual areas (dorsal V3, V3A, V3B, and V7) send projections that pass through a large band in the middle of the splenium, whereas ventral visual area projections (ventral V3 and V4) pass through the inferior-anterior corner of the splenium. A principal limitation of the DTI-FT methods is low sensitivity: a large number of expected fiber tracts that connect homotopic regions of ventral and lateral visual cortex are undetected. We conclude that most of the estimated tracts are real and can be localized with a precision of 1-2 mm, but many tracts are missed because data and algorithm limitations. These missed tracts provide a practical goal to strive for as the diffusion measurements and fiber tracking algorithms improve.
Methods
All subjects were volunteers recruited from the Stanford campus. The main results are shown for three males (ages 35, 44, and 53 years) and one female (age 33 years). Additional DTI data were collected on 10 other adult subjects, and these data confirm the basic DTI-FT findings. We do not have visual field maps on all of these subjects, and thus they are not included in the analyses below. Written informed consent was obtained from all subjects and the Stanford Panel on Human Subjects in Medical and Non-Medical Research approved all procedures.
Diffusion Tensor Imaging. DTI data were acquired on 1.5T Signa LX (Signa CVi, GE Medical Systems, Milwaukee, WI) using a self-shielded, high-performance gradient system capable of providing a maximum gradient strength of 50 mT/m at a gradient rise time of 268 μs for each of the gradient axes. A standard quadrature head coil, provided by the vendor, was used for excitation and signal reception. Head motion was minimized by placing cushions around the head and securing a Velcro strap across the forehead.
The DTI pulse sequence was a diffusion-weighted single-shot spin-echo, echo planar imaging sequence [echo time (TE) = 63 ms; repetition time (TR) = 6 s; field of view (FOV) = 260 mm; matrix size = 128 × 128; bandwidth =±110 kHz; partial k-space acquisition]. We acquired 48-54 axial, 2-mm-thick slices (no skip) for two b values, b = 0 and b = ≈800 s/mm2. The high b value was obtained by applying gradients along 12 different diffusion directions. Two gradient axes were energized simultaneously to minimize TE: G0 = (0 0 0)T, G1 = 1/√2 (1 1 0)T, G2 = 1/√2 (101)T, G3 = 1/√2 (0 1 1), G4 = 1/√2 (-110)T, G5 = 1/√2 (-1 0 1)T, and G6 = 1/√2 (0-1 1). This pattern was repeated twice for each slice. The polarity of the effective diffusion-weighting gradients was reversed for odd repetitions to remove cross-terms between diffusion gradients and both imaging and background gradients. Thus, each scan involved collecting 13 whole-brain volumes (12 at b = 800 and one at b = 0). Each scan was acquired in ≈80 s and the scans were repeated 8-14 times, for a total DTI scan time of 12-20 min. The repeats were averaged to improve signal quality.
DTI data were preprocessed by using a custom program based on normalized mutual information that removed eddy current distortion effects and determined a constrained nonrigid image registration (17). The six elements of the diffusion tensor were determined by multivariate regression using matrix calculations on a per voxel basis (18, 19). The orientation (eigenvectors) and magnitude (eigenvalues) of the principal axes of the diffusion tensor can be derived by means of the singular value decomposition. The fractional anisotropy was calculated by using the three principal diffusivities and the mean diffusivity (18, 19).
fMRI. fMRI data were acquired on a GE 3T Signa LX scanner using a custom-built high-gain head coil. Subjects' heads were fixed throughout the measurement period by a bite bar or snug-fitting pads. All subjects had previous experience with functional MR scans. Retinotopic maps were measured by using conventional expanding ring and rotating wedge stimuli (20-23). We analyzed fMRI data using custom software (mrvista; freely available at http://white.stanford.edu/software).
The gray and white matter was segmented for each subject by using anatomical T1-weighted images optimized for gray-white matter contrast (3D SPGR, 1 echo, minimum TE, 15° flip angle, two excitations, 124 sagittal slices, 0.94 × 0.94 mm in-plane, 1.2 mm slice thickness) using custom software (24). The white matter in the occipital lobe was hand-edited to minimize segmentation errors (25). The white/gray boundary surface was rendered either as an inflated three-dimensional surface or as a flattened two-dimensional map (26).
Additional details can be found in ref. 25.
Fiber-Tracking Algorithms and Software. The fiber-tracking analyses and visualization were performed with custom software that includes a combination of matlab code (MathWorks, Natick, MA) and compiled C/C++ code. All of this software, including source code, can be obtained from the authors upon request.
For each subject, the T2-weighted (b = 0) images were coregistered to the T1-weighted 3D SPGR anatomical images. The coregistration was initiated by using the scanner coordinates stored in the image headers to achieve an approximate alignment. This alignment was refined by using a mutual-information 3D rigid-body coregistration algorithm from spm2 (27). Several anatomical landmarks, including the anterior commissure (AC), the posterior commissure (PC), and the mid-sagittal plane, were identified by hand in the T1 images. With these landmarks, we computed a rigid-body transform from the native image space to the conventional AC-PC aligned space. The DTI data were then resampled to this AC-PC-aligned space with 2-mm isotropic voxels by using a spline-based tensor interpolation algorithm (28), taking care to rotate the tensors to preserve their orientation with respect to the anatomy (29). The T1 images were resampled to AC-PC-aligned space with 1-mm isotropic voxels. We confirmed that this coregistration technique aligns the DTI and T1 images to within 1-3 mm. However, the well known geometric distortions inherent in echo-planar image acquisition limit the accuracy in regions prone to susceptibility artifacts, such as orbito-frontal and anterior temporal regions.
Fiber tracts were estimated using a streamlines tracking algorithm (5, 8, 11) with a fourth-order Runge-Kutta path integration method (30) and 1-mm fixed step size. A continuous tensor field was estimated by using trilinear interpolation of the tensor elements. Path tracing proceeded until the fractional anisotropy fell below 0.2, or until the minimum angle between the current and previous path segments was >30°. Both directions from the initial seed point principal diffusion axis were traced.
The seed points were laid down in a grid that filled the left or right occipital lobe white matter with 1-mm spacing. In each hemisphere, ≈12,000 estimated fiber paths were identified by using these parameters. Because we focused on callosal projections for these analyses, only those fiber paths that passed through the corpus callosum were retained. This was typically ≈15% of the total left or right occipital lobe fibers.
fMRI and DTI data were combined by determining whether each fiber tract could be associated with a cortical region of interest (ROI). To decide on an association between the tract and cortex, we used the location of the fiber path endpoints. The endpoints are the last point tracked in each of the two initial directions before the tracking algorithm terminates. All fibers with an endpoint within 2 mm of the cortical ROI were found. These fibers were associated with the cortical points closest to their endpoints. Fibers with endpoints further than 2 mm from cortical ROIs were not assigned any functional properties.
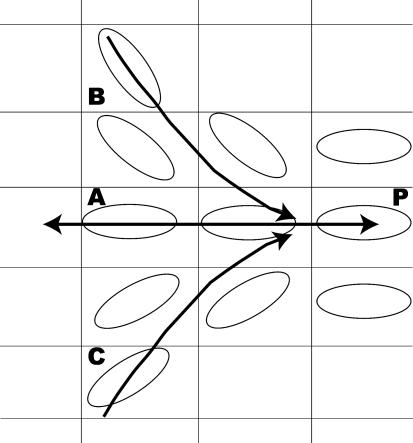
It is important to note that all discrete DTI-FT algorithms, including the algorithm used here, are noncommutative. This is easiest to see by imagining a single point, P, in the continuous tensor field, where P is surrounded by tensors that are all oriented toward P. Seeding the neighbors of P will result in multiple fibers that converge on P. However, seeding P itself will result in exactly one fiber, whose direction is determined by the orientation of the tensor at P. An example is shown in Fig. 1 (see also ref. 31).
Fig. 1.
Noncommutative nature of fiber tracking algorithms. The illustration shows a set of sampled diffusion tensors, drawn in two-dimensions (ellipses). Seeding locations A, B, and C will result in multiple fibers that converge onto P. However, seeding only P will result in one fiber between P and A.
The corpus callosum is a good example of such a convergence zone. Multiple fiber tracts come together into a compact bundle at the corpus callosum. By seeding all of the voxels in a hemisphere and tracking fibers into the corpus callosum, we can identify the separate fiber tracts before they converge. Once multiple fibers tracts converge onto a single voxel, we cannot expect to estimate accurately the continuation of these paths. However, we can track all of the fibers from the other hemisphere and discover where they converge on the callosum. Thus, by analyzing the hemispheres separately, we avoid some of the ambiguity inherent in tracking through the corpus callosum.
The results presented here are for a specific set of DTI-FT algorithms, as described above. We also tried several other DTI-FT algorithms, including a fixed step-size Euler path integration variant of the Runge-Kutta algorithm described above. For our data, the simple Euler algorithm produced nearly identical results to the more complex Runge-Kutta algorithm. None of the parameter values used in the algorithm described above were critical for the results presented below. We tried different parameter values and concluded that changing the values by ≈20% in either direction produced essentially the same results.
Results
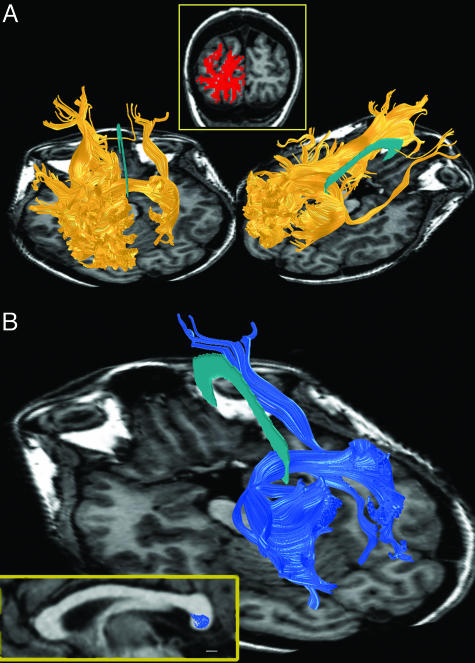
Estimated FTs in the Occipital Lobes. To identify occipital lobe fiber tracts, we first defined two volumes of interest (VOIs) comprising all of the white matter in each occipital lobe. We then used the FT algorithm (see Methods) to estimate two sets of fiber tracts: those passing through seed points in the left VOI and those passing through seed points in the right VOI. A complete set of estimated fiber tracts passing through the left VOI are shown in Fig. 2A for one representative subject. The images show a coronal view of the VOI (Fig. 2 Inset) and the estimated fiber tracts from two points of view.
Fig. 2.
Selecting occipital-callosal fiber tracts (subject S3). (A) Fiber tracts originating in seed points in the left occipital lobe. A VOI was selected in the left occipital lobe white matter. The red region in the upper image shows the VOI in a coronal slice. The three-dimensional renderings show two views of the fiber tract estimates. The cyan structure shown at the midline represents the corpus callosum. Only tracts exceeding 2 cm are shown. Fiber tracts that connect homotopic regions between the lateral and ventral surface are missing, presumably because of limitations in the methodology. (B) The subset of left occipital fibers that pass through the callosum. The Lower Left Inset (yellow box) shows the mid-sagittal plane. Blue regions indicate the pixels with at least one fiber passing through. Note that all of these occipital fibers pass through the lower half of the splenium. (Scale bar, 5 mm.)
Many of the estimated fiber tracts are contained entirely within the occipital lobes; many others project toward the ipsilateral temporal, parietal and frontal lobes. These estimated fiber tracts terminate near all regions of the cortical surface (medial, lateral, ventral, and dorsal). The DTI-FT estimates often include a fiber tract that crosses the callosum and connects to frontal cortex. However, we do not know whether this tract is real, especially given the limits of tracking through a convergence zone such as the callosum (see above). The spatial sampling resolution of the DTI measurements (2-mm voxels) is far too coarse for these tracts to correspond to individual fibers. Rather, the estimated tracts probably reflect axonal bundles. Furthermore, the absolute number of estimated fiber tracts (≈12,000 estimated fiber tracts with length >2 cm) does not measure the number of axons or axon bundles. The estimated number of fiber tracts varies proportionately with the spatial density of the seed points used to initiate the algorithm (see Methods).
Occipital-Callosal FTs. The images in Fig. 2 A reveal a large and complex set of estimated fiber tracts. Computational and visualization techniques are needed to examine the properties of these tracts (32, 33). A particularly useful method is to examine those fiber tracts that intersect a ROI. Fig. 2B illustrates the estimated occipital fiber tracts that pass through the corpus callosum and connect the two hemispheres. These comprise ≈15% of the original left occipital lobe estimates. The location within the splenium (the posterior callosum) of the fiber tract estimates from the left hemisphere is shown in the Lower Left Inset of Fig. 2B. Fig. 2B shows that at this spatial resolution the DTI-FT methods follow mostly those callosal tracts projecting to the dorsal and medial surface of cortex. We suspect that callosal tracts projecting to the lateral and ventral surfaces exist (4, 34) but are not identified by these methods.
Comparison of Right and Left Occipital-Callosal FT Positions. It is a remarkable fact of the human brain that the widely distributed occipital fibers converge to cross the callosum as a compact fiber bundle confined to the splenium. The organization and information carried by these fibers is of great interest, because sectioning these fibers causes significant problems for visual recognition and identification (35-37). Furthermore, white matter lesions in and near the splenium can lead to alexia (16).
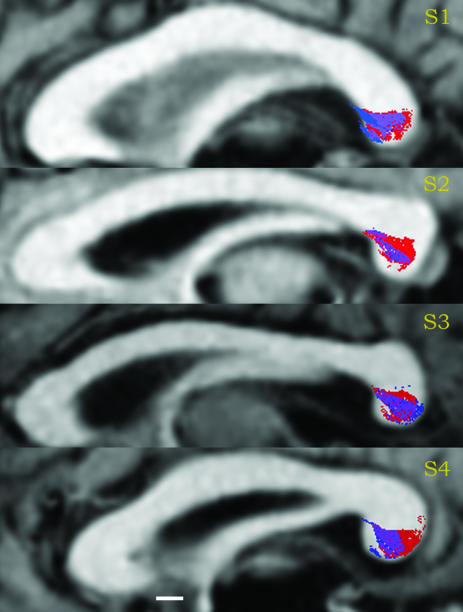
Fig. 3 shows DTI-FT estimates of where the occipital-callosal fibers pass through the mid-sagittal plane. Estimates beginning in the left (blue) and right (red) occipital lobes are shown, along with the regions of overlap (magenta). The positions of these estimated fiber tracts, derived independently from the left and right data sets, agree well with one another. The two estimates converge on a small region in the lower half of the splenium. The average cross-sectional area occupied by these estimated tracts is 75 mm2, and the centers of mass of the left and right regions agree to within 1-2 mm. In all four subjects, the left occipital lobe was slightly larger than the right (by ≈10%). Thus, the left fiber set was grown from a larger set of seed points and included more estimated fiber tracts. This may account for the left bias in Fig. 3, especially for subjects S2 and S4. Furthermore, fibers in the left occipital lobe tended to reach the cortical surface more often because the white matter regions reaching into the cortical folds were larger.
Fig. 3.
Agreement of left and right estimated occipital-callosal fiber positions in four subjects. A mid-sagittal slice containing the corpus callosum is shown, with the splenium on the right. Red indicates the positions of left occipital fibers, blue indicates the positions of right occipital fibers, and purple indicates the region of overlap. (Scale bar, 5 mm.)
Any anatomical occipital-occipital fiber tract has a single crossing point in the splenium. When these fibers are properly identified by DTI-FT algorithms, the estimated splenial crossing from the left and right data sets must be identical. There are two general reasons why a splenial location would be identified in one estimate but not the other. First, a fiber tract may pass from the occipital lobe through splenium without continuing to the contralateral occipital lobe. Second, the DTI-FT algorithm may have made one of two types of errors. The algorithm may correctly estimate one side of the fiber tract, say in the left occipital lobe, but fail to identify the matching portion of the fiber tract in the right lobe. Alternatively, the estimated occipital-callosal tract may not exist.
We take the agreement in position and size of these splenial crossing regions as an indication that the DTI-FT methods provide a generally accurate estimate of these fiber tracts. That is, we believe that the estimated fibers exist. About one-third to one-half of the estimated tracts do not have a corresponding estimated tract in the opposite hemisphere. These fibers may project to a different contralateral lobe, or they may be missed because of low sensitivity.
Organization of FTs Within the Splenium. We can further characterize the properties of the estimated occipital-callosal fiber tracts by combining fMRI data with estimated fiber tracts. We make this connection by measuring functional responses in cortical locations near the estimated fiber endpoints and then assigning these responses to the estimated fiber.
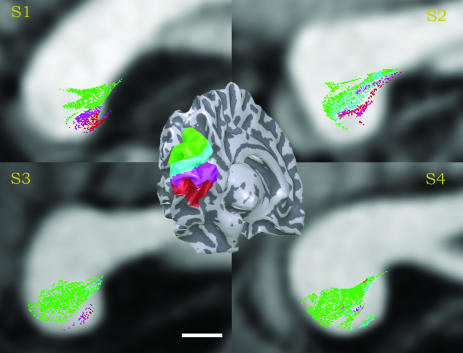
Visual Field Map Representations. Fig. 4 Inset shows a division of the occipital lobe into several regions. These regions are defined by grouping measured visual field maps into four general regions: a dorsal region that includes the V3, V3A, V3B, and V7 maps (green), a region representing the lower visual field maps in V1/V2 (cyan), a region representing the upper visual field near the V1/V2 maps (magenta), and a ventral region that includes the V3 and hV4 maps (red). Fig. 4 Inset shows the position of these four regions in subject S4; similar results were obtained in all of the subjects (38, 39).
Fig. 4.
Occipital-callosal fibers labeled by the position of the endpoint with respect to cortical visual field maps. (Inset) The locations of four cortical ROIs: dorsal V3, V3A, V3B, and V7 (green), dorsal V1 and V2 (cyan), ventral V1 and V2 (magenta), and ventral V3 and hV4 (red). The four main images show a mid-sagittal slice for each subject. In these images, the fiber positions are colored according to the cortical ROI closest to the fiber endpoint. For the left occipital-callosal fibers, the leftmost endpoint is compared to the left hemisphere ROIs, and correspondingly for the right. The estimated callosal positions of fibers associated with each of the ROIs are similar for left and right hemispheres, so the union of the left and right estimates is shown. All fibers with an endpoint within 2 mm of one of these cortical regions are included. (Scale bar, 5 mm.)
Many of the estimated occipital-callosal fibers have endpoints that fall near one of these regions. In Fig. 4, we color the occipital-callosal fibers according to the position of their endpoints with respect to these regions on the cortical surface, many centimeters away. The largest group (green/cyan) comprises the estimated fiber tracts with endpoints in the dorsal region. We see these fibers consistently in all four subjects, and their position within the splenium is consistent as well. The center of mass of the estimated fibers with an endpoint in the ventral cortical regions (magenta/red) is reliably located inferior to the dorsal fibers.
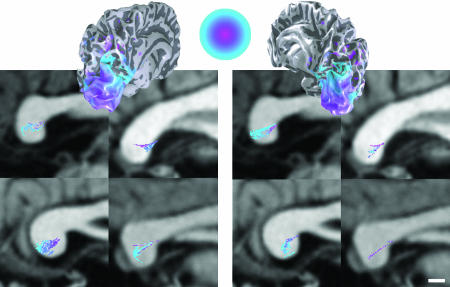
Eccentricity Representations. The largest group of estimated splenial fibers terminates near the cortical surface at the dorsal visual field maps. There are enough fibers in this estimated tract to create a meaningful splenial map of visual eccentricity. The map is produced by using fMRI to measure the visual eccentricity that evokes the most powerful response in each cortical location. We assign a color to each of the estimated fibers by identifying the preferred eccentricity at the cortical position closest to the fiber's endpoint (Fig. 5). Hence, the colors shown in the splenium reflect the fMRI eccentricity map measured on the cortical surface, several centimeters away. The map in the splenium suggests a representation from fovea to periphery that runs in the anterior-posterior direction. These eccentricity maps are consistent in most, but not all, subjects. We believe that the relationship between visual eccentricity and splenial position is just at the edge of the resolution at which we obtain reliable results.
Fig. 5.
Dorsal occipital-callosal fibers labeled by the position of the endpoint with respect to the cortical eccentricity representation. Typical eccentricity maps measured by using fMRI data are shown in two hemispheres (subject S4). The color map shows the representation to 16° eccentricity (purple, fovea; cyan, periphery). The image sections show the splenium of the corpus callosum from four subjects. Estimates from the left and right hemispheres are shown at Left and Right, respectively. All occipital-callosal fibers with an endpoint within 2 mm of the dorsal region, comprising V3, V3A, V3B, and V7, are colored according to the eccentricity data. Other details are as in Fig. 4.
Discussion
The measurements described to this point analyze the locations and properties of estimated occipital fiber tracts as they pass through the corpus callosum. We have focused on these measurements for two reasons. First, the callosum is an important structure whose size and shape varies considerably across subjects. It is a key pathway for information flowing between the two hemispheres, and thus the organization of the information in this structure is of substantial interest (35, 36). Second, by focusing on the callosum, we could make DTI-FT estimates from two independent data sets. Comparing the estimates obtained separately from the left and right hemisphere within each subject provides a measure of validation of the DTI-FT measurements and algorithms.
The DTI-FT estimates shown here effectively identify certain groups of fibers, particularly medial fibers that pass through the callosum. Other fiber groups that are known to exist are not found; in particular, callosal fibers that interdigitate with other major fiber tracts as they project to the lateral and ventral surfaces. The inability to estimate these fibers is also evident in the published images from other groups (e.g., ref. 40 and Figs. 6 and 7). Regions where fibers cross or bend sharply are poorly fit by the tensor model. When the tensor approximation fails, tractography will also fail. Several diffusion imaging protocols that go beyond the tensor model have been developed (e.g., refs. 41-43). It may prove possible to track the more complex fiber pathways.
Fig. 6.
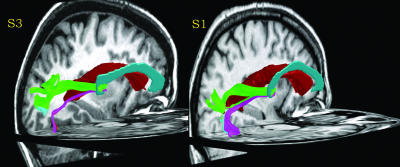
Three-dimensional renderings of the path followed by the occipital-callosal fiber tracts in the left hemisphere of two subjects. The left lateral ventricle is rendered in red. The corpus callosum is rendered in cyan. For clarity, only the left hemisphere portion of the fiber tracts is shown. The fiber tracts are labeled with the same color scheme as in Fig. 4.
Fig. 7.
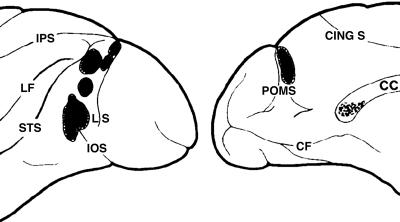
Splenial fibers in the macaque traced using autoradiography. Lateral (Left) and medial (Right) views of a left hemisphere are shown. The black blobs on the cortical surface indicate the tracer injection zones, and the dots in the corpus callosum (CC) indicate the labeled splenial fibers. These “area 19” injections appear to be primarily in dorsal visual areas, including dorsal V3 and quite likely V3A. Compare the labeled splenial region in macaque to the splenial map of the dorsal area projections in human (Fig. 4). (Modified from figure 1C of ref. 1.)
Given that the estimated tracts appear reliable, it seems useful to undertake two additional analyses. First, we would like to understand the path these tracts follow from the callosum toward the cortical surface. Second, we would like to compare the properties of these fiber tracts with similar measurements made by using anatomical methods in macaque.
Alexia and the Pathway from Splenium to Cortex. The path traced by the splenial fibers as they connect to the cortical surface is of particular interest for understanding alexia, an impairment of the ability to read after cortical damage despite intact visual perception. Alexia is often ascribed as a disruption in the white matter and termed a “disconnection syndrome” (14-16, 44). White matter disruption has also been implicated in developmental dyslexia (45, 46).
In a seminal paper, Binder and Mohr (16) measured the relationship between lesion locations and the type of reading deficit. They proposed that dominant posterior cerebral artery stroke damages one or several different white matter bundles that pass through the splenium. Depending on which pathway is damaged, the patient presents with a different type of reading loss. In their analysis of the relationship between the occipital-callosal pathways and alexia, Binder and Mohr (16) write: “If any [visual] callosal projections run inferomedial to the occipital ventricle [occipital horn of the lateral ventricle],... these are of little importance for reading since this white matter was commonly involved in patients in whom reading was normal” (p. 1882).
The DTI-FT analysis estimates the path followed by the occipital-callosal fiber tracts between the splenium and cortex. In our subjects, these tracts travel along routes such as those shown in Fig. 6. The bundles projecting to dorsal and ventral cortex course around the lateral ventricle in different positions. Fibers projecting to dorsal cortical regions (shown in green) tend to fall on the superior aspect of the occipital horn of the lateral ventricle. Fibers projecting to ventral cortex separate and follow a route medial and inferior to the ventricle (shown in magenta). We observed these diverging projections in all of our subjects (n = 4, eight hemispheres). These diverging projections have also been described in macaque and human by Wendell Krieg (ref. 34, see chapters 7 and 12).
Our data are consistent with the predictions made in Binder and Mohr (16) in that the principle destinations of the inferomedial projections connect the left and right upper vertical meridian representations of V1/V2 and perhaps V3/hV4. Damage to these fibers might produce subtle visual deficits along the vertical meridian, but this damage would not be expected to specifically interfere with reading.
The large set of dorsal projections spans much of the intraparietal sulcus. Little is known about the specific role of these cortical regions in perception, although they are not usually cited for having an involvement in object recognition or reading (39, 47). This portion of cortex has a visual field map that was revealed during a remembered saccade task (48).
Comparison to Macaque. Human corpus callosum has been only coarsely mapped, but nonhuman primate callosum has been examined in more detail using invasive techniques. In a series of studies, Pandya and colleagues mapped the entire macaque callosum (see ref. 49 for a review). Rockland and Pandya (1) used autoradiographic methods to map the posterior projections through the splenium. Fig. 7 contains a summary of their results, including the locations of the cortical injection sites anterior to the lunate sulcus on the lateral and dorsal surfaces. These injection sites probably include dorsal portions of the V3 visual field map, as well as V3A. If so, these sites correspond to the human dorsal cortical region (see Fig. 4 Inset). The labeled portion of the splenium in macaque (Fig. 7 Right) is strikingly similar to the portion of the splenium that connects to the corresponding dorsal cortical regions in human (Fig. 4, green).
Conclusions
The DTI-FT measurements reveal a spatial organization of occipital fibers within the human splenium. The estimated fiber tracts pass through the lower half of the splenium in a cross-sectional area somewhat less than 1 cm2. By associating the fibers in the splenium with the position of their endpoints in cortex, we have made functional maps of the splenium, revealing a dorsal to ventral organization that matches their position in cortex. Our data suggest that fibers connecting foveal-peripheral cortical representations are organized along an anterior-posterior axis within the splenium. As the fibers emerge from the splenium, they trace out several different pathways within the white matter and diverge around the lateral ventricles.
The DTI-FT comparison of left and right occipital-callosal fiber positions in the splenium suggests that estimated fiber tracts connecting the two hemispheres are reliable and located with good spatial precision. The absence of estimated occipital-callosal fiber tracts projecting to the lateral and ventral cortical surfaces suggests that the method has poor sensitivity, missing many real pathways. There are many opportunities to advance DTI-FT, both with respect to the measurements and algorithms. Although the limitations that are present in current measurements and methods are serious, new analytic and techniques should make it possible to improve fiber tract estimates.
Acknowledgments
We thank David Akers, Pat Hanrahan, and Anthony Sherbondy for useful discussions. Funding provided by National Institutes of Health Grants EY-015000 and EY-03164 and the Charles and Helen Schwab Foundation.
Author contributions: R.F.D., M.B.-S., R.B., A.A.B., and B.A.W. designed research; R.F.D., M.B.-S., and A.A.B. performed research; R.F.D., R.B., and B.A.W. contributed pulse sequences and analytic tools; R.F.D., M.B.-S., A.A.B., and B.A.W. analyzed data; and R.F.D., M.B.-S., and B.A.W. wrote the paper.
This paper was submitted directly (Track II) to the PNAS office.
Abbreviations: DTT, diffusion tensor imaging; FT, fiber tracking; fMRI, functional MRI; ROI, region of interest; VOI, volume of interest.
References
- 1.Rockland, K. S. & Pandya, D. N. (1986) Brain Res. 365, 174-178. [DOI] [PubMed] [Google Scholar]
- 2.Shipp, S. & Zeki, S. (1985) Nature 315, 322-325. [DOI] [PubMed] [Google Scholar]
- 3.Miklossy, J., Clarke, S. & Van der Loos, H. (1991) J. Neuropathol. Exp. Neurol. 50, 595-614. [PubMed] [Google Scholar]
- 4.Clarke, S. & Miklossy, J. (1990) J. Comp. Neurol. 298, 188-214. [DOI] [PubMed] [Google Scholar]
- 5.Basser, P. J., Pajevic, S., Pierpaoli, C., Duda, J. & Aldroubi, A. (2000) Magn. Reson. Med. 44, 625-632. [DOI] [PubMed] [Google Scholar]
- 6.Catani, M., Howard, R. J., Pajevic, S. & Jones, D. K. (2002) NeuroImage 17, 77-94. [DOI] [PubMed] [Google Scholar]
- 7.Catani, M., Jones, D. K., Donato, R. & Ffytche, D. H. (2003) Brain 126, 2093-2107. [DOI] [PubMed] [Google Scholar]
- 8.Conturo, T. E., Lori, N. F., Cull, T. S., Akbudak, E., Snyder, A. Z., Shimony, J. S., McKinstry, R. C., Burton, H. & Raichle, M. E. (1999) Proc. Natl. Acad. Sci. USA 96, 10422-10427. [DOI] [PMC free article] [PubMed] [Google Scholar]
- 9.Hagmann, P., Thiran, J. P., Jonasson, L., Vandergheynst, P., Clarke, S., Maeder, P. & Meuli, R. (2003) NeuroImage 19, 545-554. [DOI] [PubMed] [Google Scholar]
- 10.Jones, D. K., Griffin, L. D., Alexander, D. C., Catani, M., Horsfield, M. A., Howard, R. & Williams, S. C. (2002) NeuroImage 17, 592-617. [PubMed] [Google Scholar]
- 11.Mori, S., Crain, B. J., Chacko, V. P. & van Zijl, P. C. (1999) Ann. Neurol. 45, 265-269. [DOI] [PubMed] [Google Scholar]
- 12.Mori, S., Kaufmann, W. E., Davatzikos, C., Stieltjes, B., Amodei, L., Fredericksen, K., Pearlson, G. D., Melhem, E. R., Solaiyappan, M., Raymond, G. V., et al. (2002) Magn. Reson. Med. 47, 215-223. [DOI] [PubMed] [Google Scholar]
- 13.Moseley, M., Bammer, R. & Illes, J. (2002) Brain Cognit. 50, 396-413. [DOI] [PubMed] [Google Scholar]
- 14.Molko, N., Cohen, L., Mangin, J. F., Chochon, F., Lehericy, S., Le Bihan, D. & Dehaene, S. (2002) J. Cognit. Neurosci. 14, 629-636. [DOI] [PubMed] [Google Scholar]
- 15.Le, T. H., Mukherjee, P., Henry, R. G., Berman, J. I., Ware, M. & Manley, G. T. (2005) Neurosurgery 56, 189. [PubMed] [Google Scholar]
- 16.Binder, J. R. & Mohr, J. P. (1992) Brain 115, 1807-1826. [DOI] [PubMed] [Google Scholar]
- 17.Bammer, R. & Auer, M. (2001) in Proceedings of the 9th Annual Meeting of ISMRM, Glasgow, Scotland (Int. Soc. Magn. Reson. Med., Berkeley, CA), Vol. 9, pp. 508. [Google Scholar]
- 18.Basser, P. J. (1995) NMR Biomed. 8, 333-344. [DOI] [PubMed] [Google Scholar]
- 19.Basser, P. J. & Pierpaoli, C. (1996) J. Magn. Reson. B 111, 209-219. [DOI] [PubMed] [Google Scholar]
- 20.Engel, S. A., Rumelhart, D. E., Wandell, B. A., Lee, A. T., Glover, G. H., Chichilnisky, E. J. & Shadlen, M. N. (1994) Nature 369, 525. [DOI] [PubMed] [Google Scholar]
- 21.Sereno, M. I., Dale, A. M., Reppas, J. B., Kwong, K. K., Belliveau, J. W., Brady, T. J., Rosen, B. R. & Tootell, R. B. (1995) Science 268, 889-893. [DOI] [PubMed] [Google Scholar]
- 22.DeYoe, E. A., Carman, G. J., Bandettini, P., Glickman, S., Wieser, J., Cox, R., Miller, D. & Neitz, J. (1996) Proc. Natl. Acad. Sci. USA 93, 2382-2386. [DOI] [PMC free article] [PubMed] [Google Scholar]
- 23.Engel, S. A., Glover, G. H. & Wandell, B. A. (1997) Cereb. Cortex 7, 181-192. [DOI] [PubMed] [Google Scholar]
- 24.Teo, P. C., Sapiro, G. & Wandell, B. A. (1997) IEEE Trans. Med. Imaging 16, 852-863. [DOI] [PubMed] [Google Scholar]
- 25.Dougherty, R. F., Koch, V. M., Brewer, A. A., Fischer, B., Modersitzki, J. & Wandell, B. A. (2003) J. Vis. 3, 586-598. [DOI] [PubMed] [Google Scholar]
- 26.Wandell, B. A. & Wade, A. R. (2003) Neurol. Clin. 21, 417-443. [DOI] [PubMed] [Google Scholar]
- 27.Ashburner, J. & Friston, K. J. (2003) in Human Brain Function, eds. Frackowiak, R. S. J., Friston, K. J., Frith, C., Dolan, R., Price, C. J., Zeki, S., Ashburner, J. & Penny, W. D. (Academic, New York).
- 28.Pajevic, S., Aldroubi, A. & Basser, P. J. (2002) J. Magn. Reson. 154, 85-100. [DOI] [PubMed] [Google Scholar]
- 29.Alexander, D. C., Pierpaoli, C., Basser, P. J. & Gee, J. C. (2001) IEEE Trans. Med. Imaging 20, 1131-1139. [DOI] [PubMed] [Google Scholar]
- 30.Press, W. H., Teukolsky, S. A., Vetterling, W. T. & Flannery, B. P. (2002) Numerical Recipes in C++: The Art of Scientific Computing (Cambridge Univ. Press, Cambridge, U.K.).
- 31.Mori, S. & van Zijl, P. C. (2002) NMR Biomed, 15, 468-480. [DOI] [PubMed] [Google Scholar]
- 32.Akers, D., Sherbondy, A., Mackenzie, R., Dougherty, R. & Wandell, B. (2004) Proc. IEEE Vis. 10-15, 377-384. [DOI] [PubMed] [Google Scholar]
- 33.Sherbondy, A., Akers, D., Mackenzie, R., Dougherty, R. & Wandell, B. (2005) IEEE Trans. Vis. Comput. Graphics, in press. [DOI] [PubMed]
- 34.Krieg, W. J. S. (1963) Connections of the Cerebral Cortex (Brain Books, Evanston, IL).
- 35.Gazzaniga, M. S., Risse, G. L., Springer, S. P., Clark, D. E. & Wilson, D. H. (1975) Neurology 25, 10-15. [DOI] [PubMed] [Google Scholar]
- 36.Risse, G. L., Gates, J., Lund, G., Maxwell, R. & Rubens, A. (1989) Arch Neurol. 46, 437-443. [DOI] [PubMed] [Google Scholar]
- 37.Rubens, A. B., Risse, G. & Selnes, O. (1981) Neurology 31, 111-113. [DOI] [PubMed] [Google Scholar]
- 38.Wandell, B. A. (1999) Annu. Rev. Neurosci. 22, 145-173. [DOI] [PubMed] [Google Scholar]
- 39.Wandell, B. A., Brewer, A. A. & Dougherty, R. F. (2005) Proc. R. Soc. London 360, 10.1098/rstb.2005.1628. [DOI] [PMC free article] [PubMed]
- 40.Wakana, S., Jiang, H., Nagae-Poetscher, L. M., van Zijl, P. C. & Mori, S. (2004) Radiology 230, 77-87. [DOI] [PubMed] [Google Scholar]
- 41.Tuch, D. S. (2004) Magn. Reson. Med. 52, 1358-1372. [DOI] [PubMed] [Google Scholar]
- 42.Behrens, T. E., Woolrich, M. W., Jenkinson, M., Johansen-Berg, H., Nunes, R. G., Clare, S., Matthews, P. M., Brady, J. M. & Smith, S. M. (2003) Magn. Reson. Med. 50, 1077-1088. [DOI] [PubMed] [Google Scholar]
- 43.Jansons, K. M. & Alexander, D. C. (2003) Inf. Process Med. Imaging 18, 672-683. [DOI] [PubMed] [Google Scholar]
- 44.Dejerine, J. (1892) Mem. Soc. Biol. 4, 61-90. [Google Scholar]
- 45.Deutsch, G. K., Dougherty, R. F., Bammer, R., Siok, W. T., Gabrieli, J. D. & Wandell, B. (2005) Cortex, in press. [DOI] [PubMed]
- 46.Klingberg, T., Hedehus, M., Temple, E., Salz, T., Gabrieli, J. D., Moseley, M. E. & Poldrack, R. A. (2000) Neuron 25, 493-500. [DOI] [PubMed] [Google Scholar]
- 47.Grill-Spector, K. & Malach, R. (2004) Annu. Rev. Neurosci. 27, 649-677. [DOI] [PubMed] [Google Scholar]
- 48.Sereno, M. I., Pitzalis, S. & Martinez, A. (2001) Science 294, 1350-1354. [DOI] [PubMed] [Google Scholar]
- 49.Pandya, D. N. & Seltzer, B. (1986) in Two Hemispheres-One Brain: Functions of the Corpus Callosum, eds. Leporé, F., Ptito, M. & Jasper, H. H. (Liss, New York), pp. 47-73.


