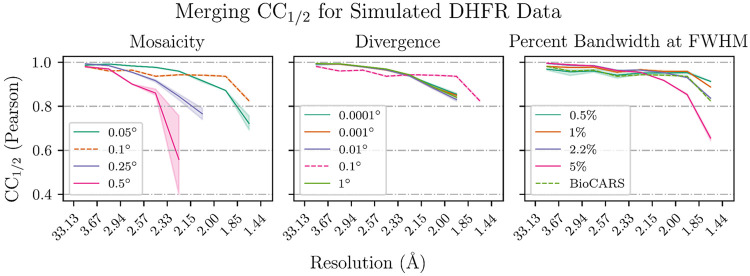
FIG. 6. Merging statistics for simulated data.
The Pearson binned by resolution is plotted for each varied parameter in the simulated data. Within each subplot, all parameters except for the labeled parameter are held constant. The dotted line represents the reference data set that is common to all three subplots. Bandwidths labeled as a percentage are Gaussian spectra centered on the BioCARS spectrum with bandwidths as labeled.

