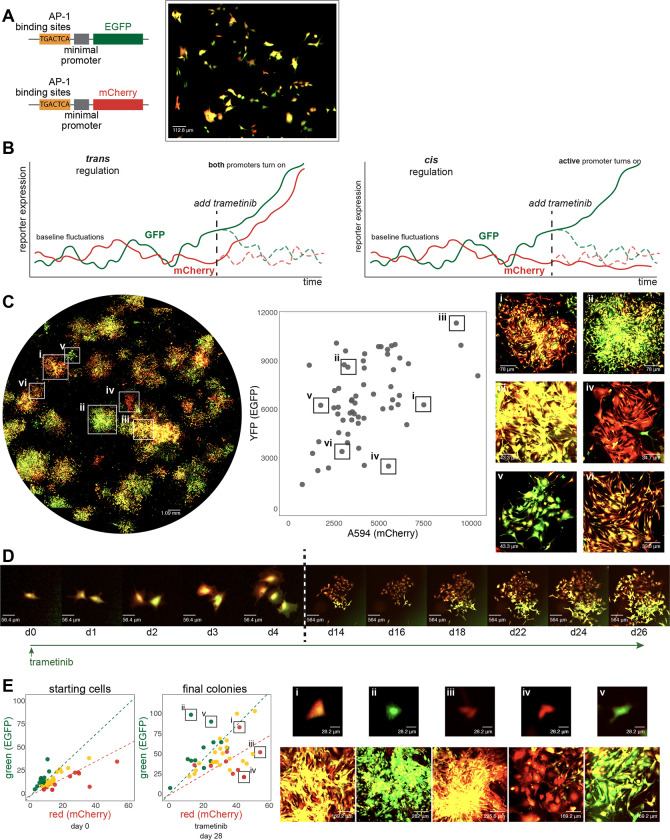
Figure 4: Characterization of AP-1 activity dynamics and memory in WM989 melanoma cells using a dual-color reporter system.
(A) Left: Diagram of two lentiviral constructs containing AP-1 binding sites (6 palindromic repeats of TGACTCA) upstream of a minimal promoter driving expression of either EGFP (top) or mCherry (bottom). Right: Image showing cell-to-cell variability in expression in a single-cell-derived clone of WM989 A6-G3 cells transduced with both reporter constructs (WM989 A6-G3-BE5) In addition to the BE5 line, we also isolated and validated 3 additional lines; CC10, DE5, AB1.
(B) Diagram comparing potential observations in this reporter system under two scenarios: sequence-dependent regulation (left) versus activity-dependent regulation (right) of memory.
(C) Left: Stitched 10x magnification image of a well containing WM989 A6-G3-BE5 AP-1 reporter cells treated with 1nM trametinib for 28 days. Middle: Scatter plot of fluorescence intensities of colonies formed in the image to the left (calculated as the 90th percentile intensity of each colony minus the mean of the median intensities of randomly selected areas without colonies). Right: Zoomed-in images of 6 selected colonies (i-vi) demonstrated variation in mCherry and EGFP ratios and intensities. These 6 colonies have been identified and labeled on both the scatter plot and the stitched well image.
(D) Time-lapse imaging of the formation of a resistant colony from WM989 A6-G3-BE5 AP-1 reporter cells over 26 days under treatment with 1nM trametinib (starting at day 0). Images from the first 4 days (d0-d4; left of the dotted line) have the same magnification, and images from the final 12 days (d14-d26; right of the dotted line) all have 10x lower magnification as the cells’ images on the left. Images were contrasted so that the background appears black for ease of visual comparison.
(E) Left: Scatter plots of fluorescence quantifications from Incucyte S3 images of WM989-A6-G3-BE5 cells treated with 1 nM trametinib for 28 days. Colonies were traced back through time-lapse images to identify their originating cells. The initial red-to-green fluorescence intensity ratio of these starting cells was used to categorize the initial ‘color’ of the cell (quantified as the mean of the cell minus the median of the 10 px annulus around the cell): top 25th percentile as red, bottom 25th percentile as green, and the remainder as yellow. This initial categorization is used to determine the color coding of the final colonies. Right: Zoomed-in images of 5 selected colonies (i-v) have been identified and labeled on the final colony scatter plot (in order to account of spaces between cells within a colony, colony fluorescence is quantified as the mean fluorescence of the pixels in the annotation above the median of the colony annotation, minus the median of the colony annotation). Both the starting cell (top) and the resistant colony arising from that cell (bottom) are shown.

