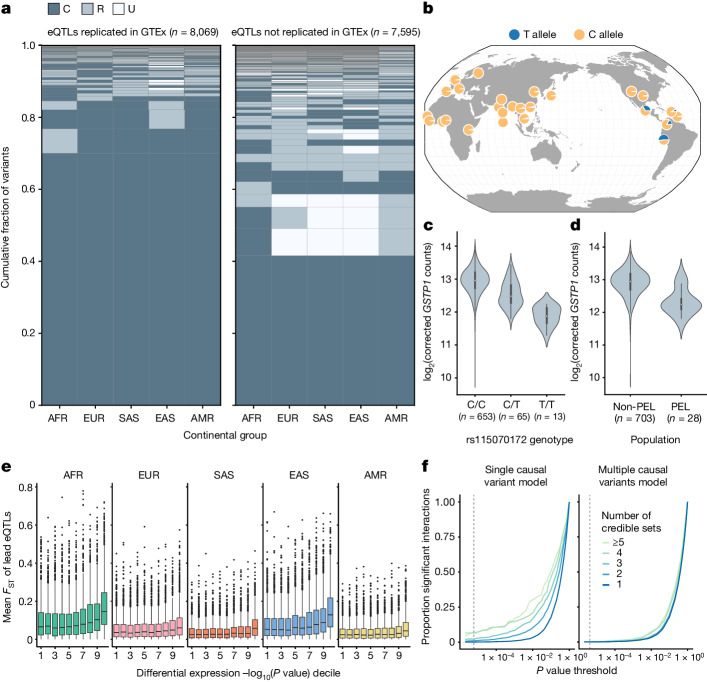
Fig. 5. Population-specific genetic effects on gene expression.
a, Joint distribution of AFs of fine-mapped lead eQTLs across continental groups in the 1KGP6, stratifying on replication status in GTEx26. Variants are categorized as unobserved (U; MAF = 0), rare (R; MAF < 0.05) or common (C; MAF ≥ 0.05) within each continental group. b, AF of a lead eQTL of GSTP1 (rs115070172) across populations from the 1KGP. c, Expression of GSTP1, stratified by genotype of rs115070172. Sample sizes describe the number of MAGE samples with each genotype. d, Expression of GSTP1, stratified by population label (PEL versus non-PEL). Sample sizes describe the number of MAGE samples in each population category. e, Mean FST value between the focal continental group and all other groups of lead eQTLs, stratifying by differential expression decile (contrasting the focal continental group with all other groups) of respective eGenes, where the 10th decile represents the most significant differential expression (n = 9,807 genes total). Differential expression P values (two-tailed) were obtained for each gene using a negative binomial generalized linear model contrasting each continental group with all other samples. For c–e, bars represent the first, second (median) and third quartiles of the data and whiskers are bound to 1.5× the interquartile range. For e, data outside whisker ranges are shown as dots. f, Number of significant genotype-by-continental group interactions at varying P value thresholds (dashed line denotes Bonferroni threshold) for a model that considers a single causal variant (left) versus multiple potential causal variants per gene (right), stratifying by the number of credible sets for the gene. P values are one-tailed and are obtained from a F-test. Map in b reproduced using the browser described in ref. 59, under a Creative Commons licence CC BY 4.0.

