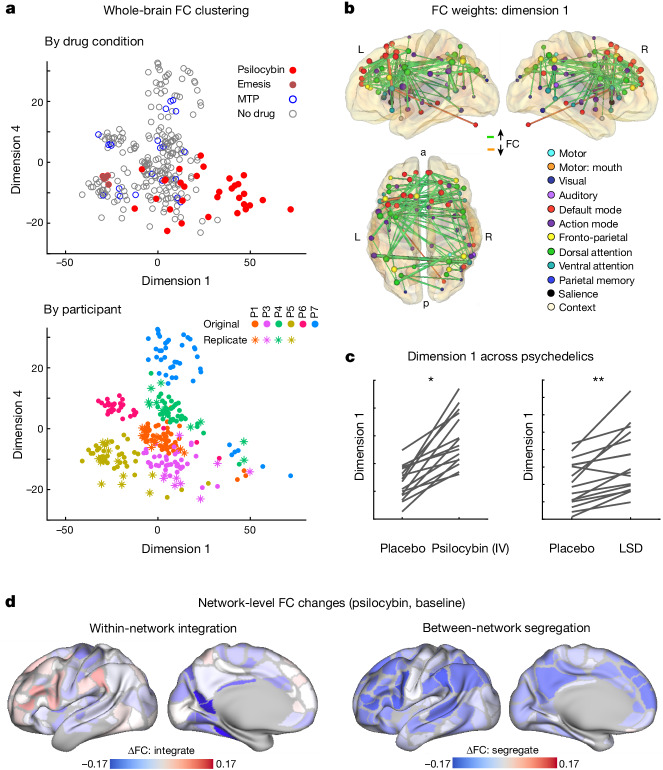
Fig. 2. Data-driven clustering of brain network variability.
MDS blind to session labels was used to assess brain changes across conditions. a, In the scatter plots, each point represents whole-brain FC from a single 15 min scan, plotted in a multidimensional space on the basis of the similarity between scans. Dimensions 1 and 4 showed strong effects of psilocybin. The top shows scans coded on the basis of drug condition. Dark red denotes that the participant had an episode of emesis shortly after taking psilocybin. The bottom shows scans coloured on the basis of participant identity. Dimension 1 separates psilocybin from non-drug and MTP scans in most cases. See Extended Data Fig. 5 for the dimension 1–4 weight matrices. b, Visualization of dimension 1 weights. The top 1% of edges (connections) are projected onto the brain (green indicates connections that are increased by psilocybin). Cerebellar connections are included although the structure is not shown. c, Re-analysis of dimension 1 in extant datasets with intravenous psilocybin (left, ref. 55, paired two-sided t-test of change in dimension 1 score, n = 9, t(8) = 2.97, P = 0.0177, uncorrected) and LSD (right, ref. 56, paired two-sided t-test: n = 16, t(15) = 4.58, P = 3.63 × 10⁻⁴, uncorrected). *P < 0.05, **P < 0.001, uncorrected. d, Average effects of psilocybin on network FC, shown separately for within-network integration (left) and between network segregation (right). For network integration (left), blue indicates a loss of FC (correlations) between regions within the same network. For network segregation (right), blue indicates a loss of FC (anticorrelations) to all other regions in different networks; see Extended Data Fig. 6 for a full correlation matrix. Dissolution of functional brain organization corresponds to decreased within-network integration and decreased between network segregation.

