

Abstract
Background
While growth factors have the potential to halt degeneration and decrease inflammation in animal models, the literature investigating the effect of dosage on human cells is lacking. Moreover, despite the completion of clinical trials using growth differentiation factor‐5 (GDF‐5), no results have been publicly released.
Aims
The overall objective was to quantitatively assess the effect of three clinically relevant concentrations of GDF‐5 (0.25, 1, and 2 mg) as a therapeutic for disc regeneration.
Materials and methods
Firstly, this work experimentally determined the effects of GDF‐5 concentration on the metabolic and matrix synthesis rates of human nucleus pulposus (NP) cells. Secondly, in silico modeling was employed to predict the subsequent regenerative effect of different GDF‐5 treatments (± cells).
Results
This study suggests a trend of increased matrix synthesis with 0.25 and 1 mg of GDF‐5. However, 2 mg of GDF‐5 significantly upregulates oxygen consumption. Despite this, in silico models highlight the potential of growth factors in promoting matrix synthesis compared to cell‐only treatments, without significantly perturbing the nutrient microenvironment.
Discussion
This work elucidates the potential of GDF‐5 on human NP cells. Although the results did not reveal statistical differences across all doses, the variability and response among donors is an interesting finding. It highlights the complexity of human response to biological treatments and reinforces the need for further human research and personalized approaches. Furthermore, this study raises a crucial question about whether these potential biologics are more regenerative in nature or better suited as prophylactic therapies for younger patient groups.
Conclusion
Biological agents exhibit unique characteristics and features, demanding tailored development strategies and individualized assessments rather than a one‐size‐fits‐all approach. Therefore, the journey to realizing the full potential of biological therapies is long and costly. Nonetheless, it holds the promise of revolutionizing spinal healthcare and improving the quality of life for patients suffering from discogenic back pain.
Keywords: GDF5, growth factors, in silico, intervertebral disc, metabolism, regeneration
This study's focus on growth differentiation factor‐5 (GDF‐5) highlights the potential of growth factors to enhance extracellular matrix synthesis in human nucleus pulposus (NP) cells, while minimally affecting their metabolism or disrupting the nutrient microenvironment. Our results indicate a trend of increased matrix synthesis at specific GDF‐5 concentrations, though individual donor variability must be taken into account. This variability emphasizes the complexity of human responses to biological treatments and underscores the necessity for further research and personalized approaches.

1. INTRODUCTION
Degeneration of the intervertebral disc (IVD) is widely recognized as a major factor of chronic low back pain. While degeneration is a natural process of aging, significant imbalance in anabolic and catabolic processes can alter the highly specialized extracellular matrix (ECM) composition. As a result, stability and mechanical functionality of the IVD are impaired and patients are more prone to catastrophic injury, such as disc herniation. Furthermore, as sedentary lifestyles become more prevalent, the incidence of herniations is rising among younger populations, potentially resulting in significant global social and economic repercussions. 1 With current treatments aimed at managing and relieving symptoms rather than treating the underlying etiology, the exploration of novel biological therapeutics holds auspicious potential to preserve the integrity and functionality of IVDs, and may even have the capacity to potentially reverse degeneration. 2
While cell‐based therapies are believed to hold significant potential for regeneration, it remains challenging to identify an appropriate cell source that will withstand the unique microenvironment of such large avascular tissue. 3 , 4 , 5 , 6 , 7 , 8 Our recent work exploring the effect of implanted cell number predicted a very fine clinical balance between an adequate cell dose to actually initiate repair through sufficient de novo matrix deposition without exacerbating the human microenvironmental niche. 9 Furthermore, this study elucidates an extended timeline within which positive changes could be expected in order for “functional change” to actually be detected, speculating that this may explain the variable results emerging from trials and the failure of cell‐based regeneration to be adopted clinically. 10 , 11 , 12 This work also suggests our credulousness that cells alone will be sufficient to recreate the ECM and functionality of the large human IVD within an expedited timeframe, despite the promising animal regeneration abilities observed in preclinical studies. One potential strategy could involve the augmentation of cellular behavior or the targeted stimulation of cell proliferation and matrix production. For example, the incorporation of growth factors into the nucleus pulposus (NP) can act as a potent anabolic agent to stimulate higher levels of glycosaminoglycan (GAG) production, a key ECM component for increased nuclear swelling pressure and functionality of the overall IVD. 13
Growth factors are small glycoproteins that bind to receptors and play a crucial role in regulating a variety of cellular behaviors (e.g., cell proliferation, growth, migration, differentiation, and survival), all of which are important processes in maintaining tissue homeostasis and initiating regeneration. While their role in tissue development has been relatively well studied and their use in tissue engineering regimes continues to advance, there are currently only two growth factors (bone morphogenetic proteins [BMP‐2 and BMP‐7]) approved by the Food and Drug Administration (FDA) for specific orthopedic treatments. 14 , 15 , 16 BMPs are divergent members of the transforming growth factor‐beta (TGF‐β) superfamily. While a number of growth factors have been investigated specifically for the treatment of IVD degeneration, for example, BMP‐2, BMP‐7, TGF‐β3, growth differentiation factor‐6 (GDF‐6), fibroblast growth factor (FGF), and insulin‐like growth factor‐1 (IGF‐1), GDF‐5 has shown particular promise. 17 , 18 , 19 , 20 , 21 , 22 Furthermore, GDF‐5 (also known as BMP‐14 or cartilage‐derived morphogenetic protein‐1) is the only growth factor registered to have translated to clinical trials for the treatment of IVD degeneration. Briefly, preclinical studies using GDF‐5 have shown reparative capacity in terms of increased disc height index (DHI) in degenerative mice, 23 , 24 rat, 25 , 26 , 27 and rabbit models. 28 , 29 Improved histological and magnetic resonance imaging (MRI) scoring were also reported, with higher levels of ECM (i.e. GAG) and increased water content, as well as lower levels of inflammatory gene expression. 25 , 26 , 27 , 28 , 29
There are only four registered clinical trials (clinicaltrials.gov) evaluating the safety, tolerability, and preliminary effectiveness of growth factor treatments for symptomatic degenerative disc disease. These phase I/II clinical trials all investigated a single injection of recombinant human growth and differentiation factor‐5 (rhGDF‐5). Across the four trials, three concentrations of GDF‐5 were investigated (0.25, 1, and 2 mg), with more specific details presented in Table 1. It is important to note that DePuy Spine sponsored all the trials, and even though they were all completed by 2016, no official study results or outcomes have been made public. 30 Although the lack of published results does not necessarily indicate that the treatment was ineffective or accompanied by serious adverse events, as has been speculated and reported on recently. 2 , 31 Nonetheless, further research and publication of the trial results are needed to determine the effectiveness and safety of intradiscal rhGDF‐5 treatment for IVD degeneration.
TABLE 1.
Registered clinical trials investigating growth factors as an intervention for intervertebral disc degeneration (www.clinicaltrials.com).
| National Clinical Trial (NCT) identifier | Intervention | Concentration | Study design | Enrolment |
|---|---|---|---|---|
| NCT01158924 |
|
|
|
40 |
| NCT00813813 |
|
|
|
32 |
| NCT01182337 |
|
|
|
31 |
| NCT01124006 |
|
|
|
24 |
Abbreviation: rhGDF‐5, recombinant human growth and differentiation factor‐5.
In order to achieve functional repair through earlier stage regenerative strategies, biological treatments need to be characterized by their ability to improve matrix synthesis or restore the highly specialized GAG‐rich NP matrix. 9 Therefore, the overall objective of this study was to quantitatively assess the effect of the three clinically relevant concentrations of GDF‐5 (0.25, 1, and 2 mg) as a therapeutic for IVD regeneration. Firstly, this work aimed to experimentally determine the differential effects of GDF‐5 concentration on human NP spheroid viability, key metabolic rates such as oxygen consumption rate (OCR) and lactate production rate (LPR), as well as important GAG and collagen matrix synthesis rates (Figure 1A–C). Secondly, in silico modeling was employed to predict the subsequent regenerative effect of different GDF‐5 treatments (alone and in combination with cells), as shown in Figure 1D. Furthermore, this work aims to elucidate the ensuing nutrient microenvironment as a result of growth factor simulation and cell dose. Overall, this work aims to provide a path toward understanding the potential of growth factor therapeutics on human NP cells, where the availability of clinical data is incomplete.
FIGURE 1.
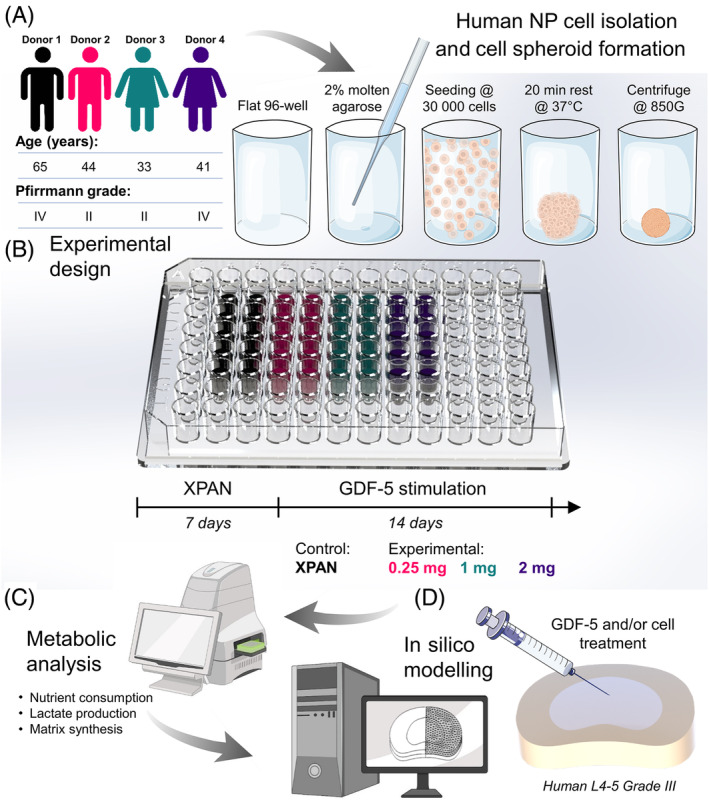
(A) Human nucleus pulposus (NP) cells were isolated from four patients undergoing discectomy procedures. Following monolayer expansion, cell spheroids were formed in 96‐well plates coated with a thin layer of 2% agarose to prevent attachment. (B) Cell spheroids were cultured in standard expansion media (XPAN) for 1 week prior to 2 weeks under growth differentiation factor‐5 (GDF‐5) stimulation. (C) After GDF‐5 stimulation, individual spheroids underwent metabolic analysis using a Seahorse XFe96 analyzer and biochemical analysis. (D) Metabolic rates for each experimental group were then computed in silico to predict the donor‐specific reparative effects of GDF‐5 on extracellular matrix and subsequent impact on the nutrient microenvironment.
2. METHODS
2.1. Cell isolation, monolayer expansion, and spheroid culture
Human disc tissue was collected through the informed consent of patients undergoing discectomy procedures and approved by the Mater Misericordiae University Hospital IRB (Ref 1/378/2229) and Trinity College Dublin (TCDFSTEMSREC/15032021/Buckley). The study conforms with the Declaration of Helsinki, Irish and European Union (EU) law. Under sterile conditions, tissue was weighed and washed with phosphate buffered saline (PBS) containing 2% penicillin/streptomycin (Pen‐Strep) by repeated centrifugation (650 × g for 5 min) and aspiration. To confirm the absence of bacterial growth, tissue was placed in a 70 mL container with serum‐free Low Glucose‐Dulbecco's Modified Eagle Medium (LG‐DMEM) supplemented with 2% Pen‐Strep and 100 μg/mL of kanamycin sulfate (Gibco, Thermo Fisher Scientific) and cultured overnight (37°C in a humidified atmosphere with 5% CO2 and 10% O2). Under sterile conditions, NP tissue was separated from fibrous annulus fibrosus (AF) through visual inspection and diced into smaller pieces on separate sterile petri dishes. NP tissue was enzymatically digested for 3–4 h using 10 mL of serum‐free digestion media per gram of tissue, with an enzyme activity of 100 U/mL pronase (Millipore, Sigma) and 300 U/mL collagenase type II (Gibco, Thermo Fisher Scientific). Digestion was stopped when a good proportion of single cells was observed under a hemocytometer, rather than cell clusters. The remaining suspension was passed through a cell strainer (70 μm), the filtrate was centrifuged and rinsed with PBS before determining cell yield and seeding at a cell density of 5 × 10³ cells/cm2. Disc cells were expanded in LG‐DMEM expansion media (XPAN; 1000 mg/L glucose, 584 mg/L L‐glutamine, 110 mg/L sodium pyruvate) supplemented with 10% fetal bovine serum (FBS) and 2% Pen‐Strep (all Gibco, Thermo Fisher Scientific). Cells were expanded to passage 3 (P3) with medium exchanges performed every 3 days (37°C in a humidified atmosphere with 5% CO2 and 10% O2). Human cells were isolated from a 33‐year‐old female, a 41‐year‐old female, a 44‐year‐old male, and a 65‐year‐old male (N = 4).
NP cell spheroids were created as individual aggregates of 30 000 cells in a flat‐bottomed 96‐well plate, coated with a thin layer of agarose (2% [w/v], Sigma‐Aldrich) to prevent cell attachment. Each spheroid was cultured in 200 μL of phenol‐free LG‐DMEM supplemented with 10% FBS and 2% Pen‐Strep (all Gibco) for 1 week prior to growth factor supplementation. Experimental groups consisted of a XPAN‐only (LG‐DMEM supplemented with 10% FBS and 2% Pen‐Strep) control (ctr) and the three clinically investigated GDF‐5 (PeproTech, Thermo Fisher Scientific) doses, consisting of XPAN supplemented with 0.25, 1, and 2 mg. Doses were normalized to the average cell population of the human NP to yield a working concentration of 0.75, 3, and 6 μg per spheroid for the 0.25, 1, and 2 mg groups, respectively. Media exchange was performed weekly, where groups were replenished with XPAN‐only or XPAN supplemented with 0.25, 1, and 2 mg of GDF‐5 (37°C in a humidified atmosphere with 5% CO2 and 10% O2). Aspirated media was retained at every media exchange. On termination of culture (3 weeks), the spheroid‐specific media and spheroid sample were combined for biochemical assessment.
2.2. Experimentally determined metabolic rates and matrix synthesis rates
Cell spheroid viability was established using a live/dead assay kit (Invitrogen, Bioscience). Media was aspirated and spheroids were gently rinsed with PBS before incubation for 1 h in a phenol‐free DMEM (Sigma‐Aldrich) solution containing 2 μM calcein acetoxymethyl (AM) and 4 μM of ethidium homodimer‐1 (EthD‐1). Following incubation, samples were imaged on a Leica SP8 scanning confocal microscope (485 and 530 nm excitation and 530 and 645 nm emission for calcein and EthD‐1, respectively). All images are presented as maximum projection z‐stack reconstructions qualitatively analyzing cell viability. These samples were then washed in PBS and fixed with 4% paraformaldehyde (PFA; 4°C, 1 h) for histology.
A Seahorse XFe96 analyzer (Agilent Technologies) was used to simultaneously measure the reduction in oxygen level, a measure of OCR and pH level, and a measure of extracellular acidification rate (ECAR) in the medium directly surrounding a single cell spheroid, as described previously. 9 In brief, cartridge plates were hydrated and incubated in a non‐CO2 incubator overnight. The next day sterile deionized water was exchanged for extracellular flux (XF) calibrant fluid for 45–60 min before initiating the assay. Cell spheroids were transferred to poly‐D‐lysine (100 μg/mL, Sigma‐Aldrich)‐coated Seahorse 96‐well spheroid microplates and allowed to stabilize for at least 1 h prior to initiating the assay. Each well contained 175 μL of freshly made unbuffered XF assay medium (Seahorse XF DMEM supplemented with 5.5 mM glucose, 1 mM sodium pyruvate, 2 mM L‐glutamine, and pH adjusted to 7.4 [all Agilent Technologies]). Blank wells (no spheroids) were prepared to remove background OCR and ECAR readings during analysis. Extracellular flux measurements were performed three times at 20‐min intervals under basal conditions.
Following Seahorse analysis, spheroids were removed from the 96‐well microplate and transferred into microtubes together with their respective culture media (pooled) and stored at −80°C until lyophilization using a standard drying protocol (0.200 mBar, −10°C, 16–18 h). Samples were digested in a papain enzyme solution (180 μL per spheroid) of 100 mM sodium phosphate/5 mM Na2EDTA buffer, 3.88 U/mL of papain enzyme, and 5 mM L‐cysteine, pH 6.5 (all from Sigma‐Aldrich) at 60°C under constant rotation (10 rpm) for 18 h. The cell number of each spheroid was established immediately after digestion using a Quant‐iT PicoGreen dsDNA kit (Lambda DNA Standard, Thermo Fisher Scientific) and interpolated using a purpose made standard curve for DNA content versus cell number. GAG accumulation was detected using a dimethylmethylene blue dye‐binding assay (chondroitin sulfate standard, DMMB Blyscan, Biocolor Ltd.). Total collagen was determined by measuring the hydroxyproline content. Samples were hydrolyzed in 12 M hydrochloric acid (HCl) (at 110°C for 18 h) before using a chloramine‐T assay with the collagen content determined by a hydroxyproline: collagen ratio of 1:7.69. 32 , 33 All biochemical assays were read using a Synergy HT multi‐detection microplate reader (BioTek Instruments, Inc.). At least six technical replicates were performed for each donor (N = 4). Each technical replicate consisted of a single spheroid and is defined as an individually cultured spheroid under the same experimental condition. In brief, metabolic rates were calculated over the linear/plateaued region, and pH measurements were converted to lactate concentration using a standard curve created previously. 34 OCR, LPR, GAG, and collagen calculations were normalized by cell number per spheroid. As ECAR is a measure of glycolysis, the glucose consumption rate (GCR) was estimated based on the assumption that approximately 2 mol of lactate are produced for every mole of glucose consumed by highly glycolytic disc cells. 35
2.3. Histology and immunofluorescence staining for bone morphogenetic protein receptor type 2
Individual PFA fixed spheroids were embedded in agarose (2% [w/v]) before graded dehydration in ethanol (50%–100%), clearing in xylene, and embedding in paraffin wax (all Sigma‐Aldrich). Cell spheroids were sliced at 6 μm, rehydrated, and stained with hematoxylin and eosin (H&E), 1% (w/v) alcian blue (AB) 8GX in 0.1 M HCl (AB) to visualize GAG deposition, and counter‐stained with 0.1% (w/v) nuclear fast red and 0.1% (w/v) picrosirius red (PSR) to visualize collagen deposition.
For immunofluorescence staining of bone morphogenetic protein receptor type 2 (BMPR2) in monolayer, cells were seeded at a density of 5000 cells per well in 18‐well micro‐well slides (Ibidi GMBH) and allowed to attach for 24 h. Following attachment, cells were washed with PBS and fixed in 4% PFA for 12 min. For 3D immunofluorescence staining of BMPR2, wax embedded XPAN ctr spheroids were deparaffinized and rehydrated in decreasing percentages of ethanol. Heat‐induced antigen retrieval was performed in citrate stock buffer at pH 6.5. For both culture conditions, 0.1% Triton X‐100 was applied for 20 min to permeabilize cell membranes, and non‐specific binding was blocked with 1% bovine serum albumin in PBS for 30 min (all Sigma‐Aldrich). The primary rabbit anti‐BMPR2 antibody (PA5‐99465, Thermo Fisher Scientific) was applied overnight at 4°C at a dilution of 1:100. The secondary antibody, goat anti‐rabbit 488 (ab150077, Abcam) was applied for 1.5 h at room temperature. A concentration‐matched IgG ctr was used for all staining. Nuclei were visualized with 4′,6‐diamidino‐2‐phenylindole, and imaging was performed on a Leica SP8 scanning confocal microscope. Composite max projections of 2D wells (N = 3) and spheroids (N = 4) were used for fluorescence intensity analysis using a custom CellProfiler pipeline (CellProfiler 4.2.1), quantifying fluorescence in the cytoplasm and nucleus, with mean fluorescence intensity (MFI) normalized by cell number.
2.4. In silico models to predict effects on GAG regeneration and the nutrient microenvironment
Based on our previous work, an idealized 3D geometry for a Grade III human lumbar disc (L4‐5) was created in SOLIDWORKS®. 9 A quadrant of the disc was modeled in silico using COMSOL Multiphysics 6.0 (COMSOL Inc., Burlington, USA). The quasi‐static nutrient transport model was governed by coupled reaction–diffusion equations dependent on local concentrations as observed for bovine NP cells and commonly employed across the research field. 36 , 37 , 38 , 39 The transient GAG regeneration model was created based on the conservation of mass for GAG theory established previously by Gu et al. for human IVD. 40 , 41 The rate of GAG content change is simply modeled as the balance between GAG synthesis rate and GAG degradation rate and within this work, GAG synthesis is assumed to remain constant as it is calculated as the average GAG deposition rate over the 14‐day experimental treatment period. A brief description of each equation can be found in Table 2, together with constants (e.g., boundary concentrations) and variable input parameters in Table 3. However, a full explanation of the equation coupling, computational methodology, and degeneration grade‐specific input parameters such as metabolically active cell density and diffusion coefficients can be found in our recent work. 43
TABLE 2.
Governing equations of the in silico nutrient transport model and glycosaminoglycan (GAG) regeneration model.
| Nutrient transport model | ||||
|---|---|---|---|---|
| Equations | Description | References | ||
| Equation (1) |
|
= consumption rate (μM/h) = local oxygen conc. (μM) = local pH level = cell density (million cells/mm3) = measured metabolic rate (OCR; nmol/million cells/h) = Michaelis–Menten constant (μM) |
36, 37, 38 | |
| Equation (2) |
|
= consumption rate (μM/h) = local glucose conc. (mM) = cell density (million cells/mm3) = measured metabolic rate (OCR; nmol/million cells/h) = Michaelis–Menten constant (μM) |
42 | |
| GAG regeneration model | ||||
|---|---|---|---|---|
| Equation | Description | References | ||
| Equation (3) |
|
= rate of GAG content change = synthesis rate = GAG degradation rate |
40, 41 | |
| Equation (4) |
|
= syn./deg. rate of GAG = measured GAG syn. rate (pg/cell) = cell density (million cells/mm3) = GAG deg. rate = local GAG content |
||
| Equation (5) |
|
= GAG deg. rate = the half‐life of GAG turnover |
||
Abbreviation: OCR, oxygen consumption rate.
TABLE 3.
Constant and variable input parameters used for in silico models.
| Constant or initial parameters | ||||||
|---|---|---|---|---|---|---|
| Tissue domain | Grade III effective diffusion coefficients (mm2/h) | Boundary concentrations | ||||
| D glucose | D oxygen | D lactate | Glucose (mM) | Oxygen (% O2) | Lactate (mM) | |
| NP | 1.17 a | 4.81 a | 1.56 a | 3.04 d | 1.48 d | 3.30 d |
| AF |
Axial: 0.45 b Radial: 0.37 b |
Axial: 3.08 b Radial: 2.20 b |
Axial: 0.6 c Radial: 0.50 c |
4.75 d | 5.92 d | 1.98 d |
| Tissue domain | Metabolic rates (nmol/million cells/h) | Grade III cell density (cells/mm3) | GAG content (μg/mg DW) | |
|---|---|---|---|---|
| Grade II | Grade III | |||
| NP | Variables experimentally determined within this work (see below) | 800 f | 537.8 g | 285 h |
| AF |
GCR: 62 e OCR: 0.8 e |
1499 f | 153 g | 106.9 h |
| Variable dose‐dependent parameters (NP‐only) | |||
|---|---|---|---|
| Average ± std | |||
| GDF‐5 dose | OCR (nmol/million cells/h) | LPR (nmol/million cells/h) | GAG synthesis rate (pg/cell/day) |
| ctr | 0.77 ± 0.28 | 93.28 ± 36.80 | 10.96 ± 5.24 |
| 0.25 mg | 0.87 ± 0.42 | 104.30 ± 52.94 | 13.03 ± 7.31 |
| 1 mg | 1.44 ± 0.56 | 150.80 ± 61.39 | 17.12 ± 9.02 |
| 2 mg | 2.27 ± 1.36 | 171.40 ± 65.52 | 13.47 ± 3.36 |
Abbreviations: AF, annulus fibrosus; ctr, control; DW, dry weight; GAG, glycosaminoglycan; GCR, glucose consumption rate; LPR, lactate production rate; NP, nucleus pulposus; OCR, oxygen consumption rate.
Experimentally measured in the literature and hydration adjusted as per our previous work. 43 , 44 , 45 , 46 , 47
Literature values for human tissue under 10% strain and temperature adjusted as described previously. 43 , 48 , 49
Concentrations at the NP– endplate (EP) interface and periannular surface were estimated based on literature, theoretical and iterative experimental validation as detailed in our previous work. 9 , 43
As determined for AF cells in our previous work. 9
Experimentally measured in age and degeneration grade‐specific literature and adjusted as per our previous work. 43 , 51 , 52
Grade II human tissue, AF averaged over inner/outer and anterior/posterior region. 53
Grade III human tissue, AF averaged over inner/outer and anterior/posterior region. 53
2.5. Statistical analysis
All experiments were replicated with cells from four different human donors. Statistical analyses were performed using GraphPad Prism (version 10) software, with four samples analyzed for each experimental group (N = 4). A one‐way analysis of variance (ANOVA) was used with Dunnett's post‐tests to compare GDF‐5 groups to the untreated ctr. The results were displayed as mean ± standard deviation. Significance was accepted at a level of p < 0.05. Relative increase/decrease (%) in predicted GAG and nutrient concentrations were determined by dividing the predicted value for each condition by the donor‐specific untreated ctr.
3. RESULTS
Figure 2A presents representative live/dead images of NP cell spheroids either in a ctr XPAN media or subjected to GDF‐5 stimulation (0.25, 1, and 2 mg) for 2 weeks. A high viability across all of the groups indicated no detrimental effects of the different GDF‐5 concentrations on cell survival. Additionally, spheroid viability was evaluated qualitatively to ensure an acceptable level of cell viability to later perform normalization of nutrient consumption and metabolite production rates. Figure 2B shows that increasing concentrations of GDF‐5 stimulation produced a trend of elevating the OCR of human NP cells in spheroid form. Nonetheless, only the 2 mg group (2.27 ± 1.36 nmol/million cells/h) was detected as statistically different to the untreated ctr (0.77 ± 0.28 nmol/million cells/h; p = 0.045). Similarly, in Figure 2C, there was an apparent trend in increasing LPR with increased GDF‐5 stimulation, however, no significant difference was actually detected between groups.
FIGURE 2.
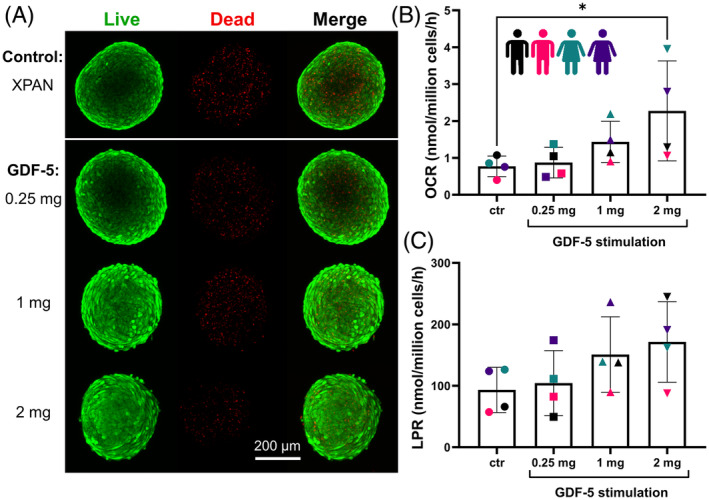
(A) Spheroid viability was assessed across the experimental groups using live/dead staining to ensure viability remained high in each group prior to performing metabolic rate measurements. (B) Oxygen consumption rates (OCR, nmol/million cells/h) and (C) lactate production rates (LPR, nmol/million cells/h) for NP cell spheroids in either XPAN media as an untreated control (ctr) or stimulated with three different concentrations of growth differentiation factor‐5 (GDF‐5) (0.25, 1, and 2 mg) (N = 4). While there is an apparent trend of increasing OCR and LPR with GDF‐5 concentration, only the 2 mg group had a significantly higher OCR compared to the ctr (p = 0.045).
Figure 3 highlights the ECM synthesis capabilities of human NP spheroids cultured under GDF‐5 stimulation. Figure 3A,B present the GAG and collagen synthesis rates, respectively, calculated by normalizing to DNA content/cell number per spheroid. Total DNA, GAG, and collagen data (per sample) is provided in Figure S1. While no statistically significant difference was detected between experimental groups, donor‐specific colors are used to highlight donor variability and trends in donor‐specific response across both GAG and collagen. Averaged rates across the four donors indicate a trend of increasing matrix synthesis with 0.25 mg and 1 mg of GDF‐5 stimulation, before a plateau at 2 mg. Furthermore, histological evaluation in Figure 3C, highlights this trend of increased GAG (17.12 ± 9.02 pg/cell/day) and collagen (467.10 ± 190.40 pg/cell/day) deposition within the 1 mg group for representative Donor 2.
FIGURE 3.

(A) Glycosaminoglycan (GAG) production rates and (B) collagen production rates for cell spheroids in either XPAN media (control [ctr]) or stimulated with three different concentrations of growth differentiation factor‐5 (GDF‐5) (0.25, 1, and 2 mg) (N = 4). While no statistically significant difference was detected between experimental groups, donor‐specific colors are used to highlight donor variability and trends in donor‐specific response across both GAG and collagen. (C) Corresponding histological evaluation for Donor 2 using hematoxylin and eosin (H&E) to stain for cells, alcian blue (AB) to stain for GAG and picrosirius red (PSR) to stain for collagen. Scale bar is 200 μm.
To investigate the potential reasons for the donor‐dependent response, we conducted BMPR2 staining on both monolayer and spheroid cultures without GDF‐5 stimulation (Figure S2). This analysis aimed to determine the receptor expression levels and assess each donor's potential responsiveness to GDF‐5 treatment. In monolayer, reduced staining of BMPR2 was observed in Donors 1 and 2, while a stronger presence was observed in Donors 3 and 4. Quantification via MFI revealed an increasing trend and a significant difference in the MFI between certain groups. Donors 1 and 2 exhibited the lowest MFI. Donor 3 showed an increase in MFI, while Donor 4 had a significantly higher MFI compared to Donor 1 (p = 0.007) and Donor 2 (p = 0.010). For spheroid staining, Donor 2 revealed a significant reduction in BMPR2 expression compared to Donor 3 (p = 0.007), with a strong trend in reduction in relation to Donor 4 (p = 0.059) and a diminished though evident trend in comparison to Donor 1 (p = 0.106). Overall, Donors 3 and 4 demonstrated increased levels of BMPR2 expression.
Based on donor‐specific experimentally determined human GAG matrix synthesis rates, Figure 4 predicts the temporal effect of different GDF‐5 treatments on each of the four donors. Specifically, Figure 4A presents the predicted GAG matrix content in the NP of a generic Grade III human IVD, based on each donor's unique response to varying concentrations of GDF‐5. These graphs highlight the variability between donors; with Donor 1 predicted to be relatively unresponsive to all GDF‐5 treatments, while 1 mg appears to be the optimal treatment for both Donors 2 and 3. Donor 4 is predicted to continue to degenerate from Grade III toward Grade IV over 10 years without treatment (ctr), while an injection of 0.25 mg slows the rate of degeneration, it is not predicted to fully halt degradation or initiate regeneration. Meanwhile, an injection of 1 or 2 mg is predicted to have a positive effect, initiating regeneration through increased synthesis rates. However, the recovery of the GAG matrix is not expected to approach Grade II levels even after 10 years.
FIGURE 4.

(A) Predicted donor‐specific glycosaminoglycan (GAG) matrix content in the nucleus pulposus (NP) of a Grade III intervertebral disc over 10 years following no treatment (control [ctr]) or an injection of 0.25, 1, or 2 mg of growth differentiation factor‐5 [GDF‐5]. (B) Percent (%) difference in GAG matrix within the NP, compared to the untreated ctr, 5 years after treatment with either 0.25, 1, or 2 mg of GDF‐5. Highlighting both the donor‐specific overall response to GDF‐5 injection and the donor‐specific response to dose concentration. Data colors refer to simulated treatment concentrations, not donor.
Figure 4B illustrates the impact of GDF‐5 concentration 5 years post‐treatment. The GAG levels for each treatment and donor are normalized against their donor‐specific no treatment (ctr) effect, thereby accounting for the overall higher matrix synthesis rates observed experimentally for Donor 3. Taking 1 mg as the optimal treatment in the responsive patients, Donor 2 is predicted to have a 33%, Donor 3 a 35%, and Donor 4 a 21% improvement in the overall GAG content of the NP.
Figure 5 highlights the effect of GDF‐5 treatment on the nutrient microenvironment based on experimentally measured metabolic rates. Figure 5A presents predicted average central metabolite (glucose, oxygen, and pH) concentrations within the NP, with color coding to capture each donor‐specific model. While an increase in GDF‐5 concentration is predicted to cause a reduction in nutrients and pH within the IVD, the effect does not appear to be substantial. Figure 5B presents representative glucose, oxygen, and pH distribution across a quadrant of Donor 4 with either no treatment or a treatment of 0.25, 1, or 2 mg of GDF‐5. Experimental results for Donor 4 showed the highest OCR at 2 mg of GDF‐5, while the highest LPR was observed at 1 mg. These growth factor stimulation effects are most clearly captured in the continued reduction in oxygen from left to right across the groups and the build‐up of acidity within the pH contour plot for the 1 mg group. Figure 5C summarizes the effect of GDF‐5 on the predicted central metabolite concentrations by normalizing the donor‐specific ctr, with a 2 mg dose resulting in a 14% reduction in glucose, a 24% reduction in oxygen, and a 0.8% reduction in pH value.
FIGURE 5.

(A) Predicted donor‐specific central metabolite (glucose, oxygen, and pH) concentrations within the nucleus pulposus of a Grade III intervertebral disc (N = 4) either untreated or subjected to growth differentiation factor‐5 (GDF‐5) injection (0.25, 1, and 2 mg). (B) Predicted glucose, oxygen, and pH distribution across a quadrant of a human intervertebral disc (Donor 4) with no treatment (control [ctr]) or with an injection of 0.25, 1, or 2 mg of GDF‐5. (C) Percent (%) reduction in central metabolite (glucose, oxygen, and pH) concentration relative to the donor‐specific ctr (N = 4).
The data presented in Figure 6 introduces a cell therapy in addition to GDF‐5 treatment (1 mg only) in a generic Grade III human IVD based on the averaged experimental rates presented previously. Figure 6A compares the temporal effect on the level of the GAG matrix after either no treatment, unstimulated cell therapy (1, 5, and 10 million cells), the same cell doses stimulated with GDF‐5, or a GDF‐5‐only treatment. The models predict that 1 million unstimulated cells are insufficient to halt degeneration, with GAG content reducing over time, similar to no treatment. Meanwhile, 5 million unstimulated cells, a GDF‐5‐only injection, or the 1 million doses stimulated are all predicted to initiate a relatively similar level of rejuvenation of the GAG matrix over time. However, the level of GAG deposition from these treatment options is still lower than an injection of 10 million unstimulated cells. Furthermore, stimulating a 5 million cell therapy with GDF‐5 is predicted to restore the GAG matrix to the levels of a Grade II healthy IVD over 10 years, and doubling this to 10 million stimulated cells is predicted to reduce this time down to ~6 years. Figure 6B summarizes the percent difference in the GAG matrix within the NP, compared to the untreated ctr, 5 years after each treatment. Firstly, these results emphasize that the weakest treatment of 1 million unstimulated cells resulted in only a 4% improvement. Secondly, intermediate treatments of 5 million unstimulated cells, GDF‐5‐only injection, or 1 million stimulated cells had a 19%–28% improvement, while 10 million unstimulated cells performed slightly better with a 38% improvement. Lastly, 5 and 10 million GDF‐5‐stimulated cells were predicted to be the superior treatments, with a 52% and 81% improvement, respectively. Figure 6C presents the effect of each treatment option on the central metabolite (glucose, oxygen, and pH) concentration based on the experimentally determined metabolic rates. The results highlight the combined effect of increasing the cell dose and introducing growth factor stimulation on the local nutrient microenvironment. As expected, a treatment of 10 million stimulated cells will have the most significant effect on concentrations, reducing glucose from 2.54 mM in the untreated case to 1.69 mM, oxygen from 1.82% O2 to 1.25% O2 and pH from 7.09 to 6.97. Figure 6D presents the corresponding contour plots, highlighting the effect of 10 million cells (unstimulated and stimulated) on the glucose, oxygen, and pH distribution compared to an untreated and GDF‐5‐only ctr.
FIGURE 6.

(A) Predicted average (N = 4) glycosaminoglycan (GAG) matrix regeneration in the nucleus pulposus (NP) of a Grade III intervertebral disc over 10 years following no treatment (control [ctr]), an injection of unstimulated discogenic cells (1, 5, or 10 million), a growth differentiation factor‐5 (GDF‐5)‐only injection (1 mg), or GDF‐5 stimulated (1 mg) discogenic cells (1, 5, or 10 million). (B) Percent (%) difference in GAG matrix within the NP, compared to the untreated ctr, 5 years after treatment with either unstimulated/stimulated discogenic cells (1, 5, or 10 million) or a GDF‐5‐only injection. (C) Predicted central metabolite (glucose, oxygen, and pH) concentrations within the NP of a Grade III intervertebral disc either untreated, subjected to unstimulated/stimulated discogenic cells (1, 5, or 10 million), or a GDF‐5‐only injection. (D) Predicted glucose, oxygen, and pH distribution across a quadrant of a human intervertebral disc, either untreated or subjected to an unstimulated/stimulated 10 million discogenic cell injection or a GDF‐5‐only treatment.
4. DISCUSSION
Despite conventional surgical treatments remaining largely suboptimal, there are currently no FDA‐approved regenerative therapies for discogenic back pain. Furthermore, there have been no large‐scale randomized controlled trials that have shown clinically significant improvement with any investigational regenerative treatment. 11 , 30 Our recent work elucidating the temporal and scale limitations of relying solely on cell‐based therapy potentially helps to explain stunted results emerging from clinical trials and advocates alternative therapeutic strategies to enhance the deposition of de novo GAG matrix. 9 For example, growth factor therapy involves an intradiscal injection of bioactive agents to promote ECM synthesis, prevent degeneration, and decrease inflammation. 28 , 29 While growth factors have been extensively studied in animal models, to the best of our knowledge, there is no literature reporting their progress under clinical evaluation. Therefore, to characterize and predict their ability to rejuvenate the IVD in terms of restoring the GAG matrix, this work aimed to quantitatively assess the effect of three clinically relevant concentrations of GDF‐5 (0.25, 1, and 2 mg) on both matrix synthesis and nutrient metabolism.
As highlighted previously, research has explored the role of several growth factors in regulating the production of ECM by employing disease‐related biological mechanisms, such as inhibiting inflammation and reducing the activity of degrading enzymes. However, it has been reported that TGF‐β, FGF, and IGF‐1 also have the potential to trigger undesirable blood vessel growth, actually accelerating the progression of IVD degeneration. 18 Meanwhile, there is an increasing body of evidence indicating that the GDF family is central to IVD homeostatic processes, suggesting that GDF‐5 in particular maintains the structure and function of the IVD and may be the most promising anabolic agent for NP regeneration. 18 , 19 , 20 GDF‐5 ligands are known to preferentially bind to BMP receptor (BMPR)‐IB or BMPR‐II transmembrane receptors and thus regulate the downstream intracellular biochemical processes. 54 , 55 GDF‐5 promotes the initial stages of chondrogenesis by promoting cell adhesion, particularly in early cartilage condensation. It also enhances proliferation within the epiphyseal cartilage, playing a crucial role in the formation of cartilage during skeletal development and contributing to the growth and development of skeletal elements. 56
While the current work shows a trend of increasing matrix synthesis with 0.25 and 1 mg of GDF‐5 stimulation, no statistically significant differences were detected between groups for human NP cells. However, it is important to acknowledge the large variability in matrix synthesis observed between donors. Donor 1 appeared unresponsive to all GDF‐5 concentrations. Donor 2 was stimulated most at 1 mg, with collagen production almost two‐fold higher than the ctr. Donor 3 cells were overall notably more active, with unstimulated rates almost twice those of other donors for both GAG and collagen. And finally, Donor 4 was the only biological replicate to have continued upregulation of matrix synthesis at 2 mg of GDF‐5 stimulation. As mentioned briefly, several preclinical animal studies have implied disc regeneration through increased disc height and water content, as well as increased production of ECM components both in vitro and in vivo. An in vitro study using alginate beads under GDF‐5 stimulation found that the ECM synthesis response in bovine NP cells was significantly greater than AF cells and that dose dependency was only observed in NP cells at 21 days, with an approximately 0.5‐fold increase and an approximately one‐fold increase in both proteoglycan/collagen at 100 and 200 ng/mL, respectively. 29 A potential limitation of this work, due to the costly nature of growth factors, is not extending the culture time further or replenishing the GDF‐5 supplemented media more frequently.
FBS contains a milieu of growth factors such as TGF‐β cytokines, hormones, vitamins, amino acids, and fatty acids, which can suffer from batch‐to‐batch variability. 57 , 58 Although this work ensured to use the same batch of FBS across groups, the intrinsic growth factors may have enhanced the effects of GDF‐5 stimulation to some extent. For example, studies have shown that human adipose stromal cells subjected to TGF‐β1 and GDF‐5 stimulation synergistically drive the differentiation process. 59 In support, a combination of GDF‐5 and TGF‐β1 was suggested as an optimal combination for human mesenchymal stem cell (MSC) to NP cell induction, resulting in 3D pellets with significantly enhanced GAG content. 35 Previous work in our laboratory suggests that growth factors exert differential effects on matrix synthesis depending on the cell type when stimulating NP and nasal chondrocyte (NCs) microtissues with the growth factors TGFβ3, GDF‐5, and GDF6. NP cells were found to be relatively insensitive to the different growth factor types examined in isolation or in combination, whereas for NCs subjected to a combination of TGFβ3 + GDF‐5, a synergistic effect was observed. 17 Consideration should be made in future studies to exclude FBS or use a chemically defined culture media.
The concentrations of GDF‐5 typically used in the preclinical literature are not consistent or comparable with the high doses assessed clinically (0.25–2 mg per disc, Table 1). 23 , 29 Nonetheless, mice receiving 8 ng of GDF‐5 (in an 8 μL intradiscal injection) showed a significant increase in disc height at 2–4 weeks, and an expansion of inner annular chondrocytes into the NP was observed. 23 And a study using an annular puncture degenerative model in rabbits showed that a single 10 ng, 1 μg, or 100 μg dose of GDF‐5 (in a 10 μL intradiscal injection) induced repair in a dose‐dependent manner. At 4 weeks, only the 100 μg group had a statistically significant DHI, whereas at 6 weeks, both 1 and 100 μg were significantly different to the PBS ctr. Even at 12 weeks, the DHI of 10 ng discs did not differ from that of PBS discs, and both lower doses (10 ng and 1 μg) did not significantly affect the histologic score of degeneration. Despite this, MRI analysis at 12 weeks observed less degeneration across all GDF‐5 groups (10 ng and 1 μg: p < 0.05, 100 μg: p < 0.01). 29 More recent animal studies incorporating GDF‐5, focused on using a synthetic polycation for sustained growth factor release, 26 transfecting human‐induced pluripotent stem cells with GDF‐5 (GDF‐5‐hiPSCs) 27 and creating a dual delivery system of tumor necrosis factor inhibitor and GDF‐5 to reduce disc inflammation. 28 While these preclinical studies suggest potential for regeneration, further research is needed to fully understand the mechanisms of GDF‐5 in human IVD degeneration, particularly with incomplete public reporting of clinical trials.
Significant variation exists among animal species, encompassing differences in cell composition, including cell type and density, as well as the scale of disc geometry and structure. While small animal models like mice, rats, and rabbits display rapid degenerative changes, they also retain their notochordal cells into adulthood, unlike humans, who lose them shortly after birth, potentially affecting regenerative potential. 60 , 61 , 62 Our recent work highlighted the impact of such discrepancies through predicting the promising temporal capabilities of cell therapies, together with uncompromised nutrition, in smaller animal discs. 9 On the contrary, for human, a fine clinical balance was predicted in terms of an adequate cell dose for sufficient GAG matrix repair, over a prolonged number of years without exacerbating the microenvironmental niche. As a result, there is speculation that this could account for the variable outcomes observed in cell‐based clinical trials and the lack of clinical adoption of regenerative therapies despite promising preclinical results. Like GDF‐5 (BMP‐14), BMP‐7 has also demonstrated improved disc height and NP proteoglycan content in multiple rabbit models. 63 , 64 However, this is another example of a failure to bridge the preclinical to clinical gap. A multicenter phase I/II trial initiated in 2010 and led by the medical technology company Stryker was later placed on hold. This trial, which is not listed on clinicaltrials.com, has not released results or updates. 30 Further research is necessary to quantify the effects of biological treatments and predict their success in clinical settings. This can be achieved through advanced in vitro testing adopting relevant human cells, utilizing in silico modeling to guide clinical trial design, and reassessment of the suitability of certain animal models.
This study highlights the power of using in silico modeling to select appropriate patient‐specific treatments or even prioritize treatments based on predicted outcomes. For example, this work corroborates our previous models suggesting that a cell therapy of 1 million discogenic cells is insufficient to halt degeneration; 9 however, interestingly, it suggests no significant benefit in stimulating these 1 million cells with growth factor over a GDF‐5‐only treatment or simply increasing the cell dose to 5 million unstimulated discogenic cells. Such insights are particularly valuable when comparing the cost and regulatory hurdles associated with growth factor treatment, as well as the manufacturing/scale‐up and availability of sufficient cell sources. Additionally, this work invokes an important question on whether these potential biological treatments are truly reparative/regenerative or more appropriate as a form of prophylactic therapeutic to slow down or halt further degeneration. This is reflected in a degenerative mouse model where an injection of GDF‐5 solely disrupted a further decrease in GAG content due to injury through 8 weeks. 24 In order to achieve a true regenerative effect, this work advocates GDF‐5 stimulating cell therapies of 5 or 10 million discogenic cells in order to reduce the timeframe needed for substantial de novo GAG matrix deposition. Nonetheless, clinical follow‐up is typically from 6 months to 3 years, and it is speculated that longer timeframes, as well as better outcome measures, are still necessary to effectively detect these changes. 9 , 11 Although in silico modeling is a highly valuable tool, it is not exempt from caveats and limitations. Assumptions are made regarding the degradation rate of GAG, whereas the half‐life of aggrecan can change as a function of age or degeneration and may be an important parameter to explicitly measure in a patient‐specific manner. 9 , 65 Additionally, recent advancements have been made in the theoretical modeling of GAG biosynthesis. 66
The ability of the in silico model to simulate cell transplantation and classify disc remodeling under various environmental conditions must be viewed with caution, especially considering the potential for significant reductions in cellular survival and retention. Animal studies have demonstrated that the overall survival rate of injected cells is generally lower than that of the initially administered cell population. 67 , 68 , 69 In the case of human autologous disc cell transplantation, irregular distribution and the formation of cell clusters and agglomerates have been observed in patient samples. This is likely due to the compact nature of the disc matrix, which causes the injected cells to separate from the saline carrier solution. 70 However, employing a biomaterial carrier or delivery matrix has been shown to significantly improve cell retention. When saline is used as the carrier, retention rates can drop to as low as 10%. In contrast, using a fibrin matrix can significantly enhance retention rates, increasing them to as high as 35%–50%. 67
This is the first study to investigate the effect of GDF‐5 on human NP cell metabolism using concentrations relevant to those implemented in clinical trial protocols. While no statistically significant dose effect was detected for matrix synthesis rates, we observed that the OCR response was significantly higher for 2 mg of GDF‐5 compared to unstimulated NP cells. This has particular scientific merit for the clinical translation of biological therapies, as the large avascular nature of the IVD and its “hostile” nutrient microenvironment are often believed to be the significant hurdle for cell‐based regeneration. 43 , 71 Due to the limited availability of oxygen in vivo, it is suggested that disc cells predominantly rely on glycolysis as their energy source. 44 , 72 Studies have shown glucose to be the critical nutrient for NP cell survival and while cells have been reported to remain viable in sustained anoxia, 73 , 74 it appears oxygen exerts a significant influence on preserving the NP phenotype and regulating the production of crucial water‐binding GAGs within the ECM. 72 , 75 It is possible that such an effect was observed within this work, where the significantly upregulated OCR in the 2 mg group will reduce oxygen levels within the cell spheroids, thus contributing to the trend of reduced GAG synthesis. While this work only highlights a trend of increased LPR, implying no detection of a significant upregulation of glycolysis with increasing GDF‐5 dose, it has been reported previously that a murine cell line under increased growth factor concentrations resulted in proportional increases in glycolytic rates. 76 However, with highly variable human cells, from irregularly aged and diseased disc tissue, it is expected that significantly more donors may be necessary to detect significant dose‐dependent effects on metabolism and matrix synthesis.
In designing this study, it was considered that the metabolic rates of disc cells in a 3D spheroid configuration would be more relevant than those observed in more standard 2D studies. 3D culture provides enhanced cell‐to‐cell interactions and pericellular matrix deposition, which in turn supports better cell attachment, proliferation, matrix production, and phenotype expression. 9 However, it is important to acknowledge that 3D spheroids may not perfectly replicate the highly specialized ECM of native disc tissue. Additionally, due to the 3D and compact cell nature of the spheroids, an exact quantitative assessment of cell viability was not technically feasible. This is a limitation of the calculated rates as the viability was not quantitatively assessed to adjust the normalization by total DNA content, and may result in rates being calculated to a lower level. Future research should focus on developing biomimetic culture configurations that more accurately mimic the native disc ECM. Additionally, further research is necessary to assess how microenvironmental factors, such as altered nutrient environments (e.g., oxygen, glucose, and pH), variations in osmotic pressure due to disease states, and the presence of inflammatory cytokines, impact the metabolic rates of NP cells. Understanding these aspects will be important to advance our knowledge of disc cell metabolism and improve the relevance and accuracy of in silico models.
The in silico models within this work predicted that growth factor doses and/or cell therapies did not significantly perturb the nutrient microenvironment; however, higher doses of both would subsequently have greater effects. Although it is worth noting that these models are limited to being an idealized human microenvironment, the microenvironment into which these therapies are being administered may vary substantially from patient to patient. For example, studies have shown that some patients suffering from lower back pain have very low intradiscal oxygen levels and varying levels of acidity. 77 , 78 Taking this into account, the substantially higher OCR at 2 mg of GDF‐5 stimulation would have consequences for a potential therapy, particularly in a patient‐dependent manner. However, Bartels et al. noted substantial variation in oxygen levels within the patient cohort, and they could not identify any correlation between oxygen level, age, or stage of degeneration. 77 Together, this reinforces the concept of personalized regenerative medicine, where a biological therapeutic needs to be designed specifically for a patient's unique microenvironment. This work is limited to GDF‐5 effects on human NP cells; however, upregulation of matrix synthesis and perturbation of the nutrient microenvironment may vary depending on cell type. For example, we have previously shown that the OCR of TGF‐β stimulated bone marrow‐derived stem cells (BM‐MSCs) was upregulated approximately two‐fold, whereas OCR of articular chondrocytes tended to decrease. 79 Similarly, another study from our laboratory directly comparing porcine‐derived NP and NC microtissues found growth factors have differential effects on matrix synthesis depending on the cell type, with NP cells being relatively insensitive to the growth factors examined. 17
As mentioned previously, the relatively unresponsive and highly variable human NP cells, could be due to isolation from herniated tissue, where the aged and/or degenerated cells have limited capacity for matrix synthesis despite significantly strong GDF‐5 concentrations. With the large population variance among humans, the response to growth factors can vary from patient to patient. Factors such as the state of the growth factor (active or latent), the presence of receptors and co‐receptors in the cell membrane, and the signaling machinery inside the cell can influence the activity of a growth factor. Genetic variations may also play a role, where genes involved in signaling pathways can affect the efficacy and sensitivity of cells to stimulation. Therefore, it is important to consider all these factors when proposing growth factors as a regenerative therapy. Furthermore, a patient's past medical history may impact their response to growth factor injection; for example, the apparently unresponsive Donor 1 not only had a Grade IV degeneration but also a history of co‐morbidities. Nonetheless, this warrants further investigation, and more research is needed to better understand these underlying mechanisms and help healthcare providers develop personalized treatment approaches and optimized outcomes for biological therapeutics.
Another possible explanation for the donor variability and lack of response to GDF‐5 stimulation could be related to the expression of the BMPR2 receptor, to which GDF‐5 preferentially binds. BMPR2 activation attenuates the SMAD/TGF‐β pathway, a driver of regenerative processes in the disc, 80 with GAG synthesis shown to be regulated via SMAD2/3 in NP cells. 81 The significantly diminished expression of BMPR2 observed in Donor 1 (monolayer) and Donor 2 (monolayer and 3D) could suggest a mechanism behind the low GAG and collagen synthesis rates following GDF‐5 stimulation and the lack of predicted therapeutic outcomes in both donors. In contrast, Donor 3 (monolayer and 3D) and Donor 4 (monolayer) exhibited strong upregulation of BMPR2 and were predicted to have the most positive outcome following GDF‐5 treatment, with Donor 3 showing the most notable enhancement, reaching a Grade II level within 8 years of treatment. These findings further highlight the importance of developing patient‐specific treatment strategies and incorporating them into the future refinement of personalized medicine.
This work focused on the effect of different concentrations of GDF‐5 on the metabolism of these diseased human NP cells in vitro, before attempting to incorporate these measured values into an in silico model. Future work is needed to develop these in silico models into patient‐specific models. Pre‐operative MRI may be used relatively easily to create a patient‐specific geometry, while more specialized diffusion‐weighted MRI is required to create patient‐specific apparent diffusion coefficient maps. Although this technique may reflect diffusivity in patient‐specific discs, it is a measure of water molecules in tissues and not a direct measure of the solutes or metabolites of interest. Nonetheless, as shown in a recent study, such in vivo data is a valuable input for models, 39 and may be particularly insightful for assessing individual matrix composition and donor‐to‐donor variability.
A limitation of the current in silico modeling work is the lack of viability and survival thresholds for cells. Bovine NP cells have shown reduced viability when glucose concentration falls below 0.5 mM for more than 3 days. 73 In our current models, glucose concentrations were not predicted to fall below this minimum value for cell survival. Interestingly, Zhu et al. incorporated the effects of limited nutrition and dynamic loading on cell viability and demonstrated that increased frequency and amplitude both resulted in higher cell density, as theoretically, dynamic compression facilitated diffusion. 82 Together these studies show that more complex, interconnected studies are required to incorporate theoretical thresholds for cellular survival into our models. For example, recent advances have been made in agent‐based modeling using sub‐models in an attempt to capture cellular behavior in more multifactorial biochemical environments. 83 For the in silico model predictions, GAG synthesis is assumed to remain constant as it is calculated as the average GAG deposition rate over the 14‐day treatment period. Therefore, it is more akin to continuous GDF‐5 stimulation rather than a single‐dose treatment that dissipates over time. This may be considered a limitation of the study in terms of the practicality of a realistic treatment, and future studies could consider investigating the effect of GDF‐5 stimulation that dissipates over time. However, the results show that despite “continuous” stimulation the treatments do not actually provide a significant boosting effect.
This study captured the effect of static loading on nutrient transport by incorporating diffusion coefficients derived from experimental measurements of tissue under 10% compressive strain. 48 However, the effects of dynamic loading during daily activities are complex and multifactorial. These effects, which may influence nutrient transport and elicit mechanobiological responses, were not considered or modeled in this work. Animal studies have yielded mixed results regarding the impact of dynamic loading and forced convection “pumping” on nutrient transport. 84 , 85 , 86 Regarding mechanobiological effects on cellular activity, compressive loading has been found to significantly enhance the metabolism of AF cells, whereas the impact on NP cells remained largely unchanged. 87 A deeper understanding of the effects of dynamic compression on the metabolism and nutrient transport of degenerated and aged human disc cells is lacking and warrants further investigation.
While a minimally invasive regenerative or biological therapy, with the ability to target a younger cohort of patients earlier at the degenerative cascade, would revolutionize spinal healthcare, the arduous journey to its realization must be addressed. As biological products often exhibit unique characteristics and features, they frequently demand tailored development strategies and individualized assessments, rather than a one‐size‐fits‐all approach. This, coupled with the growing complexity of global regulatory standards, presents distinct challenges for therapeutic manufacturers. A prime example is BMP‐2, as mentioned previously, a potent osteoinductive growth factor which was FDA‐approved in 2002 after proving to augment bone regeneration and has since revolutionized the bone graft substitute market. 88 However, it was a long and costly journey; after multiple animal studies demonstrating potential in the 1990s, an investigational device exemption was granted in 1997. 89 Early clinical trial results for 780 patients were published from 2000 to 2004, noting that all trials were industry‐sponsored and performed by surgeons with high levels of investment in the success of BMP. 90 This underscores the extensive 10+‐year timeline and substantial financial investment necessary to introduce growth factors to the market. The typical cost ranges from $161 million to $4.54 billion to take new molecular entities to commercialization. 91
In the past, key requirements for success included ensuring safety, clinical effectiveness, and optimal performance. Nowadays, companies must supplement these criteria with the inclusion of cost‐effectiveness data for comparison. It has become necessary for companies to demonstrate that their products can contribute to the overall reduction in healthcare expenses and the societal cost burden. These products must substantiate their ability to decrease procedural costs, shorten patient hospital stays, and potentially reduce labor expenses. In general, the expenses associated with clinical trials for growth factor therapies can be significant due to factors such as research and development expenses, manufacturing outlays, adherence to regulatory mandates, patient recruitment and retention efforts, as well as the costs related to surveillance and data collection. Furthermore, the regulatory process involves ensuring that growth factors are produced and distributed in accordance with Good Manufacturing Practice guidelines. Therefore, these substantial financial burdens often serve as impediments to the progression and endorsement of growth factor therapies. 92 Meanwhile, investors must be persuaded of the therapeutic potential, the feasibility of obtaining FDA approval, and the assurance of eventual reimbursement.
5. CONCLUSION
The field of regenerative therapies for discogenic back pain faces significant challenges on the path to clinical adoption. Despite the limitations of conventional surgical treatments, there is currently no FDA‐approved regenerative therapy, and large‐scale randomized controlled trials have yet to demonstrate clinically significant improvements with investigational biological therapeutics. While several growth factors have been explored as potential solutions to address this challenge in animal models, the suitability and effectiveness of these therapies on human cells remains uncertain. The focus on GDF‐5 in this study highlights the potential of growth factors in promoting ECM synthesis in human NP cells, without significantly perturbing their metabolism or aggravating the nutrient microenvironment. Our findings suggest a trend of increased matrix synthesis with certain concentrations of GDF‐5 stimulation, though individual variability among donors must be acknowledged. This variability highlights the complexity of human response to biological treatments and reinforces the need for further human research and personalized approaches. Animal models, while informative, may not completely mirror the intricacies of the large avascular human IVD or the limited capacity of aged human cells. Further research using advanced in vitro testing, in silico modeling, and re‐evaluation of animal models is essential. These efforts will contribute to a deeper understanding of the mechanisms involved leading to the development of personalized treatment strategies, and the optimization of regenerative therapies in clinical practice. While the journey to realizing the full potential of regenerative therapies is demanding, it holds the promise of revolutionizing spinal healthcare and improving the quality of life for patients suffering from discogenic back pain.
AUTHOR CONTRIBUTIONS
Emily E. McDonnell and Conor T. Buckley contributed substantially to the conception and design of the work. Emily E. McDonnell performed the acquisition and interpretation of literature data, computational modeling, analysis, presentation and interpretation of results, drafting of the article, revising it critically, and final approval. Niamh Wilson and Tara Ní Néill contributed to the acquisition of laboratory data, analysis, and interpretation of results. Stacey L. Darwish and Joseph S. Butler contributed to the acquisition of surgical samples from the Mater Misericordiae University Hospital. Conor T. Buckley, as the overall project funding holder, takes responsibility for the integrity of the work from inception to the finalized article and provided substantial contribution to data interpretation and presentation. Emily E. McDonnell and Conor T. Buckley drafted the manuscript. All authors critically revised the manuscript and approved the final version.
CONFLICT OF INTEREST STATEMENT
Conor T. Buckley is an Editorial Board member of JOR Spine and co‐author of this article. They were excluded from editorial decision‐making related to the acceptance of this article for publication in the journal.
Supporting information
Data S1. Supplementary datasets associated with this article can be found in an online repository at DOI: 10.5281/zenodo.8316202.
ACKNOWLEDGMENTS
This project has received funding from the European Research Council (ERC) under the European Union's Horizon 2020 research and innovation programme (grant agreement ERC‐2019‐CoG‐864104; INTEGRATE). Open access funding provided by IReL.
McDonnell EE, Ní Néill T, Wilson N, Darwish SL, Butler JS, Buckley CT. In silico modeling the potential clinical effect of growth factor treatment on the metabolism of human nucleus pulposus cells. JOR Spine. 2024;7(3):e1352. doi: 10.1002/jsp2.1352
REFERENCES
- 1. Ucar D, Duman S, Bayram Y, Ucar BY. Extruded disc herniations are experienced earlier by inactive young people in the high‐tech gaming era. J Med Life. 2021;14:402‐407. [DOI] [PMC free article] [PubMed] [Google Scholar]
- 2. Samanta A, Lufkin T, Kraus P. Intervertebral disc degeneration—current therapeutic options and challenges. Front Public Health. 2023;11:1156749. [DOI] [PMC free article] [PubMed] [Google Scholar]
- 3. Pang X, Yang H, Peng B. Human umbilical cord mesenchymal stem cell transplantation for the treatment of chronic discogenic low back pain. Pain Physician. 2014;17:525‐530. [PubMed] [Google Scholar]
- 4. Kumar H, Ha DH, Lee EJ, et al. Safety and tolerability of intradiscal implantation of combined autologous adipose‐derived mesenchymal stem cells and hyaluronic acid in patients with chronic discogenic low back pain: 1‐year follow‐up of a phase i study. Stem Cell Res Ther. 2017;8:1‐14. [DOI] [PMC free article] [PubMed] [Google Scholar]
- 5. Elabd C, Centeno CJ, Schultz JR, Lutz G, Ichim T, Silva FJ. Intra‐discal injection of autologous, hypoxic cultured bone marrow‐derived mesenchymal stem cells in five patients with chronic lower back pain: a long‐term safety and feasibility study. J Transl Med. 2016;14:1‐9. [DOI] [PMC free article] [PubMed] [Google Scholar]
- 6. Pettine KA, Suzuki RK, Sand TT, Murphy MB. Treatment of discogenic back pain with autologous bone marrow concentrate injection with minimum two year follow‐up. Int Orthop. 2016;40:135‐140. [DOI] [PubMed] [Google Scholar]
- 7. Binch ALA, Fitzgerald JC, Growney EA, Barry F. Cell‐based strategies for IVD repair: clinical progress and translational obstacles. Nat Rev Rheumatol. 2021;17:158‐175. doi: 10.1038/s41584-020-00568-w [DOI] [PubMed] [Google Scholar]
- 8. Farhang N, Silverman LI, Bowles RD. Improving cell therapy survival and anabolism in harsh musculoskeletal disease environments. Tissue Eng Part B: Rev. 2020;26:348‐366. [DOI] [PubMed] [Google Scholar]
- 9. McDonnell EE, Wilson N, Barcellona MN, et al. Preclinical to clinical translation for intervertebral disc repair: effects of species‐specific scale, metabolism, and matrix synthesis rates on cell‐based regeneration. JOR Spine. 2023;6:e1279. [DOI] [PMC free article] [PubMed] [Google Scholar]
- 10. Vadalà G, Ambrosio L, Russo F, Papalia R, Denaro V. Stem cells and intervertebral disc regeneration overview − what they can and can't do. Int J Spine Surg. 2021;15:40‐53. doi: 10.14444/8054 [DOI] [PMC free article] [PubMed] [Google Scholar]
- 11. Schol J, Sakai D. Comprehensive narrative review on the analysis of outcomes from cell transplantation clinical trials for discogenic low back pain. N Am Spine Soc J. 2023;13:100195. [DOI] [PMC free article] [PubMed] [Google Scholar]
- 12. Ju DG, Kanim LE, Bae HW. Is there clinical improvement associated with intradiscal therapies? A comparison across randomized controlled studies. Glob Spine J. 2020;12:756‐764. doi: 10.1177/2192568220963058 [DOI] [PMC free article] [PubMed] [Google Scholar]
- 13. Papavassiliou AG, Pneumaticos SG, Evangelopoulos DS. Biologic treatment of mild and moderate intervertebral disc degeneration. Mol Med. 2014;20:400‐409. [DOI] [PMC free article] [PubMed] [Google Scholar]
- 14. Zhu L, Liu Y, Wang A, et al. Application of BMP in bone tissue engineering. Front Bioeng Biotechnol. 2022;10:810880. [DOI] [PMC free article] [PubMed] [Google Scholar]
- 15. Masuda K. Biological repair of the degenerated intervertebral disc by the injection of growth factors. Eur Spine J. 2008;17:441‐451. [DOI] [PMC free article] [PubMed] [Google Scholar]
- 16. Yun YR, Won JE, Jeon E, et al. Fibroblast growth factors: biology, function, and application for tissue regeneration. J Tissue Eng. 2010;1:1‐18. [DOI] [PMC free article] [PubMed] [Google Scholar]
- 17. Samuel S, McDonnell EE, Buckley CT. Effects of growth factor combinations TGFβ3, GDF5 and GDF6 on the matrix synthesis of nucleus pulposus and nasoseptal chondrocyte self‐assembled microtissues. Appl Sci. 2022;12:1453. [Google Scholar]
- 18. Guo S, Cui L, Xiao C, et al. The mechanisms and functions of GDF‐5 in intervertebral disc degeneration. Orthop Surg. 2021;13:734‐741. [DOI] [PMC free article] [PubMed] [Google Scholar]
- 19. Hodgkinson T, Shen B, Diwan A, Hoyland JA, Richardson SM. Therapeutic potential of growth differentiation factors in the treatment of degenerative disc diseases. JOR Spine. 2019;2:e1045. [DOI] [PMC free article] [PubMed] [Google Scholar]
- 20. Zhang Y, Chee A, Thonar EJMA, An HS. Intervertebral disk repair by protein, gene, or cell injection: a framework for rehabilitation‐focused biologics in the spine. PM&R. 2011;3:S88‐S94. [DOI] [PubMed] [Google Scholar]
- 21. Lv B, Gan W, Cheng Z, et al. Current insights into the maintenance of structure and function of intervertebral disc: a review of the regulatory role of growth and differentiation factor‐5. Front Pharmacol. 2022;13:1‐12. [DOI] [PMC free article] [PubMed] [Google Scholar]
- 22. Kennon JC, Awad ME, Chutkan N, Devine J, Fulzele S. Current insights on use of growth factors as therapy for intervertebral disc degeneration. Biomol Concepts. 2018;9:43‐52. [DOI] [PubMed] [Google Scholar]
- 23. Walsh AJL, Bradford DS, Lotz JC. In vivo growth factor treatment of degenerated intervertebral discs. Spine. 2004;29:156‐163. [DOI] [PubMed] [Google Scholar]
- 24. Liang H, Ma SY, Feng G, Shen FH, Joshua Li X. Therapeutic effects of adenovirus‐mediated growth and differentiation factor‐5 in a mice disc degeneration model induced by annulus needle puncture. Spine J. 2010;10:32‐41. [DOI] [PMC free article] [PubMed] [Google Scholar]
- 25. Yan J, Yang S, Sun H, et al. Effects of releasing recombinant human growth and differentiation factor‐5 from poly(lactic‐co‐glycolic acid) microspheres for repair of the rat degenerated intervertebral disc. J Biomater Appl. 2014;29:72‐80. [DOI] [PubMed] [Google Scholar]
- 26. Zhu J, Xia K, Yu W, et al. Sustained release of GDF5 from a designed coacervate attenuates disc degeneration in a rat model. Acta Biomater. 2019;86:300‐311. [DOI] [PubMed] [Google Scholar]
- 27. Hu A, Xing R, Jiang L, et al. Thermosensitive hydrogels loaded with human‐induced pluripotent stem cells overexpressing growth differentiation factor‐5 ameliorate intervertebral disc degeneration in rats. J Biomed Mater Res Part B Appl Biomater. 2020;108:2005‐2016. doi: 10.1002/jbm.b.34541 [DOI] [PubMed] [Google Scholar]
- 28. Yuan B, Rudeen K, Li J, et al. Biodegradable microspheres and hydrogel drug delivery system of tumor necrosis factor (TNF) inhibitor and growth differentiation factor 5 (GDF5) reduces disc inflammation in the rabbit model. Spine. 2023;48:E257‐E265. doi: 10.1097/BRS.0000000000004686 [DOI] [PubMed] [Google Scholar]
- 29. Chujo T, An HS, Akeda K, et al. Effects of growth differentiation factor‐5 on the intervertebral disc – in vitro bovine study and in vivo rabbit disc degeneration model study. Spine. 2006;31:2909‐2917. [DOI] [PubMed] [Google Scholar]
- 30. Ju DG, Kanim LE, Bae HW. Intervertebral disc repair: current concepts. Glob Spine J. 2020;10:130S. [DOI] [PMC free article] [PubMed] [Google Scholar]
- 31. Krut Z, Pelled G, Gazit D, Gazit Z. Stem cells and exosomes: new therapies for intervertebral disc degeneration. Cells. 2021;10:1‐19. [DOI] [PMC free article] [PubMed] [Google Scholar]
- 32. Kafienah W, Sims TJ. Biochemical methods for the analysis of tissue‐engineered cartilage. Methods Mol Biol. 2004;238:217‐230. [DOI] [PubMed] [Google Scholar]
- 33. Ignat'eva NY, Danilov NA, Averkiev SV, Obrezkova MV, Lunin VV, Sobol EN. Determination of hydroxyproline in tissues and the evaluation of the collagen content of the tissues. J Anal Chem. 2007;62:51‐57. [Google Scholar]
- 34. McDonnell EE. From ‘Bench to Bedside’: in‐Silico Modelling to Inform the Assessment of Intervertebral Disc Cell‐Based Therapies. Thesis. Trinity College Dublin. 2023.
- 35. Morita K, Volleman TNE, Sakai D, Sato M, Watanabe M. Screening for growth‐factor combinations enabling synergistic differentiation of human MSC to nucleus pulposus cell‐like cells. Appl Sci. 2021;11:3673. [Google Scholar]
- 36. Bibby S, Jones DA, Ripley RM, Urban JPG. Metabolism of the intervertebral disc: effects of low levels of oxygen, glucose, and pH on rates of energy metabolism of bovine nucleus pulposus cells. Spine. 2005;30:487‐496. [DOI] [PubMed] [Google Scholar]
- 37. Huang C‐YC, Yuan T‐Y, Jackson AR, Hazbun L, Fraker C, Gu WY. Effects of low glucose concentrations on oxygen consumption rates of intervertebral disc cells. Spine. 2007;32:2063‐2069. [DOI] [PMC free article] [PubMed] [Google Scholar]
- 38. Huang C‐YC, Gu WY. Effects of mechanical compression on metabolism and distribution of oxygen and lactate in intervertebral disc. J Biomech. 2008;41:1184‐1196. [DOI] [PMC free article] [PubMed] [Google Scholar]
- 39. Shalash W, Ahrens SR, Bardonova LA, Byvaltsev VA, Giers MB. Patient‐specific apparent diffusion maps used to model nutrient availability in degenerated intervertebral discs. JOR Spine. 2021;4:e1179. [DOI] [PMC free article] [PubMed] [Google Scholar]
- 40. Gu WY, Zhu Q, Gao X, Brown MD. Simulation of the progression of intervertebral disc degeneration due to decreased nutritional supply. Spine. 2014;39:1411‐1417. [DOI] [PMC free article] [PubMed] [Google Scholar]
- 41. Zhu Q, Gao X, Temple HT, Brown MD, Gu WY. Simulation of biological therapies for degenerated intervertebral discs. J Orthop Res. 2016;34:699‐708. [DOI] [PMC free article] [PubMed] [Google Scholar]
- 42. McDonnell EE, Buckley CT. Two‐ and three‐dimensional in vitro nucleus pulposus cultures: an in silico analysis of local nutrient microenvironments. JOR Spine. 2022;5:e1222. [DOI] [PMC free article] [PubMed] [Google Scholar]
- 43. McDonnell EE, Buckley CT. Consolidating and re‐evaluating the human disc nutrient microenvironment. JOR Spine. 2022;5:e1192. [DOI] [PMC free article] [PubMed] [Google Scholar]
- 44. Holm S, Maroudas A, Urban JPG, Selstam G, Nachemson A. Nutrition of the intervertebral disc: solute transport and metabolism. Connect Tissue Res. 1981;8:101‐119. [DOI] [PubMed] [Google Scholar]
- 45. Boubriak OA, Lee RB, Urban JPG. Nutrient supply to cells of the intervertebral disc; effect of diurnal hydration changes. 49th Annual Meeting of the Orthopaedic Research Society. Poster #11. 2003.
- 46. Haselgrove JC, Shapiro IM, Silverton SF. Computer modeling of the oxygen supply and demand of cells of the avian growth cartilage. Am J Physiol. 1993;265:C497‐C506. doi: 10.1152/ajpcell.1993.265.2.c497 [DOI] [PubMed] [Google Scholar]
- 47. Obradovic B, Meldon JH, Freed LE, Vunjak‐Novakovic G. Glycosaminoglycan deposition in engineered cartilage: experiments and mathemetical model. AIChE J. 2000;46:1860‐1871. doi: 10.1002/aic.690460914 [DOI] [Google Scholar]
- 48. Jackson AR, Yuan T‐Y, Huang C‐YC, Travascio F, Gu WY. Effect of compression and anisotropy on the diffusion of glucose in annulus fibrosus. Spine. 2008;33:1‐7. [DOI] [PMC free article] [PubMed] [Google Scholar]
- 49. Jackson AR, Yuan T‐Y, Huang C‐YC. Nutrient transport in human annulus fibrosus is affected by compressive strain and anisotropy. Ann Biomed Eng. 2012;40:1‐8. [DOI] [PMC free article] [PubMed] [Google Scholar]
- 50. Maroudas A, Stockwell R, Nachemson A, Urban JPG. Factors involved in the nutrition of the human lumbar intervertebral disc: cellularity and diffusion of glucose in vitro. J Anat. 1975;120:113‐130. [PMC free article] [PubMed] [Google Scholar]
- 51. Martins D, de Medeiros VP, Wajchenberg M, et al. Changes in human intervertebral disc biochemical composition and bony end plates between middle and old age. PLoS One. 2018;13:1‐17. [DOI] [PMC free article] [PubMed] [Google Scholar]
- 52. Liebscher T, Haefeli M, Wuertz K, Nerlich AG, Boos N. Age‐related variation in cell density of human lumbar intervertebral disc. Spine. 2011;36:153‐159. [DOI] [PubMed] [Google Scholar]
- 53. Antoniou J, Steffen T, Nelson F, et al. The human lumbar intervertebral disc evidence for changes in the biosynthesis and denaturation of the extracellular matrix with growth, maturation, ageing, and degeneration. J Clin Invest. 1996;98:996‐1003. [DOI] [PMC free article] [PubMed] [Google Scholar]
- 54. Nickel J, Kotzsch A, Sebald W, Mueller TD. A single residue of GDF‐5 defines binding specificity to BMP receptor IB. J Mol Biol. 2005;349:933‐947. [DOI] [PubMed] [Google Scholar]
- 55. Nishitoh H, Ichijo H, Kimura M, et al. Identification of type I and type II serine/threonine kinase receptors for growth/differentiation factor‐5. J Biol Chem. 1996;271:21345‐21352. [DOI] [PubMed] [Google Scholar]
- 56. Francis‐West PH, Abdelfattah A, Chen P, et al. Mechanisms of GDF‐5 action during skeletal development. Development. 1999;126:1305‐1315. [DOI] [PubMed] [Google Scholar]
- 57. Aswad H, Jalabert A, Rome S. Depleting extracellular vesicles from fetal bovine serum alters proliferation and differentiation of skeletal muscle cells in vitro. BMC Biotechnol. 2016;16:32. doi: 10.1186/s12896-016-0262-0 [DOI] [PMC free article] [PubMed] [Google Scholar]
- 58. Basatvat S, Bach FC, Barcellona MN, et al. Harmonization and standardization of nucleus pulposus cell extraction and culture methods. JOR Spine. 2023;6:e1238. [DOI] [PMC free article] [PubMed] [Google Scholar]
- 59. Colombier P, Clouet J, Boyer C, et al. TGF‐β1 and GDF5 act synergistically to drive the differentiation of human adipose stromal cells toward nucleus pulposus‐like cells. Stem Cells. 2016;34:653‐667. [DOI] [PubMed] [Google Scholar]
- 60. Daly C, Ghosh P, Jenkin G, Oehme D, Goldschlager T. A review of animal models of intervertebral disc degeneration: pathophysiology, regeneration, and translation to the clinic. Biomed Res Int. 2016;2016:1‐14. [DOI] [PMC free article] [PubMed] [Google Scholar]
- 61. Fusellier M, Clouet J, Gauthier O, Tryfonidou M, le Visage C, Guicheux J. Degenerative lumbar disc disease: in vivo data support the rationale for the selection of appropriate animal models. Eur Cells Mater. 2020;39:18‐47. [DOI] [PubMed] [Google Scholar]
- 62. Poletto DL, Crowley JD, Tanglay O, Walsh WR, Pelletier MH. Preclinical in vivo animal models of intervertebral disc degeneration. Part 1: a systematic review. JOR Spine. 2023;6(1):e1234. doi: 10.1002/JSP2.1234 [DOI] [PMC free article] [PubMed] [Google Scholar]
- 63. An HS, Takegami K, Kamada H, et al. Intradiscal administration of osteogenic protein‐1 increases intervertebral disc height and proteoglycan content in the nucleus pulposus in normal adolescent rabbits. Spine. 2005;30:25‐31. [DOI] [PubMed] [Google Scholar]
- 64. Masuda K, Imai Y, Okuma M, et al. Osteogenic protein‐1 injection into a degenerated disc induces the restoration of disc height and structural changes in the rabbit anular puncture model. Spine. 2006;31:742‐754. [DOI] [PubMed] [Google Scholar]
- 65. Sivan SS, Hayes AJ, Wachtel E, et al. Biochemical composition and turnover of the extracellular matrix of the normal and degenerate intervertebral disc. Eur Spine J. 2014;23:344‐353. [DOI] [PubMed] [Google Scholar]
- 66. Huang CY, Loo DM, Gu W. Modeling of glycosaminoglycan biosynthesis in intervertebral disc cells. Comput Biol Med. 2023;162:107039. [DOI] [PubMed] [Google Scholar]
- 67. Bertram H, Kroeber M, Wang H, et al. Matrix‐assisted cell transfer for intervertebral disc cell therapy. Biochem Biophys Res Commun. 2005;331:1185‐1192. [DOI] [PubMed] [Google Scholar]
- 68. Vadalà G, Sowa G, Hubert M, Gilbertson LG, Denaro V, Kang JD. Mesenchymal stem cells injection in degenerated intervertebral disc: cell leakage may induce osteophyte formation. J Tissue Eng Regen Med. 2012;6:348‐355. [DOI] [PubMed] [Google Scholar]
- 69. Crevensten G, Walsh AJL, Ananthakrishnan D, et al. Intervertebral disc cell therapy for regeneration: mesenchymal stem cell implantation in rat intervertebral discs. Ann Biomed Eng. 2004;32:430‐434. [DOI] [PubMed] [Google Scholar]
- 70. Schwan S, Ludtka C, Friedmann A, et al. Calcium microcrystal formation in recurrent herniation patients after autologous disc cell transplantation. Tissue Eng Regen Med. 2017;14:803‐814. [DOI] [PMC free article] [PubMed] [Google Scholar]
- 71. Smith LJ, Silverman L, Sakai D, et al. Advancing cell therapies for intervertebral disc regeneration from the lab to the clinic: recommendations of the ORS spine section. JOR Spine. 2018;1(4):e1036. doi: 10.1002/jsp2.1036 [DOI] [PMC free article] [PubMed] [Google Scholar]
- 72. Ishihara H, Urban JPG. Effects of low oxygen concentrations and metabolic inhibitors on proteoglycan and protein synthesis rates in the intervertebral disc. J Othop Res. 1999;17:829‐835. [DOI] [PubMed] [Google Scholar]
- 73. Horner HA, Urban JPG. Volvo award winner in basic science studies: effect of nutrient supply on the viability of cells from the nucleus pulposus of the intervertebral disc. Spine. 2001;26:2543‐2549. [DOI] [PubMed] [Google Scholar]
- 74. Bibby S, Urban JPG. Effect of nutrient deprivation on the viability of intervertebral disc cells. Eur Spine J. 2004;13:695‐701. [DOI] [PMC free article] [PubMed] [Google Scholar]
- 75. Mwale F, Ciobanu I, Giannitsios D, Roughley P, Steffen T, Antoniou J. Effect of oxygen levels on proteoglycan synthesis by intervertebral disc cells. Spine. 2011;36:131‐138. [DOI] [PubMed] [Google Scholar]
- 76. Vander Heiden MG, Plas DR, Rathmell JC, Fox CJ, Harris MH, Thompson CB. Growth factors can influence cell growth and survival through effects on glucose metabolism. Mol Cell Biol. 2001;21:5899‐5912. [DOI] [PMC free article] [PubMed] [Google Scholar]
- 77. Bartels EM, Fairbank JCT, Winlove PC, Urban JPG. Oxygen and lactate concentrations measured in vivo in the intervertebral discs of patients with scoliosis and back pain. Spine. 1998;23:1‐7. [DOI] [PubMed] [Google Scholar]
- 78. Nachemson A. Intradiscal measurements of ph in patients with lumbar rhizopathies. Acta Orthop. 1969;40:23‐42. [DOI] [PubMed] [Google Scholar]
- 79. Gansau J, Buckley CT. Priming as a strategy to overcome detrimental PH effects on cells for intervertebral disc regeneration. Eur Cells Mater. 2021;41:153‐169. doi: 10.22203/eCM.v041a11 [DOI] [PubMed] [Google Scholar]
- 80. Zieba J, Forlenza KN, Heard K, et al. Intervertebral disc degeneration is rescued by TGFβ/BMP signaling modulation in an ex vivo filamin B mouse model. Bone Res. 2022;101(10):1‐12. [DOI] [PMC free article] [PubMed] [Google Scholar]
- 81. Hu B, Xu C, Cao P, et al. TGF‐β stimulates expression of chondroitin polymerizing factor in nucleus pulposus cells through the Smad3, RhoA/ROCK1, and MAPK signaling pathways. J Cell Biochem. 2018;119:566‐579. [DOI] [PubMed] [Google Scholar]
- 82. Zhu Q, Jackson AR, Gu WY. Cell viability in intervertebral disc under various nutritional and dynamic loading conditions: 3D finite element analysis. J Biomech. 2012;45:2769‐2777. [DOI] [PMC free article] [PubMed] [Google Scholar]
- 83. Baumgartner L, Reagh JJ, González Ballester MA, Noailly J. Simulating intervertebral disc cell behaviour within 3D multifactorial environments. Bioinformatics. 2021;37:1246‐1253. doi: 10.1093/bioinformatics/btaa939 [DOI] [PMC free article] [PubMed] [Google Scholar]
- 84. Urban JPG, Holm S. Nutrition of the intervertebral disc: effect of fluid flow on solute transport. Clin Orthop Relat Res. 1982; 170: 296‐302. [PubMed] [Google Scholar]
- 85. Katz MM, Hargens AR, Garfin SR. Intervertebral disc nutrition. Diffusion versus convection. Clin Orthop Relat Res. 1986; 210:243‐245. [PubMed] [Google Scholar]
- 86. Gullbrand SE, Peterson J, Ahlborn J, Mastropolo R. ISSLS prize winner: dynamic loading‐induced convective transport enhances intervertebral disc nutrition. Spine. 2015;40:1158‐1164. [DOI] [PubMed] [Google Scholar]
- 87. Salvatierra JC, Yuan TY, Fernando H, et al. Difference in energy metabolism of annulus fibrosus and nucleus pulposus cells of the intervertebral disc. Cell Mol Bioeng. 2011;4:302‐310. [DOI] [PMC free article] [PubMed] [Google Scholar]
- 88. James AW, LaChaud G, Shen J, et al. A review of the clinical side effects of bone morphogenetic protein‐2. Tissue Eng Part B Rev. 2016;22:284‐297. [DOI] [PMC free article] [PubMed] [Google Scholar]
- 89. Hustedt JW, Blizzard DJ. The controversy surrounding bone morphogenetic proteins in the spine: a review of current research. Yale J Biol Med. 2014;87:549‐561. [PMC free article] [PubMed] [Google Scholar]
- 90. Carragee EJ, Hurwitz EL, Weiner BK. A critical review of recombinant human bone morphogenetic protein‐2 trials in spinal surgery: emerging safety concerns and lessons learned. Spine J. 2011;11:471‐491. [DOI] [PubMed] [Google Scholar]
- 91. Schlander M, Hernandez‐Villafuerte K, Cheng CY, Mestre‐Ferrandiz J, Baumann M. How much does it cost to research and develop a new drug? A systematic review and assessment. Pharmacoeconomics. 2021;39:1243‐1269. [DOI] [PMC free article] [PubMed] [Google Scholar]
- 92. Moore TJ, Heyward J, Anderson G, Alexander GC. Variation in the estimated costs of pivotal clinical benefit trials supporting the US approval of new therapeutic agents, 2015–2017: a cross‐sectional study. BMJ Open. 2020;10:e038863. [DOI] [PMC free article] [PubMed] [Google Scholar]
Associated Data
This section collects any data citations, data availability statements, or supplementary materials included in this article.
Supplementary Materials
Data S1. Supplementary datasets associated with this article can be found in an online repository at DOI: 10.5281/zenodo.8316202.