

Abstract
Background
Diabetic nephropathy (DN) is the leading cause of end-stage renal disease. Exosomes are promising biomarkers for disease diagnosis and uromodulin is a kidney-specific protein. So, this study was designed to investigate the change in the gene expression of urinary exosomal uromodulin mRNA and urinary uromodulin level and determine the diagnostic potential of these noninvasive biomarkers in the early stage of diabetic nephropathy in type 2 diabetic patients.
Method
This study included 100 participants; urinary exosomes were isolated using polyethylene glycol (PEG). Gene expression of exosomal uromodulin mRNA was determined by quantitative real-time polymerase chain reaction (q-RT-PCR). The urinary uromodulin levels were determined by an enzyme-linked immunosorbent assay (ELISA).
Result
In this study, the gene expression of exosomal uromodulin (UMOD) mRNA and the level of urinary uromodulin showed a significant increase in all diabetic groups with and without nephropathy compared to the control group. The exosomal UMOD mRNA showed a significant positive correlation with urinary uromodulin in all groups. Multiple logistic regression showed that urinary uromodulin was an independent determinant for DN. A diagnostic model of two indicators, exosomal UMOD mRNA and urinary uromodulin, can significantly predict DN. The area under the curve is 0.095, with a 95% confidence interval of 0.98–1, and 0.81, with a 95% confidence interval of 0.69–0.92, for the exosomal UMOD mRNA and urinary uromodulin, respectively.
Conclusion
Urinary exosomal mRNA of UMOD and urinary uromodulin levels are progressively elevated in an early stage of DN, even before the microalbuminuria stage, so they could be used as early predictors for DN.
Keywords: Diabetic nephropathy, Urinary exosomes, Uromodulin mRNA, Urinary uromodulin
Introduction
Diabetic nephropathy (DN) is one of the major microvascular complications of diabetes and most frequently results in end-stage renal disease (ESRD). DN is characterized pathophysiologically by an early phase of glomerular hypertrophy, hyperfiltration, and interstitial fibrosis associated with albuminuria (ACR≧30 mg/g creatinine) [1]. Numerous biomarkers have been proposed for DN diagnosis, such as the urinary albumin to creatinine ratio (ACR) which is conventionally used to assess the severity of DN. However, recent studies exhibit conflicting findings regarding the specificity and sensitivity of this biomarker. Notably, advanced pathological changes in glomerular and tubular structure and function may be developed in several patients without a change in urinary albumin level [2]. It can be clearly detected by a kidney biopsy, which is an invasive procedure with a risk of hemorrhage [3]. Therefore, the identification of novel non-invasive biomarkers for the early detection of DN is mandatory to reduce the progression toward ESRD [2].
Uromodulin, also known as Tamm–Horsfall protein (THP), can be considered a biomarker for kidney tubular function as it is a kidney-specific protein that is synthesized mainly in the epithelial cells of the thick ascending limb (TAL) of Henle’s loop and the initial part of the distal convoluted tubule (DCT). Structurally, uromodulin is a 105 kDa glycosyl phosphatidyl inositol (GPI) glycoprotein and the most abundant urinary protein [4]. Uromodulin has a role in the regulation of water-electrolyte balance as it controls Na+, K+, and Cl− reabsorption by regulating the activity of Na+, K+, 2Cl− cotransporter (NKCC2) [5], and renal outer medullary K+ channel (ROMK2) [6]. It also provides protection against urinary tract infection by binding type I toxin of bacteria E.coli [5], preventing calcium aggregation and kidney stone formation by upregulating calcium channel transient receptor potential cation subfamily V member 5 (TRPV5) [7]. Moreover, it exhibits an immunomodulatory effect by activating granulocytes and mediating monocyte cytotoxicity through binding to toll-like receptor 4 (TLR4) [8]; Conversely, it has an anti-inflammatory effect against ischemia–reperfusion injury (IRI) through cross-talk phenomena [9]. Uromodulin is encoded by the UMOD gene, which is located on chromosome 16p12.3, consisting of 11 exons, with the coding sequences spanning 10 exons starting from exon 2 [10].
Exosomes are specialized compartments of extracellular vesicles (EVs). EVs are lipid bilayers detached from cells and can be categorized into two major groups based on their biogenesis: exosomes (50–150 nm) and microvesicles (MVs) (150–1000 nm) [11]. Exosomes are released by the budding of endosomes into multivesicular bodies (MVBs), which contain several intraluminal vesicles (ILVs). Upon fusion with the plasma membrane, exosomes are released into extracellular space [12, 13]. MVs are formed by direct outward budding and shedding from the cell membrane [14].
Urinary exosomes have emerged as a promising biomarker, originating from diverse cell types within the kidney. These vesicles encompass an array of constituents, including proteins and genetic materials (miRNA, DNA, and RNA), carbohydrates, and lipids. This content varies based on the cell's origin, thereby reflecting the pathological state of the cells. In the early stage of DN, hypoxia-inducible factor-1 increases the production of exosomes from kidney tubules, so they could provide a diagnostic biomarker without invasive biopsy [15]. The mRNA of UMOD was extracted from the urinary exosomes because it is more stable as it is protected by the lipid bilayer membrane of the exosomes [16].
EVs have recently been studied as a new form of cellular communication; moreover, they have a critical role in disease prognosis and diagnosis [16], as they are produced from different cell types and presence in various body fluids such as blood, saliva, urine, breast milk, cerebrospinal fluid, amniotic fluid, and ascitic fluid [17]. EVs participate in cell-to-cell communication by transferring RNA from one cell to another, aiding in the design of new therapeutic protocols by modifying RNA and delivering it to the target cells [18]. Conversely, they also contribute to the development of several diseases, such as cardiovascular disease, neurodegenerative disease, and cancer metastasis, by transferring signals and programming the target cells [19]. The objective of this study was to evaluate the urinary exosomal UMOD mRNA and urinary uromodulin level as potential biomarkers for diabetic nephropathy in type 2 diabetic patients.
Subjects and methods
Subjects
This is a case–control study that was carried out on 100 subjects matched for age and sex, with ages ranged from 40 to 65 years. 25 were healthy subjects as a control group (GR I), and 75 subjects diagnosed with type 2 diabetes (T2DM) were recruited from the Internal Medicine Department, Tanta University Hospital. The T2DM patients were further categorized into three groups based on criteria that were set by the American Diabetes Association according to the albumin-to-creatinine ratio (ACR) [20], normoalbuminuria (n = 25, ACR < 30 mg/g creatinine) (GR II), microalbuminuria (n = 25, ACR 30–300 mg/g creatinine) (GR III), and macroalbuminuria (n = 25, ACR > 300 mg/g creatinine) (GR IV). DN was identified by elevated urinary albumin-to-creatinine ratio (ACR ≥ 30 mg/g creatinine). Patients with the existence of non-diabetic kidney diseases, urinary tract infections, liver diseases, autoimmune, inflammatory, or neoplastic diseases were excluded.
Samples collection
20 ml of first-morning urine samples were collected from each participant. The samples were centrifuged at 3000 xg for 10 min at 4 ℃ to remove any cell debris. 3 ml was used to urinary estimate ACR, and 15 ml of each sample was stored at – 80 ℃ until analysis. After 10 h of overnight fasting, 6 ml of blood samples were collected for the biochemical parameters assay, and 1 ml of venous blood was drawn from each subject 2 h after the meal for estimation of postprandial blood glucose level (PBG).
Biochemical assay
HbA1c, fasting and postprandial blood glucose, ACR, cystatin-C, creatinine, blood urea nitrogen (BUN), and lipid profile were estimated by commercial kits supplied by Dialab (Dialab, Austria) according to the manufacturer’s instructions. Serum Na+ and K+ were estimated by the electrolyte analyzer Rapid Chem 744 (Siemens, Germany) according to the manufacturer’s instructions. eGFR was based on creatinine and calculated by the Modification of Diet in Renal Disease equation (MDRD).
Estimation of urine uromodulin level
Urinary uromodulin was determined by a sandwich ELIZA kit supplied by (Cloud-Clone, USA, catalog No. SEG918Hu) according to the manufacturer’s instructions and it was normalized by urinary creatinine (uUCR).
Exosomes isolation
Exosomes were isolated by polymer precipitation using polyethylene glycol (PEG) with a molecular weight of 6000 Da (Sigma, USA). 25 g of PEG and 1 M NaCl were dissolved in 50 ml of distilled water and ultrasonicated for 10 min. The PEG solution was centrifuged at 5000 xg for 20 min at 4 ℃. Mother liquor (50% + 1 M NaCl).
Urine samples that were stored at − 80 °C were brought out, thawed on ice, and vortexed for 90 s. 15 ml of each sample was mixed with PEG to a final concentration of 10% of PEG. The mixture was mixed by inverting the tube several times to mix well. After overnight incubation at 4 ℃, the samples were centrifuged at 4000 xg for 1 h at 4 ℃ to pellet the exosomes, and the supernatant was removed and centrifuged again for 5 min at 4 ℃ to remove any residual supernatant. The exosome pellet was resuspended in 200 μl of phosphate buffer saline (PBS) for RNA extraction [21, 22].
Urinary exosome identification
A. Exosome morphology and size characterization
Exosome morphology and size were visualized by scanning electron microscopy (SEM). The PEG-extracted exosome pellet was fixed with 2% (v/v) glutaraldehyde in PBS overnight. After being washed by PBS three times, it was exposed to gradual dehydration with ethanol (30, 50, 70, and 95%) for 10 min at each concentration. Subsequently, the sample was air-dried at room temperature. After that, the sample was coated with gold (JFC-1100E ION SPUTTERING DEVICE, JEOL, Japan). The coated sample was observed using a scanning electron microscope, JSM - IT200 (JEOL, Japan).
b. Feasibility of exosomes for RNA analysis
The feasibility of exosomes for downstream analysis of RNA was confirmed by RNA extraction. This involved a systematic process to isolate RNA from the exosome samples, ensuring that the extracted RNA was of sufficient quality and quantity for subsequent analyses.
qRT-PCR detection
Total RNA from urinary exosomes was extracted by (Geneaid) extraction kit according to the manufacturer’s instructions. The exosomal RNA purity was evaluated spectrophotometrically by nano-volume SCANDROP 200 (Analytik-Jena, Thuringia, Germany) at absorbances of 260 and 280 nm. A 260/280 ratio was used to assess the presence of protein contaminants. cDNA was synthesized by the TOP script M-MLV RT Dry Mix Kit (Enzynomic). Primers were designed using the IDT primer quest for two distinct genes: uromodulin and beta-actin (ACTB). The primer sequences for uromodulin (forward: GACAGTGTTGACGAGGAATGA, reverse: GATGTTGAGGTCACGGATGAT). Likewise, for ACTB (forward: GACCCAGATCATGTTTGAGACC, reverse: CCAGAGGCGTACAGGGATA). Real-time PCR was performed on a Rotor-Gene Q (Qiagen, Valencia, CA) instrument, and ACTB was used as a housekeeping gene to normalize the obtained data [23]. The instrument uses the following profiles: initial denaturation at 95 ℃ for 10 s, annealing at 60 ℃ for 15 s, and elongation at 72 ℃ for 30 s. Raw threshold cycle (Ct) values were obtained by rotor-gene version 2.0.3.2 software (Qiagen, Valencia, CA). Results were analyzed by relative quantification with the comparative Ct method.
Statistical analyses
All statistical analyses were performed with SPSS software 25 (SPSS, Chicago, Il, USA). All data were analyzed for normality using the Shapiro–Wilk test. The biochemical parameters were represented as mean ± standard deviation (SD) and compared statistically using one-way ANOVA followed by Games–Howell multiple comparison tests to determine statistical significance between various groups. For non-parametric comparison of UMOD mRNA fold change expressed as median (interquartile range) (IQR), the Kruskal–Wallis test was used to evaluate the difference between groups.
Pearson’s correlation was used to determine the relationship between urinary uromodulin and other parameters, and Spearman's non-parametric rank was used to determine the correlation between urinary exosomal UMOD mRNA, urinary uromodulin level, and other parameters.
Receiver operator characteristic curve analysis (ROC) was performed, and the area under the curve (AUC) was calculated to evaluate the diagnostic accuracy of the UMOD gene and urinary uromodulin. Multivariant logistic regression was performed to determine the association between urinary uromodulin and the presence of DN.
Results
The biochemical parameters
Clinical and biochemical parameters of subjects who participated in this study are summarized in Table 2, which illustrates that fasting blood glucose (FBG), postprandial blood glucose (PBG), and glycosylated hemoglobin (HbA1C) were significantly increased in all diabetic groups with and without nephropathy compared with the healthy control group (p < 0.001). ACR was significantly elevated in all diabetic groups compared to the healthy control group (p < 0.001). Specifically, cystatin-C and creatinine levels exhibited a significant increase in individuals with microalbuminuria and macroalbuminuria compared to the healthy control group (p < 0.001), while eGFR showed a significant decrease in microalbuminuria and macroalbuminuria compared to the healthy control group (p < 0.001).
Table 2.
Correlation of urinary uromodulin and urinary uromodulin/creatinine ratio with other kidney function biomarkers
| GR II Normoalbuminuria n = 25 |
GR III Microalbuminuria n = 25 |
GR IV Macroalbuminuria n = 25 |
|||||
|---|---|---|---|---|---|---|---|
| Urinary uromodulin | Urinary uromodulin/creatinine | Urinary uromodulin | Urinary uromodulin/creatinine | Urinary uromodulin | Urinary uromodulin/creatinine | ||
| Serum Creatinine (mg/dl) | r | 0.481 | 0.319 | 0.682 | 0.483 | − 0.654 | − 0.422 |
| p | 0.007** | 0.06* | 0.001** | 0.007** | 0.001** | 0.018* | |
| BUN (mg/dl) | r | 0.381 | 0.273 | 0.341 | 0.405 | − 0.344 | − 0.219 |
| p | 0.03* | 0.093 | 0.048* | 0.022* | 0.046* | 0.146 | |
| eGFR (ml/min/1.73m2) | r | − 0.346 | − 0.536 | − 0.669 | − 0.652 | 0.393 | 0.361 |
| p | 0.045* | 0.003** | 0.001** | 0.001** | 0.025* | 0.038* | |
| Serum cystatin-C (mg/l) | r | 0.642 | 0.344 | 0.593 | 0.663 | − 0.684 | − 0.358 |
| p | 0.001** | 0.046* | 0.001** | 0.001** | 0.001** | 0.039* | |
| ACR (mg/g) | r | 0.796 | 0.498 | 0.915 | 0.769 | − 0.913 | − 0.468 |
| p | 0.001** | 0.006** | 0.001** | 0.001** | 0.001** | 0.01* | |
| Serum Na+ (mmol/l) | r | 0.931 | 0.470 | 0.786 | 0.479 | 0.875 | 0.459 |
| p | 0.001** | 0.009** | 0.001** | 0.008** | 0.001** | 0.01** | |
| Serum K+ (mmol/l) | r | − 0.986 | − 0.425 | − 0.343 | − 0.122 | − 0.951 | − 0.636 |
| p | 0.001** | 0.017* | 0.046* | 0.280 | 0.001** | 0.001** | |
Significance at p-value (< 0.05)
r Pearson’s correlation, ACR albumin to creatinine ratio, eGFR estimated glomerular filtration rate, BUN blood urea nitrogen
Urinary uromodulin
The results showed a significant increase across all diabetic groups with and without nephropathy compared to the healthy control group (p < 0.001), while there was a significant decrease in the macroalbuminuria group compared to normoalbuminuria and microalbuminuria (p < 0.001) (Table 1, Fig. 1a). Furthermore, upon normalization of urinary uromodulin by urinary creatinine (uUCR), a significant increase was observed in all diabetic groups, with and without nephropathy, as compared to the healthy control group (p < 0.001) while there was a significant decrease in the macroalbuminuria group compared to normoalbuminuria and microalbuminuria (p < 0.001) (Table 1, Fig. 1b).
Table 1.
Clinical and biochemical parameters of the studied groups
| Parameter | GR I Control n = 25 |
GR II Normoalbuminuria n = 25 |
GR III Microalbuminuria n = 25 |
GR IV Macroalbuminuria n = 25 |
p-value |
|---|---|---|---|---|---|
| Age | 50 ± 5.31 | 52.64 ± 6.25 | 52.76 ± 7.64 | 55.24 ± 6.25 | 0.051 |
| Sex (f/m %) | 15/10 (60/40) | 16/9 (64/36) | 14/11 (56/44) | 12/13 (48/52) | 0.699 |
| Diabetes duration (years) | – | 6.72 ± 1.54 | 8.76 ± 2b | 11.2 ± 2.61bc | < 0.001* |
| SBP (mmHg) | 120.7 ± 8 | 127.5 ± 11 | 134 ± 9ab | 138 ± 10.5abc | < 0.001* |
| DBP (mmHg) | 69.5 ± 4.9 | 72 ± 5.3 | 78.2 ± 7.2ab | 82.8 ± 7.9abc | < 0.001* |
| FBG (mg/dl) | 86.91 ± 6.98 | 207.56 ± 58.7a | 229.5 ± 66.7a | 233.4 ± 40.6a | < 0.001* |
| PBG (mg/dl) | 113.78 ± 12.37 | 301 ± 68.4a | 325 ± 63.8a | 334.32 ± 54.54a | < 0.002* |
| HbA1C (%) | 5.1 ± 0.2 | 8.7 ± 1.4a | 10.1 ± 1.2ab | 10.4 ± 1.09ab | < 0.001* |
| ACR (mg/g creatinine) | 4.7 ± 1.83 | 18.49 ± 4.9a | 115.33 ± 59.4ab | 717.3 ± 163.55abc | < 0.001* |
| Cystatin-C (mg/l) | 0.79 ± 0.1 | 0.86 ± 0.14 | 1.11 ± 0.26ab | 2.3 ± 0.61abc | < 0.001* |
|
eGFR (ml/min/1.73m2) |
88.03 ± 13.02 | 77.61 ± 14.8 | 68.6 ± 15a | 44.2 ± 15.8abc | < 0.001* |
| Creatinine (mg/dl) | 1.016 ± 0.13 | 1.09 ± 0.15 | 1.25 ± 0.21ab | 1.99 ± 0.65abc | < 0.001* |
| BUN (mg/dl) | 14 ± 2.6 | 17.19 ± 4.21a | 19.06 ± 5.66a | 38 ± 16abc | < 0.001* |
| Na+ (mmol/l) | 14 0.5 ± 2.5 | 142.46 ± 2a | 144.52 ± 3.1ab | 141.54 ± 4.77 | < 0.001* |
| K+ (mmol/l) | 4.18 ± 0.26 | 4.09 ± 0.29 | 4.36 ± 0.56 | 4.48 ± 0.88 | 0.068 |
| Cholesterol (mg/dl) | 183.26 ± 17.28 | 208.83 ± 32.95a | 221.4 ± 45.35a | 239.16 ± 64.81a | < 0.001* |
| Triglyceride (mg/dl) | 127.48 ± 20.15 | 160 ± 29.6a | 171.9 ± 42a | 182.72 ± 59.76a | < 0.001* |
| HDL-C (mg/dl) | 50.64 ± 6.55 | 45 ± 7.22a | 42 ± 5.7a | 37.2 ± 5.26abc | < 0.001* |
| LDL-C (mg/dl) | 107.12 ± 20.6 | 131.81 ± 42.46a | 145 ± 50.95a | 165.41 ± 76a | < 0.001* |
|
Urinary uromodulin (μg/ml) |
18.04 ± 2.72 | 25.24 ± 3.54a | 33.05 ± 7.98ab | 20.82 ± 2.55abc | < 0.001* |
| uUCR (mg/g creatinine) | 12.4 ± 5.5 | 26.3 ± 10.4a | 40.6 ± 25.7ab | 24.5 ± 17.6abc | < 0.001* |
| Exosomal UMOD gene | 0.51(0.21–0.9) | 2.87(2.51–3.7)a | 4.75(3.82–9.7)ab | 3.7(2.54–6.7)ac | < 0.001* |
Clinical parameters represented as mean ± S.D., exosomal UMOD gene represented as median (IQR), significance at p-value (< 0.05), ap < 0.05 vs. control group, bp < 0.05 vs. normoalbuminuria group (GR II), cp < 0.05 vs. microalbuminuria group (GR III)
SBP systolic blood pressure, DBP diastolic blood pressure, ACR albumin to creatinine ratio, eGFR estimated glomerular filtration rate, BUN blood urea nitrogen, HDL high-density lipoprotein, LDL low-density lipoprotein, uUCR urinary uromodulin to creatinine ratio
Fig. 1.

a Comparison of urinary uromodulin levels (μg/ml) between the studied groups; b Comparison of urinary uromodulin to creatinine ratio (uUCR) levels (mg/g creatinine) between the studied groups. Values are expressed as mean ± SD, with significance at p-value < 0.05; ap < 0.05 showed significance vs. the control group; bp < 0.05 showed significance vs. the normoalbuminuria group; cp < 0.05 showed significance vs. the microalbuminuria group
Identification of urinary exosomes
Morphology and size visualization are crucial for exosome characterization. SEM images revealed that the average vesicle diameter ranged from 72 to 119 nm (Fig. 2).
Fig. 2.
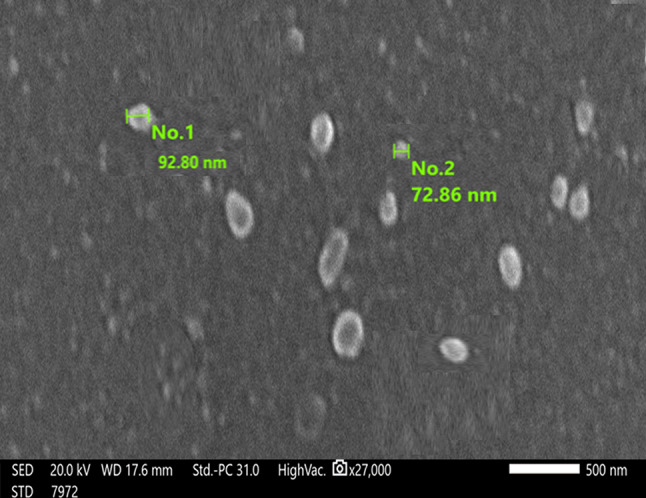
Scanning electron microscopy for exosomes isolated by PEG
The efficiency and specificity of amplified RNA were confirmed by RNA extraction from urinary exosomes through the melt curve and amplification plot. The RNA concentration was 21.5 μg/ml and the OD 260/280 was 1.9, as illustrated in Fig. 3a. qRT-PCR was performed for the urinary exosomal ACTB and UMOD genes. The melt curve and amplification plot (Fig. 3b, c) provided evidence supporting the suitability of exosomes for downstream analysis.
Fig. 3.

RNA extracted from urinary exosomes and qRT-PCR of urinary exosomal ACTB and UMOD genes a RNA concentration and OD 260/280. b Amplification plot of urinary exosomal ACTB and UMOD mRNA. c The melt curve showed a single-beak and rapid curve descent, which proved the specificity of amplified
Urinary exosomal UMOD mRNA
It showed a significant upregulation in gene expression in all diabetic groups compared to the control group (p < 0.001), whereas there was a significant decrease in the macroalbuminuria group compared to normoalbuminuria group (p < 0.001) (Table 1, Fig. 4).
Fig. 4.
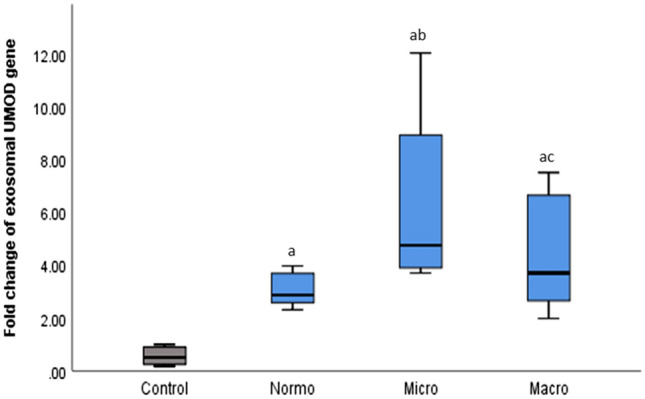
Fold change of exosomal UMOD gene expression in the studied groups. Values are expressed as median (IQR), with significance at p-value < 0.05; ap < 0.05 showed significance vs. the control group; bp < 0.05 showed significance vs. the normoalbuminuria group; cp < 0.05 showed significance vs. the microalbuminuria group
Correlation of urinary uromodulin with other biomarkers
This study revealed notable correlations of urinary uromodulin with various biomarkers. In the normoalbuminuria and microalbuminuria groups, urinary uromodulin showed a significant positive correlation with ACR, serum creatinine, BUN, cystatin-C, serum Na+, while exhibiting a significant negative correlation with e-GFR and serum K+. Whereas in the macroalbuminuria group, there was a significant negative correlation with ACR, serum creatinine, BUN, cystatin-C, serum K+, and a significant positive correlation with eGFR and serum Na+. The correlation coefficient (r) is illustrated in Table 2. Scatter plot figures are illustrated in suppl Figs. 1, 2.
Furthermore, upon adjusting urinary uromodulin levels by urinary creatinine, a substantial positive correlation was observed with ACR, cystatin-C, and serum Na+ levels. Simultaneously, a significant negative correlation was noted with eGFR in both the normoalbuminuria and microalbuminuria groups. While, within the macroalbuminuria group, a significant negative correlation was found with ACR, serum creatinine, cystatin-C, and serum K+ levels. Conversely, there was a significant positive correlation with eGFR and serum Na+ levels. However, in the normoalbuminuria group, no significant correlation was detected with serum creatinine or BUN. Similarly, in the microalbuminuria group, there was no significant correlation with serum K+ levels (Table 2).
Correlation of the urinary exosomal UMOD gene with urinary uromodulin and other biomarkers
In the normoalbuminuria and microalbuminuria groups, the exosomal UMOD mRNA showed a significant positive correlation with urinary uromodulin, ACR, serum creatinine, cystatin-C, serum Na+, and a significant negative correlation with eGFR and serum K+, while in the macroalbuminuria group, it showed a significant positive correlation with urinary uromodulin, eGFR, serum Na+, and a significant negative correlation with ACR, serum creatinine, BUN, cystatin-C, and serum K+ (Table 3). Scatter plot figures are illustrated in suppl Fig. 3.
Table 3.
Correlation of urinary exosomal UMOD gene with urinary uromodulin and other kidney function biomarkers
| GR II Normoalbuminuria n = 25 |
GR III Microalbuminuria n = 25 |
GR IV Macroalbuminuria n = 25 |
||
|---|---|---|---|---|
| uUromodulin (μg/ml) | r | 0.567 | 0.898 | 0.934 |
| p | 0.002** | 0.001** | 0.001** | |
| uUCR (mg/g creatinine) | r | 0.341 | 0.606 | 0.464 |
| p | 0.48* | 0.001** | 0.01** | |
| Serum Creatinine (mg/dl) | r | 0.733 | 0.467 | − 0.571 |
| p | 0.001** | 0.009** | 0.001** | |
| BUN (mg/dl) | r | 0.275 | 0.203 | − 0.577 |
| p | 0.092 | 0.156 | 0.001** | |
| eGFR (ml/min/1.73m2) | r | − 0.544 | − 0.676 | 0.400 |
| p | 0.002** | 0.001** | 0.024* | |
| Serum Cystatin-C (mg/l) | r | 0.690 | 0.714 | − 0.694 |
| p | 0.001** | 0.001** | 0.001** | |
| ACR (mg/g) | r | 0.682 | 0.806 | − 0.859 |
| p | 0.001** | 0.001** | 0.001** | |
| Serum Na+ (mmol/l) | r | 0.520 | 0.695 | 0.867 |
| p | 0.004** | 0.001** | 0.001** | |
| Serum K+ (mmol/l) | r | − 0.552 | − 0.101 | − 0.905 |
| p | 0.002** | 0.083 | 0.001** | |
Significance at p-value < 0.05
r Spearman’s correlation, uUCR urinary uromodulin to creatinine ratio, ACR albumin to creatinine ratio, eGFR estimated glomerular filtration rate, BUN blood urea nitrogen, uUromodulin urinary uromodulin.
Multivariant logistic regression
Multivariant logistic regression was performed to identify the independent predictor for DN. The model showed that there was an association between urinary uromodulin and DN, and uromodulin is an independent predictor of DN (β = 0.03, p = 0.01), as demonstrated in Table 4.
Table 4.
Multivariant logistic regression analysis of independent predictors of nephropathy among type 2 diabetic patients
| Parameters | β | Exp Β | 95% CI for Exp B | p-value | |
|---|---|---|---|---|---|
| Lower limit | Upper limit | ||||
| Urinary uromodulin (μg/ml) | 0.03 | 1.03 | 1.01 | 1.04 | 0.01* |
|
eGFR (ml/min/1.73m2) |
0.004 | 1 | 0.99 | 1.01 | 0.23 |
| Sex | − 0.1 | 0.11 | 0.72 | 1.11 | 0.33 |
| Age (years) | 0.006 | 1 | 0.98 | 1.02 | 0.43 |
| Diabetes duration (years) | 0.035 | 1.035 | 0.99 | 1.07 | 0.1 |
Significance at p-value < 0.05
β Logistic regression coefficient, Exp Β estimated odds ratio, CI confidence interval, eGFR estimated glomerular filtration rate
Receiver operating curve (ROC)
ROC was performed to analyze the ability of exosomal UMOD gene expression and urinary uromodulin to diagnose diabetic patients with and without nephropathy. For UMOD mRNA showed an area under the curve (AUC) of 0.95 (p < 0.001, 95% CI 0.98–1) (sensitivity 92%, specificity 84%), urinary uromodulin showed an AUC of 0.81 (p < 0.001, 95% CI 0.69–0.92) (sensitivity 80%, specificity 60%), while cystatin-C showed an AUC of 0.77 (sensitivity 76%, specificity 56%), and eGFR showed an AUC of 0.68 (sensitivity 72%, specificity 68%) (Fig. 5).
Fig. 5.
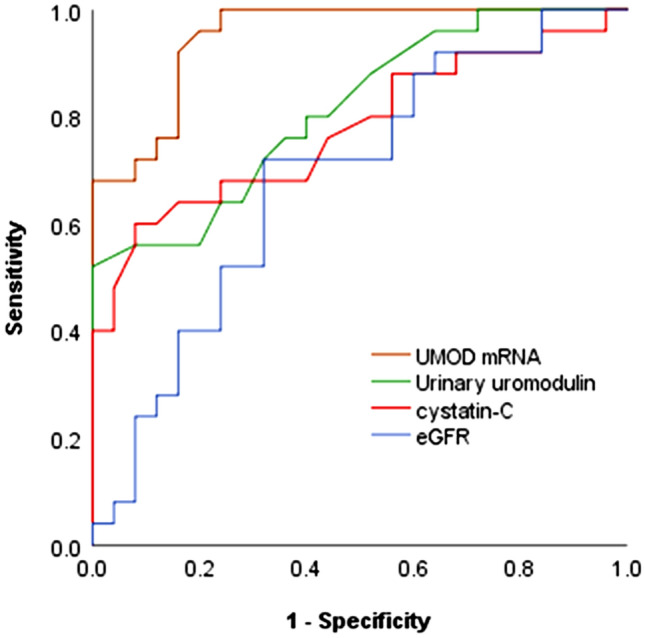
ROC curve analysis the diagnostic ability of different parameters to diagnose diabetic patients with and without nephropathy
Discussion
Diabetic nephropathy is the most serious microvascular complication, which causes glomerular and tubular damage that results in renal failure [24]. The precise pathological mechanisms triggering DN remain not fully identified. Hyperglycemia, a hallmark of diabetes, instigates the production of advanced glycation end products (AGEs), thereby stimulating an excessive release of profibrotic cytokines and augmenting reactive oxygen species (ROS) within the renal cells. Furthermore, elevated expression of chemoattractant and adhesion molecules initiates the recruitment of inflammatory cells to kidney tissues, promoting hyperfiltration, sclerosis, and increased inflammatory responses. [25]. Early detection of DN is pivotal in impeding the progression of kidney function decline towards ESRD. Therefore, the identification of novel noninvasive biomarkers for early detection of DN before advancement toward ESRD is crucial [1].
Uromodulin, a kidney-specific protein encoded by the UMOD gene, serves as a biomarker indicative of tubular function [5]. The UMOD mRNA extracted from urine exosomes, originating from kidney cells, represents a valuable diagnostic biomarker due to their enriched genetic material and protein content [26]. Urinary exosomes were isolated using a polymer precipitation technique (PEG). This cost-effective method produces a high yield of exosomes by reducing their solubility and enabling their precipitation through low-speed centrifugation without the need for specialized equipment [27].
The data of this study revealed a notable up-regulation in the expression of urinary exosomal UMOD gene in diabetic patients with normoalbuminuria and microalbuminuria when compared to the control group. This finding aligns with the studies by Yamamoto et al. and Micanovic et al., which documented that uromodulin expression increases at an early stage of diabetes [23, 28]. We hypothesized that the observed increase in UMOD gene expression among diabetic individuals could potentially be attributed to the inflammatory response associated with interstitial fibrosis—the primary pathophysiological mechanism in DN. The precise role of urinary uromodulin during the inflammatory response is not fully elucidated. Indeed, some studies support the notion that the increase in uromodulin is associated with its pro-inflammatory effect. Research conducted by Schmid et al. and Säemann et al. provides evidence of uromodulin's ability to activate innate immunity, including monocytes, neutrophils, and dendritic cells, and facilitate neutrophil trans-epithelial migration by binding TLR4 [8, 29]. Conversely, other studies propose an immunosuppressive and protective effect of uromodulin. This protective effect was explained by EL-Achkar et al., who demonstrated uromodulin's role in mitigating inflammation by inhibiting signaling in pro-inflammatory cells. During the recovery phase of acute kidney injury (AKI), UMOD gene expression is upregulated. This upregulation is associated with the regulation of macrophage inflammatory protein-2 (MIP-2), a potent neutrophil chemoattractant, thereby reducing neutrophil infiltration and mitigating the inflammatory response [30]. Furthermore, uromodulin’s protective effects encompass its ability to bind lymphokines like interleukin-1 (IL-1) and tumor necrosis factor-α (TNF-α). Additionally, uromodulin can bind to complement 1q, inhibiting the activation of the classical complement pathway [31, 32], and it is considered an antioxidant molecule as it shows a role in the regulation of renal oxidative stress by suppressing the activity of the transient receptor potential cation channel, subfamily M, member 2 (TRPM2) [33]. Moreover, the excreted urinary uromodulin acts as a decoy receptor for the free urinary cytokines, preventing cytokines from over-activating renal epithelial cells and urothelial cells [31].
In addition, the expression of uromodulin is highly dynamic and susceptible to change due to pathological conditions, as it is controlled by several transcriptional factors [34]. In this study, exosomal mRNA expression is positively associated with urinary uromodulin levels.
In the current study, a notable elevation in the mean urinary uromodulin level was evident across all diabetic groups in comparison to the control group. Conversely, within the diabetic spectrum, the macroalbuminuria group exhibited a decrease in uromodulin levels compared to both the microalbuminuria and normoalbuminuria groups. The higher production of uromodulin is reflected by higher levels in urine, and we assume that the increase in uromodulin excretion may be due to hyperfiltration associated with the early stage of diabetes This hyperfiltration is linked to tubular injury caused by hyperglycemia, resulting in extracellular matrix (ECM) accumulation and subsequent loss of basement membrane integrity, whereas the decreased level reflects the advanced disease stage and reduction of the renal cell mass. Consistent with our findings, Lou et al. reported elevated level of uromodulin with DKD [35]. Similarly, Köttgen et al. observed an upsurge in urinary uromodulin concentration preceding the onset of chronic kidney disease (CKD) [36]; and El-Achkar et al. illustrated that 24-h excretion of uromodulin increased in patients with early kidney disease without eGFR impairment, but the excretion decreased at an advanced stage when eGFR was significantly reduced [37]. On the contrary, some studies showed contradictory results, as Chakraborty et al. reported a decrease in uromodulin excretion with kidney damage [38]. However, these studies were all constrained by the absence of ROC curve analysis, presenting a deficiency in the data related to diagnostic accuracy.
The present study revealed a strong correlation of exosomal UMOD mRNA and urinary uromodulin with other kidney function biomarkers such as ACR, cystatin-C, and eGFR. These findings are aligned with the studies conducted by Lou et al. and Yamamoto et al. [23, 35]. Furthermore, our data showed high diagnostic potency for exosomal UMOD mRNA and urinary uromodulin, as estimated by the ROC curve, with high sensitivity and specificity. For exosomal UMOD mRNA, the AUC was 0.95 (sensitivity 92%, specificity 84%), and for urinary uromodulin, the AUC was 0.81 (sensitivity 80%, specificity 60%) compared to cystatin-C and eGFR, which showed lower AUC, sensitivity, and specificity.
Conclusion
The present study found an increased level of uromodulin excretion and increased expression of the urinary exosomal UMOD gene at an early stage of diabetes, even before the microalbuminuria stage, with high diagnostic performance and high sensitivity as shown by the ROC curve, so we hypothesized that patients with early kidney damage have an elevated level of urinary uromodulin and have a higher chance of developing CKD, so urinary uromodulin and the urinary exosomal UMOD gene may be used as early predictors of DN and monitor the progression of CKD.
Acknowledgements
Not applicable
Author contributions
SIB: performed the practical part, data analysis, and wrote the manuscript. TMM: supervision, guidance throughout the work, reviewing, and editing. SSB: supervision, reviewing, and editing. EMA: supervision, reviewing, and editing. All authors have read and approved the final manuscript.
Funding
This research did not receive any specific grant from any funding agencies.
Data availability
The datasets used during the current study are available from the corresponding author upon reasonable request.
Declarations
Conflict of interest
The authors declared that there is no conflict of interest.
Ethics approval and consent to participate
This study was approved by the Ethical Committee of Tanta University Hospital number (33229/07/19). Informed consent was obtained from each participant.
Consent for publication
Not applicable.
Footnotes
Publisher's Note
Springer Nature remains neutral with regard to jurisdictional claims in published maps and institutional affiliations.
References
- 1.Kim KS, Lee JS, Park JH, Lee EY, Moon JS, Lee SK, et al. Identification of novel biomarker for early detection of diabetic nephropathy. Biomedicines. 2021;9(5):457. 10.3390/biomedicines9050457 [DOI] [PMC free article] [PubMed] [Google Scholar]
- 2.Mizdrak M, Kumrić M, Kurir TT, Božić J. Emerging biomarkers for early detection of chronic kidney disease. J Pers Med. 2022;12(4):548. 10.3390/jpm12040548 [DOI] [PMC free article] [PubMed] [Google Scholar]
- 3.Oh SW, Kim S, Na KY, Chae DW, Kim S, Jin DC, et al. Clinical implications of pathologic diagnosis and classification for diabetic nephropathy. Diabetes Res Clin Pract. 2012;97(3):418–24. 10.1016/j.diabres.2012.03.016. 10.1016/j.diabres.2012.03.016 [DOI] [PubMed] [Google Scholar]
- 4.Tachibana S, Iyoda M, Suzuki T, Kanazawa N, Honda H. Serum uromodulin levels reflect severity of clinicopathological findings in early stage IgA nephropathy. Am J Nephrol. 2022;53(7):575–85. 10.1159/000525836. 10.1159/000525836 [DOI] [PubMed] [Google Scholar]
- 5.Devuyst O, Bochud M, Olinger E. UMOD and the architecture of kidney disease. Pflügers Arch Eur J Physiol. 2022;474(8):771–81. 10.1007/s00424-022-02733-4. 10.1007/s00424-022-02733-4 [DOI] [PMC free article] [PubMed] [Google Scholar]
- 6.Renigunta A, Renigunta V, Saritas T, Decher N, Mutig K, Waldegger S. Tamm-Horsfall glycoprotein interacts with renal outer medullary potassium channel ROMK2 and regulates its function. J Biol Chem. 2011;286(3):2224–35. 10.1074/jbc.M110.149880 [DOI] [PMC free article] [PubMed] [Google Scholar]
- 7.Wolf MT, Wu XR, Huang CL. Uromodulin upregulates TRPV5 by impairing caveolin-mediated endocytosis. Kidney Int. 2013;84(1):130–7. 10.1038/ki.2013.63 [DOI] [PMC free article] [PubMed] [Google Scholar]
- 8.Schmid M, Prajczer S, Gruber LN, Bertocchi C, Gandini R, Pfaller W, et al. Uromodulin facilitates neutrophil migration across renal epithelial monolayers. Cell Physiol Biochem. 2010;26(3):311–8. 10.1159/000320554 [DOI] [PubMed] [Google Scholar]
- 9.El-Achkar TM, McCracken R, Liu Y, Heitmeier MR, Bourgeois S, Ryerse J, et al. Tamm-Horsfall protein translocates to the basolateral domain of thick ascending limbs, interstitium, and circulation during recovery from acute kidney injury. Am J Physiol Renal Physiol. 2013;304(8):F1066–75. 10.1152/ajprenal.00543.2012. 10.1152/ajprenal.00543.2012 [DOI] [PMC free article] [PubMed] [Google Scholar]
- 10.Boder P, Mary S, Mark PB, Leiper J, Dominiczak AF, Padmanabhan S, et al. Mechanistic interactions of uromodulin with the thick ascending limb: perspectives in physiology and hypertension. J Hypertens. 2021;39(8):1490–504. 10.1097/HJH.0000000000002861. 10.1097/HJH.0000000000002861 [DOI] [PMC free article] [PubMed] [Google Scholar]
- 11.Latifkar A, Hur YH, Sanchez JC, Cerione RA, Antonyak MA. New insights into extracellular vesicle biogenesis and function. J Cell Sci. 2019;132(13):jcs222406. 10.1242/jcs.222406 [DOI] [PMC free article] [PubMed] [Google Scholar]
- 12.Van Niel G, d’Angelo G, Raposo G. Shedding light on the cell biology of extracellular vesicles. Nat Rev Mol Cell Biol. 2018;19(4):213–28. 10.1038/nrm.2017.125. 10.1038/nrm.2017.125 [DOI] [PubMed] [Google Scholar]
- 13.Akers JC, Gonda D, Kim R, Carter BS, Chen CC. Biogenesis of extracellular vesicles (EV): exosomes, microvesicles, retrovirus-like vesicles, and apoptotic bodies. J Neurooncol. 2013;113(1):1–11. 10.1007/s11060-013-1084-8. 10.1007/s11060-013-1084-8 [DOI] [PMC free article] [PubMed] [Google Scholar]
- 14.Petrovčíková E, Vičíková K, Leksa V. Extracellular vesicles – biogenesis, composition, function, uptake and therapeutic applications. Biologia. 2018;73(4):437–48. 10.2478/s11756-018-0047-0. 10.2478/s11756-018-0047-0 [DOI] [Google Scholar]
- 15.Sinha N, Kumar V, Puri V, Nada R, Rastogi A, Jha V, et al. Urinary exosomes: potential biomarkers for diabetic nephropathy. Nephrology (Carlton). 2020;25(12):881–7. 10.1111/nep.13720. 10.1111/nep.13720 [DOI] [PubMed] [Google Scholar]
- 16.Okamura A, Yoshioka Y, Saito Y, Ochiya T. Can extracellular vesicles as drug delivery systems be a game changer in cardiac disease? Pharm Res. 2022. 10.1007/s11095-022-03463-z. 10.1007/s11095-022-03463-z [DOI] [PMC free article] [PubMed] [Google Scholar]
- 17.Ortega-Sanchez FG, Teresa V, Widmann T, Regiart M, Jerez-Salcedo MT, Fernández-Baldo MA, et al. Microfluidic systems in extracellular vesicles single analysis. A systematic review. TrAC Trends Anal Chem. 2023;159:116920. 10.1016/j.trac.2023.116920 [DOI] [Google Scholar]
- 18.Meng Y, Asghari M, Aslan MK, Yilmaz A, Mateescu B, Stavrakis S, et al. Microfluidics for extracellular vesicle separation and mimetic synthesis: recent advances and future perspectives. Chem Eng J. 2020;404:126110. 10.1016/j.cej.2020.126110. 10.1016/j.cej.2020.126110 [DOI] [Google Scholar]
- 19.Mateescu B, Kowal EJ, van Balkom BW, Bartel S, Bhattacharyya SN, Buzás EI, et al. Obstacles and opportunities in the functional analysis of extracellular vesicle RNA–an ISEV position paper. J Extracell Vesicles. 2017;6(1):1286095. 10.1080/20013078.2017.1286095 [DOI] [PMC free article] [PubMed] [Google Scholar]
- 20.Draznin B, Aroda VR, Bakris G, Benson G, Brown FM, American Diabetes Association Professional Practice C, et al. 11. Chronic kidney disease and risk management: Standards of Medical Care in Diabetes-2022. Diabetes Care. 2022;45(Suppl 1):S175–84. [DOI] [PubMed] [Google Scholar]
- 21.Lv CY, Ding WJ, Wang YL, Zhao ZY, Li JH, Chen Y, et al. A PEG-based method for the isolation of urinary exosomes and its application in renal fibrosis diagnostics using cargo miR-29c and miR-21 analysis. Int Urol Nephrol. 2018;50(5):973–82. 10.1007/s11255-017-1779-4 [DOI] [PubMed] [Google Scholar]
- 22.Weng Y, Sui Z, Shan Y, Hu Y, Chen Y, Zhang L, et al. Effective isolation of exosomes with polyethylene glycol from cell culture supernatant for in-depth proteome profiling. Analyst. 2016;141(15):4640–6. 10.1039/c6an00892e. 10.1039/c6an00892e [DOI] [PubMed] [Google Scholar]
- 23.Yamamoto CM, Murakami T, Oakes ML, Mitsuhashi M, Kelly C, Henry RR, et al. Uromodulin mRNA from urinary extracellular vesicles correlate to kidney function decline in type 2 diabetes mellitus. Am J Nephrol. 2018;47(5):283–91. 10.1159/000489129. 10.1159/000489129 [DOI] [PubMed] [Google Scholar]
- 24.Wang H, Zhang R, Wu X, Chen Y, Ji W, Wang J, et al. The Wnt signaling pathway in diabetic nephropathy. Front Cell Dev Biol. 2021;9:701547. 10.3389/fcell.2021.701547. 10.3389/fcell.2021.701547 [DOI] [PMC free article] [PubMed] [Google Scholar]
- 25.Erekat NS. Programmed cell death in diabetic nephropathy: a review of apoptosis autophagy and necroptosis. Med Sci Monit Int Med J Exp Clin Res. 2022;28:e937766-e. [DOI] [PMC free article] [PubMed] [Google Scholar]
- 26.Xie S, Zhang Q, Jiang L. Current knowledge on exosome biogenesis, Cargo-sorting mechanism and therapeutic implications. Membranes. 2022;12(5):498. 10.3390/membranes12050498 [DOI] [PMC free article] [PubMed] [Google Scholar]
- 27.Zhang H, Zhang Q, Deng Y, Chen M, Yang C. Improving isolation of extracellular vesicles by utilizing nanomaterials. Membranes (Basel). 2021;12(1):55. 10.3390/membranes12010055 [DOI] [PMC free article] [PubMed] [Google Scholar]
- 28.Micanovic R, LaFavers K, Garimella PS, Wu X-R, El-Achkar TM. Uromodulin (Tamm–Horsfall protein): guardian of urinary and systemic homeostasis. Nephrol Dial Transplant. 2020;35(1):33–43. 10.1093/ndt/gfy394 [DOI] [PMC free article] [PubMed] [Google Scholar]
- 29.Säemann MD, Weichhart T, Zeyda M, Staffler G, Schunn M, Stuhlmeier KM, et al. Tamm-Horsfall glycoprotein links innate immune cell activation with adaptive immunity via a Toll-like receptor-4–dependent mechanism. J Clin Investig. 2005;115(2):468–75. 10.1172/JCI200522720 [DOI] [PMC free article] [PubMed] [Google Scholar]
- 30.El-Achkar TM, Dagher PC. Tubular cross talk in acute kidney injury: a story of sense and sensibility. Am J Physiol Renal Physiol. 2015;308(12):F1317–23. 10.1152/ajprenal.00030.2015 [DOI] [PMC free article] [PubMed] [Google Scholar]
- 31.Liu Y, El-Achkar TM, Wu X-R. Tamm-Horsfall protein regulates circulating and renal cytokines by affecting glomerular filtration rate and acting as a urinary cytokine trap. J Biol Chem. 2012;287(20):16365–78. 10.1074/jbc.M112.348243. 10.1074/jbc.M112.348243 [DOI] [PMC free article] [PubMed] [Google Scholar]
- 32.Rhodes DC. Importance of carbohydrate in the interaction of Tamm-Horsfall protein with complement 1q and inhibition of classical complement activation. Immunol Cell Biol. 2006;84(4):357–65. 10.1111/j.1440-1711.2006.01434.x. 10.1111/j.1440-1711.2006.01434.x [DOI] [PubMed] [Google Scholar]
- 33.LaFavers KA, Macedo E, Garimella PS, Lima C, Khan S, Myslinski J, et al. Circulating uromodulin inhibits systemic oxidative stress by inactivating the TRPM2 channel. Sci Transl Med. 2019;11(512):eaaw3639. 10.1126/scitranslmed.aaw3639 [DOI] [PMC free article] [PubMed] [Google Scholar]
- 34.Srivastava R, Micanovic R, El-Achkar TM, Janga SC. An intricate network of conserved DNA upstream motifs and associated transcription factors regulate the expression of uromodulin gene. J Urol. 2014;192(3):981–9. 10.1016/j.juro.2014.02.095. 10.1016/j.juro.2014.02.095 [DOI] [PubMed] [Google Scholar]
- 35.Lou NJ, Ni YH, Jia HY, Deng JT, Jiang L, Zheng FJ, et al. Urinary Microvesicle-bound uromodulin: a potential molecular biomarker in diabetic kidney disease. J Diabetes Res. 2017. 10.1155/2017/3918681. 10.1155/2017/3918681 [DOI] [PMC free article] [PubMed] [Google Scholar]
- 36.Köttgen A, Hwang SJ, Larson MG, Van Eyk JE, Fu Q, Benjamin EJ, et al. Uromodulin levels associate with a common UMOD variant and risk for incident CKD. J Am Soc Nephrol. 2010;21(2):337–44. 10.1681/asn.2009070725. 10.1681/asn.2009070725 [DOI] [PMC free article] [PubMed] [Google Scholar]
- 37.El-Achkar TM, Wu XR. Uromodulin in kidney injury: an instigator, bystander, or protector? Am J Kidney Dis. 2012;59(3):452–61. 10.1053/j.ajkd.2011.10.054. 10.1053/j.ajkd.2011.10.054 [DOI] [PMC free article] [PubMed] [Google Scholar]
- 38.Chakraborty J, Below AA, Solaiman D. Tamm-Horsfall protein in patients with kidney damage and diabetes. Urol Res. 2004;32(2):79–83. 10.1007/s00240-003-0374-6. 10.1007/s00240-003-0374-6 [DOI] [PubMed] [Google Scholar]
Associated Data
This section collects any data citations, data availability statements, or supplementary materials included in this article.
Data Availability Statement
The datasets used during the current study are available from the corresponding author upon reasonable request.