Abstract
Recognizing an individual’s preference state for potential romantic partners based on electroencephalogram (EEG) signals holds significant practical value in enhancing matchmaking success rates and preventing romance fraud. Despite some progress has been made in this field, challenges such as high-dimensional feature space and channel redundancy limited the technology’s practical application. The aim of this study is to explore the most discriminative EEG features and channels, in order to enhance the recognition performance of the system, while maximizing the portable and practical value of EEG-based systems for recognizing romantic attraction. To achieve this goal, we first conducted an interesting simulated dating experiment to collect the necessary data. Next, EEG features were extracted from various dimensions, including band power and asymmetry index features. Then, we introduced a novel method for EEG feature and channel selection that combines the sequential forward selection (SFS) algorithm with the frequency-based feature subset integration (FFSI) algorithm. Finally, we used the random forest classifier (RFC) to determine a person's preference state for potential romantic partners. Experimental results indicate that the optimal feature subset, selected using the SFS-FFSI method, attained an average classification accuracy of 88.42%. Notably, these features were predominantly sourced from asymmetry index features of electrodes situated in the frontal, parietal, and occipital lobes.
Keywords: Cognitive neuroscience, Machine learning, Interpersonal attraction, Romantic attraction, Mate preference, Feature selection
Subject terms: Computational neuroscience, Human behaviour
Introduction
Romantic attraction refers to a series of positive responses individuals have towards potential ideal partners, including heightened attention, feelings of excitement, intrusive thinking, and a desire for emotional union1–3. Encountering potential romantic partners who are mutually attracted to each other is usually the first step in developing romantic relationships, but it is not easy to find someone in real life who is both strongly attracted to you and also finds you very appealing, as the natural incidence of mutual attraction is quite low4. Nevertheless, challenges and opportunities coexist, and the difficulty of this task brings huge business opportunities for matchmaking agencies. In the market, matchmaking institutions strive to provide users with “customized” matchmaking services.
The emergence of matchmaking platforms can indeed help people find potential romantic partners who are mutually attracted to each other to some extent. However, current matchmaking services also face challenges such as low success rates in pairing and frequent cases of fraud. The reasons behind these issues are multifaceted, and a significant factor among them is that current matchmaking platforms primarily rely on behavioral data to determine whether users of the opposite sex are mutually attractive. While behavioral data can provide valuable information in assessing whether opposite-sex users are attracted to each other, the reliability and validity of such data is difficult to guarantee. Consequently, current matchmaking platforms are unable to effectively address challenges such as the frequent occurrence of romance fraud and low success rates in pairing.
Compared with behavioral data, neurophysiological signals possess the advantage of being less susceptible to subjective consciousness, making them a more suitable choice for assessing whether users of the opposite sex are attracted to each other5,6. Among various categories of neurophysiological signals, EEG signals has attracted extensive attention from researchers due to its high temporal resolution, low cost, portable, and wearable advantages5. Recent studies have found that the preferences of marriageable individuals towards potential romantic partners is associated with a decrease in the power of alpha and beta frequency bands7, as well as an increase in the amplitude of LPP and P3008. Furthermore, these effects primarily occur in the frontoparietal and the lateral occipital complex area7. Based on these findings, Yuan et al. extracted relevant features from EEG signals and conducted research on romantic interest recognition using a random forest classifier, with an average classification accuracy of 85.2%9.
Currently, most romantic interest recognition studies collect EEG signals from multiple scalp channels and extract features from various dimensions. Multi-dimensional feature extraction combined with the use of a large number of channels inevitably leads to the curse of dimensionality. The noise and redundant information contained in high-dimensional feature space will inevitably reduce the performance of the EEG based mate preference recognition system10,11. In addition, the use of a large number of channels will reduces the portable of the system, which affects the application range of the EEG-based mate preference recognition system12. Under the constraint of recognition accuracy, the contradiction between the performance and portable of the system can be balanced to a certain extent through the selection of features10,12.
The SFS algorithm is one of the most commonly used feature selection methods in machine learning. Its working principle involves considering all features not yet included in the feature set and calculating the impact of each feature on model performance after it is added. The feature that maximizes the improvement in model performance is then selected and added to the current feature set, continuing until a specified stopping criterion is met. During the process of multiple rounds of feature selection, variability is often observed in both the features included in the optimal subset and the number of features within this subset. This inconsistency means that some features may frequently appear in optimal feature subsets, while other features may only be selected occasionally. Those features that are frequently selected are considered to be rich in information, and playing a crucial role in classification and recognition tasks11,13. Building upon this idea, the paper combines the SFS algorithm with the FFSI algorithm, proposing a novel feature and channel selection approach, namely SFS-FFSI.
This study investigates how to find out the most discriminative features and scalp sites for EEG-based mate preference recognition. Since EEG-based preference recognition is an emerging field, to date, there is no widely used EEG data set for preference recognition research14,15. Therefore, we firstly designed a simulated mate selection experiment paradigm, drawing inspiration from online dating platforms like tinder (https://tinder.com/), to elicit romantic attraction and gather the necessary data. Briefly speaking, participants were asked to imagine using the platform to choose their preferred partners. Their EEG signals were recorded in real-time as they viewed and rated the photographs of each potential partner according to their preferences. Second, several commonly used EEG features were extracted based on the wavelet transform, including the frequency band energy and asymmetry index14–18. Subsequently, the proposed feature selection algorithm was employed to choose the optimal features and channels. Finally, a random forest classifier (RFC), which has demonstrated excellent performance in EEG-based preference recognition tasks, was utilized to discern individuals' mating preference states for potential romantic partners.
The remainder of this paper is organized as follows: section "Materials and methods" describes the experimental materials and methods used; section "The proposed SFS-FFSI algorithm" explains the proposed feature selection algorithm; section "Results and discussion" presents the experimental results and provides a brief discussion; and section "Conclusion" summarizes the study.
Materials and methods
In real-life scenarios, the likelihood of encountering individuals to whom we feel heart race is notably low, averaging a mere few percentage points4. Consequently, to effectively elicit initial romantic attraction and accumulate sufficient data for model training, it became imperative to find strategies that can augment the frequency of romantic attraction induction. Research has demonstrated a significant positive correlation between an individual’s level of physical attractiveness and his or her popularity among the opposite sex1,8,19,20. Therefore, the overall induction rate of romantic attraction could be enhanced by augmenting the proportion of stimuli characterized by high physical attractiveness7,8. To achieve this objective, we first assessed the attractiveness level of each stimulus in the auxiliary experiment. Subsequently, in the main experiment, the mean induction rate of romantic attraction was elevated by increasing the proportion of stimulus materials with high physical attractiveness. The Ethical Review Committee of Southwest University provided approval for both the auxiliary and main experiments. Informed consent was secured from all participants, encompassing their participation in the study and the potential publication of identifying information/images in online open-access publications. Furthermore, all methods were carried out in accordance with the declaration of Helsinki.
Auxiliary experiment
Participants
Sixty student volunteers participated in the auxiliary experiment (30 females and 30 males; age: 21.4 ± 2.6 years). All participants reported normal or corrected-to-normal visual acuity and had no history of psychiatric or neurological disorders, as confirmed by a screening interview.
Experimental procedure
To increase the proportion of stimuli with high physical attractiveness and thereby enhance the average arousal rate of romantic attraction, it is essential that we first ascertain the average level of physical attractiveness for each stimulus. To this end, we first downloaded thousands of high-definition portrait photographs from photography forums such as Hummingbird (https://www.fengniao.com/), where the color of the clothing did not need to be consistent. We then standardized these photos by cropping them to a resolution of 839*1080 pixels, retaining only the portion above the chest. Next, 1600 photos with comparable background complexity and expressions were selected from the standardized collection, with 800 male and 800 female portraits respectively. Subsequently, a 9-point scale (i.e., "How physically attractive is this person?") was used to assess the physical attractiveness level of each stimulus, where 0 corresponds to "not at all " and 9 corresponds to "extremely". It is worth noting that both male and female subjects only evaluate the physical attractiveness level of the opposite sex. Finally, we calculated the average attractiveness score for each stimulus and categorized them into three classes: high (mean = 6.9, standard deviation [SD] = 0.33), medium (mean = 5.2, SD = 0.25), and low attractiveness (mean = 3.9, SD = 0.31).
Main experiment
Participants
Fifty student volunteers participated in the main experiment (all single; 25 females and 25 males; age: 21.2 ± 2.4 years). All participants reported normal or corrected-to-normal visual acuity and had no history of psychiatric or neurological disorders, as confirmed by a screening interview.
Experimental procedure
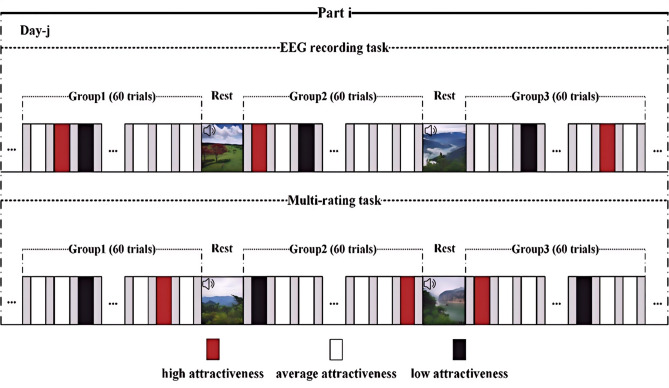
After considering the induction efficiency of romantic attraction and participant workload, we adjusted the proportion of stimuli with high, medium, and low attractiveness levels from roughly following a Gaussian distribution to 0.25:0.6:0.15. Then, a pilot experiment was conducted to determine the total number of stimuli that would be viewed by the participants, which was established at 360 photographs of the opposite sex7,8. Additionally, to further reduce the impact of aesthetic fatigue on the experiment, we divided the experiment into two sessions (each session contained 180 stimuli) and stipulated that the interval between completing the two sessions of the experiment should be at least 1 day (Fig. 1). Each session was further divided into 3 runs (each run contained 60 stimuli), with a 5–6-min break between each run. During the rest period, the participants viewed serene landscapes while listening to soothing music. It is worth noting that the whole experiment was conducted in a dark and quiet environment to focus the participants.
Figure 1.
Experimental protocol.
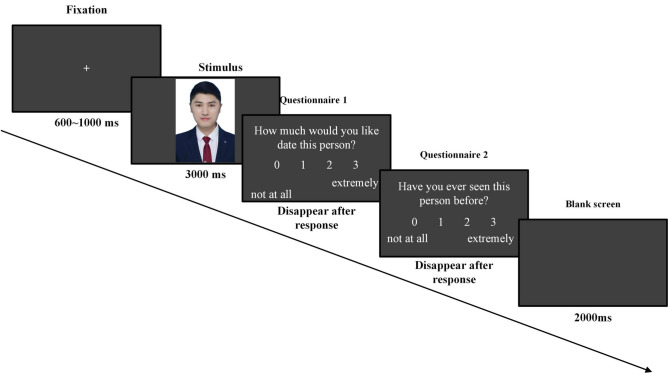
The trial structure is shown in Fig. 2. It begins with a fixation point lasting 1000 ms, followed by a stimulation period of 3000 ms. Subsequently, participants were asked to evaluate their romantic interest in each potential partner. To gauge their level of preference, participants were asked to respond to the query "How much would you like to date this person?" using a scale that ranges from 0 (indicating no interest) to 4 (indicating extreme interest). The rationale for employing this question to measure romantic attraction is grounded in the understanding that the desire for emotional union with a potential romantic partner is one of the main character of romantic interest arousal1,3. Therefore, when an individual exhibits behaviors, such as expressing a wish to date a particular potential romantic partner again within the context of dating, it can be interpreted as an indication of romantic interest7,9,21,22. Finally, an empty screen lasting 2000 ms appeared.
Figure 2.
Trial structure.
Data acquisition and processing
A 128-channel Biosemi ActiveTwo system was used to collect EEG signals. The signals were filtered online with a 0.1–100-Hz band-pass filter and sampled at 512 Hz. After data acquisition, a series of preprocessing of the EEG data was also required, including channel location, filtering (0.1–50 Hz), elimination of artifacts (i.e., bad data and bad channels), re-referencing (average reference), interpolation of bad channel, and independent component analysis. Independent component analysis was used to correct for Electrocardiograph (ECG) artifacts and ophthalmic artifacts. Then, according to the time point of stimulus presentation, the preprocessed EEG signals were split into segments, ranging from 1000 ms before the stimulus presentation of to 2000 ms after the stimulus onset.
Based on the rating score of “How much would you like to date this person?” These EEG segments were divided into the romantic attraction engendered dataset and romantic attraction un-engendered dataset1,7,8,23. Specifically, EEG epochs with a rating score of 2 or 3 were assigned to the romantic attraction engendered dataset (with sample labels set as "1"), and segments with a rating score of 0 were assigned to the romantic attraction un-engendered dataset (with sample labels set as "0")7,8,24,25. Furthermore, to minimize ambiguity, epochs with a rating score of 1 were excluded. After the above process, the number of acceptable data segments in romantic attraction engendered dataset is 1439, while the number of acceptable data segments in romantic attraction un-engendered dataset is 15,298. It can be seen that there is a serious mismatch in the number of samples in the two data sets. In order to balance the number of samples in the two datasets, we adopted a down-sampling strategy, that is, 13,859 samples were randomly deleted from the romantic attraction un-engendered dataset to match the number of samples under the romantic attraction engendered dataset9.
Feature extraction
To recognize the discrete preferences of the users, we used the wavelet transform (WT) with a sliding time-window approach for time–frequency (TF) feature extraction based on TF analysis7. Specifically, the time–frequency representation was obtained through a five-cycle complex Morlet WT. The sliding windows were advanced in 12-ms and 1-Hz increments to estimate the changes in power over time and frequency in the five FBs: delta (1–4 Hz), theta (4–8 Hz), alpha (8–13 Hz), beta (13–30 Hz), and gamma (30–49 Hz). The TF features of the EEG activities were calculated according to event-related oscillations7,26–28. In this study, two types of TF features were extracted: the frequency band power (FBP) and asymmetry indexes (i.e., the difference in spectral power between the left and right hemispheres).
Ethical approval
The studies involving human participants were reviewed and approved by The Ethical Review Committee of Southwest University.
The proposed SFS-FFSI algorithm
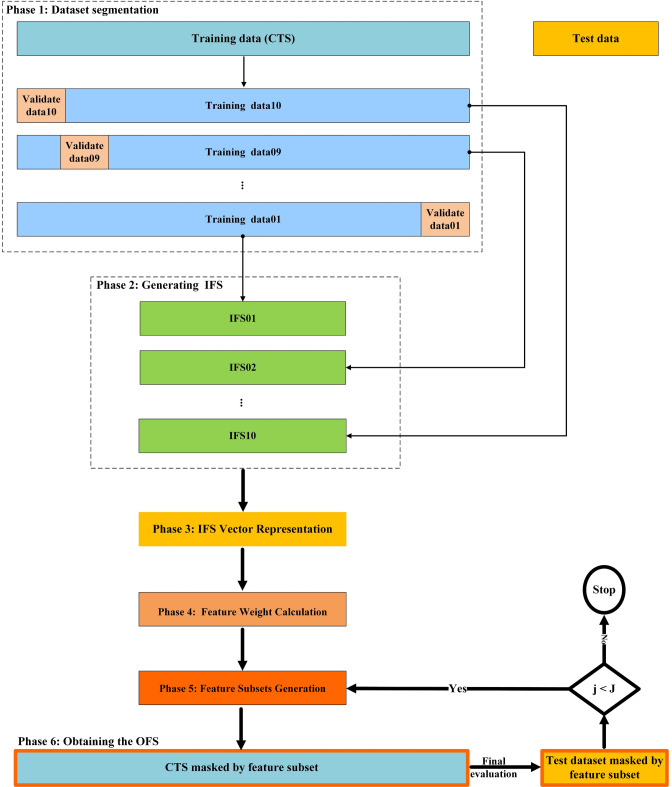
In this study, 915 (640 FBPs and 275 ASs) features were extracted from the EEG signals with 128 electrodes, which undoubtedly constitutes a high-dimensional feature space containing a large amount of redundant information. To reduce the dimension of the feature space and produce an optimal subset of available features, we propose an SFS-FFSI algorithm. In the SFS-FFSI method, five phases were used to filter the OFS from the original feature space (Fig. 3).
Figure 3.
Framework for obtaining the OFS in the proposed feature selection method.
Phase 1: dataset segmentation
Initially, the data from all subjects were divided into five parts, each containing sample data from 10 participants, with four parts serving as the training set and the remaining part as the test set. To distinguish it from the training set mentioned later, we called the training set complete training set (CTS). Second, the CTS was further divided into 10 parts, among which 9 parts were used as a training set and 1 part was used as a validation set. Each part was used iteratively as a validation part, where the rest of the CTS was used for training, so there were ten segmentation schemes.
Phase 2: generating intermediate feature subsets.
In this study, SFS algorithm was employed to generate intermediate feature subset (IFS). The procedure involved initializing an empty feature subset, subsequently evaluating the impact of each unselected feature on model performance individually. Based on these evaluations, the algorithm selected the feature that most significantly enhanced model performance, added it to the current feature subset, and retrained the model to reassess its performance. This iterative process continued until a predefined stopping condition was satisfied—in this case, reaching 30 features. During the iterations, all generated feature subsets were evaluated for classification performance, and the subset achieving the highest score was chosen as the IFS.
Phase 3: IFS vector representation
In this study, the presence of features, which is the most common method, was utilized for intermediate feature subset vectorization13. First, each IFS was vectorized into a binary intermediate feature vector (IFV) of length N, where N represents the total number of features (i.e., 915). Specifically, If the ith feature (i ∈ [1, N]) is included in the IFS, then the value of the corresponding ith feature in the IFV is set to 1; otherwise, it is 0.
For example, if IFS1, IFS2, IFS3 are as follows:
The corresponding IFV1, IFV2 and IFV3 are respectively vectorized as:
Second, a binary matrix known as the intermediate feature matrix (IFM) was constructed from the IFVs, with each row of the IFM corresponding to an IFV.
| 1 |
where M represents the number of IFV, and N represents the total number of features.
Phase 4: feature weight calculation
The objective of this phase is to determine the weight of each feature based on IFM, where features with higher weights are considered more advantageous for classification tasks11,13. The weight of the ith feature is calculated as follows:
| 2 |
where represents the weight of the ith feature. Then, we obtain a frequency-based feature weight vector (FWV) that stores the weight of each feature:
| 3 |
Phase 5: generating and evaluating feature subsets.
First, the FWV obtained in the previous phase is sorted in descending order to obtain the sorted feature weight vectors (S-FWV):
| 4 |
Second, a series of new feature subsets (NFS) were generated by selecting features with weights greater than 0 from the S-FWV according to the following formula:
| 5 |
where xi is a feature with a weight greater than 0, and I is the total number of features with a weight greater than 0. In the above formula, x1 has the highest rank (or weight), and x2 has the second highest rank among the feature vectors.
Phase 6: obtaining the OFS
The classifier was trained on the CTS, and the classification accuracy was calculated based on the test set to obtain the OFS.
Results and discussion
Performance evaluation metrics
Feature selection is an important step in machine learning and data mining. Its goal is to select the most impactful features from the original feature set for model performance. Through feature selection, we can reduce the dimensionality of the dataset, diminish the risk of overfitting, enhance the model's generalization capability, and also decrease computational complexity, thereby improving the performance of learning algorithms. We typically utilize various evaluation metrics to assess the performance of learning algorithms. These metrics encompass accuracy, precision, and recall, with accuracy being one of the most intuitive and frequently employed indicators. The classification accuracy refers to the proportion of samples that the model predicts correctly out of the total number of samples. Its calculation formula is shown below:
where TP is the number of actual positive samples that were predicted to be positive, FN is the number of actual positive samples that were predicted to be negative, TN is the number of actual negative samples that were predicted to be negative, and FP is the number of actual negative samples that were predicted to be positive29.
Compared to accuracy, precision and recall offer more detailed performance evaluations, especially showing greater advantages in scenarios with imbalanced datasets and unequal error costs. Therefore, in this study, we calculated precision and recall in addition to accuracy. The calculation formulas are as follows:
RFC is a commonly used classification algorithm, and it needs to adjust fewer parameters, making it less easy to overfit and more suitable for generalization to invisible data29. Furthermore, numerous studies have demonstrated that RFC performs well in EEG-based preference classification tasks14,15,29,30. Therefore, in the present study, performance evaluation metrics were calculated based on the RFC11. To obtain reliable results, the train-test process was repeated 30 times, and the average performance in the test set was computed.
Results and discussion
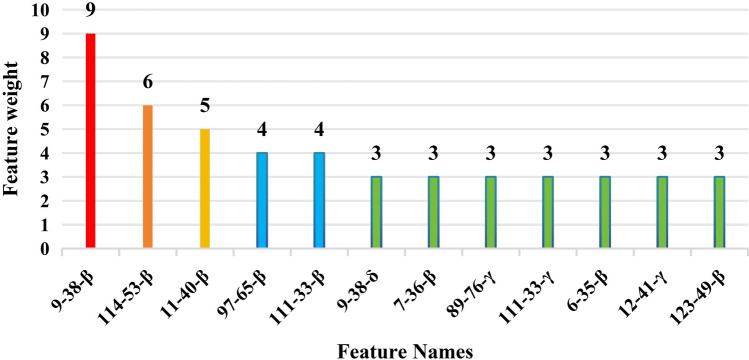
The primary objective of this study was to utilize the proposed feature selection algorithm to identify the most discriminative EEG features and channels for mate preference recognition based on EEG. The experimental results demonstrated that by employing the OFS (composed of 12 features, as shown in Fig. 4) to train the RFC, the average accuracy reached an optimal level of 88.42% (with a standard deviation of 0.0076). To better evaluate the performance of feature selection method proposed in this study, we discuss it from the following three aspects:
Figure 4.
weight map of the OFS.
Which features or channels are the most effective in mate preference recognition based on EEG?
Figure 4 displays the optimal feature subset and its weight map. The horizontal axis of Fig. 4 corresponds to the names of the features, which consist of two parts: the last part is composed of lowercase Greek letters, representing the frequency band to which the feature belongs; the remaining part corresponds to the electrode or electrode pair to which the feature belongs. The vertical axis of Fig. 4 represents the weight of the features, which is the frequency at which a particular feature appears in the ten feature vectors.
From Fig. 4, it can be observed that the optimal feature subset encompasses a total of 12 features. Among these 12 features, the one with the highest weight is the beta-band feature related to the electrode pair A09-B06, which has a feature weight of 9. This suggests that for nearly 90% of participants, this feature likely has discriminative power. Furthermore, of these 12 features, eight are attributed to the beta band, three to the gamma band, and one to the delta band. The latest research indicates that all of these characters are closely related to emotion recognition7,31–33. These consistent findings suggest that the aforementioned 12 features are likely the most effective EEG characters for recognizing romantic attraction based on EEG, relative to other characters.
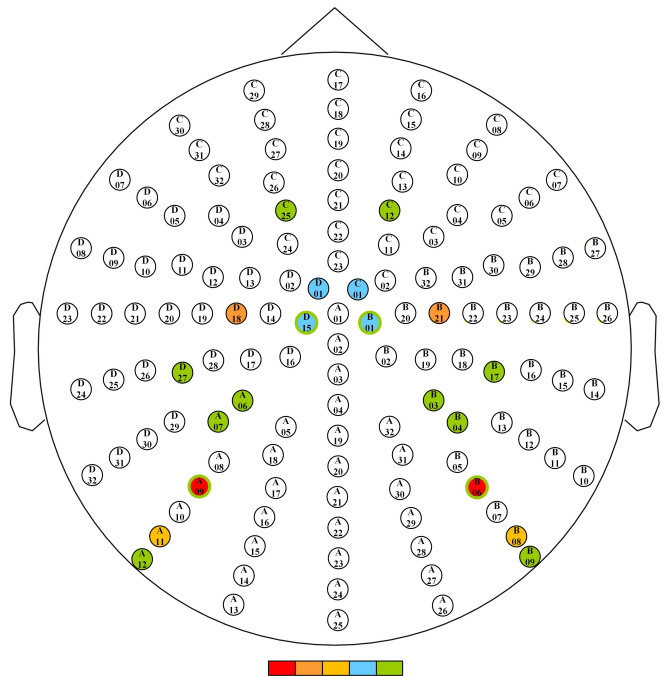
Figure 5 displays the spatial distribution pattern of the aforementioned 12 most effective features. Each circle in Fig. 5 represents an electrode, with each color signifying a feature linked to that particular electrode or electrode pair. It is noteworthy that if a circle is marked with two colors, one for the interior and another for the edge, this indicates that multiple features are derived from the respective electrode or electrode pair.
Figure 5.
OFS and its spatial distribution position.
From Fig. 5, it is evident that the 12 most discriminative features originate from 10 electrode pairs, namely A09-B06, D18-B21, A11-B08, D01-C01, D15-B01, A07-B04, C25-C12, A06-B03, A12-B09, and D27-B17. These electrodes are primarily distributed over the frontal, parietal, and occipital lobes, which are regions closely associated with emotional processing7,9,11,22,34. These converging evidences suggest that the 10 pairs of electrodes mentioned above are likely the most effective electrodes in EEG based romantic attraction recognition compared to other electrodes.
-
(2)
To what extent can the proposed method reduce the dimensions of the feature space? Or how much to reduce the number of channels used?
Through computational analysis, it becomes evident that the SFS-FFSI algorithm, as proposed in this study, efficiently reduced the necessary number of features from an initial 915 dimensions down to a mere 12 dimensions. This signifies an approximate reduction of 98.69% in the employed feature count. Concurrently, there is an observable improvement in the average classification accuracy, which advances from 85.06 to 88.42%. Such outcomes suggest that the feature selection methodology introduced in this chapter can further augment classification accuracy while concurrently diminishing the dimensionality of the feature space.
Furthermore, after the completion of feature selection, the number of required electrodes was concurrently reduced to 20, marking a substantial decrease of 84.35%. This significant reduction in the needed channels greatly simplifies the experimental preparation process and noticeably shortens the preparation duration, thereby substantially enhancing the portable and practicality of the EEG-based romantic attraction recognition system.
-
(3)
Can the proposed feature selection method outperform the SFS feature selection method in the classification of mate preferences based on EEG?
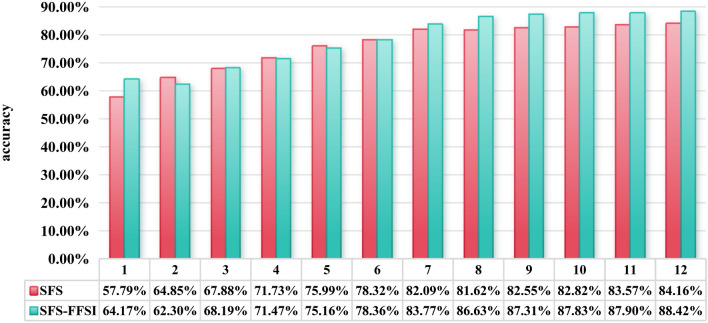
To answer this question, we compared the SFS-FFSI algorithm proposed in this paper with the basic SFS algorithm. The results are shown in Fig. 6. As can be seen from Fig. 6, when the feature selection threshold was set to 12, the average classification accuracy of RFC based on the optimal feature subset (i.e., the intermediate feature subset in the present study) selected by the SFS algorithm was 84.16%, while the average classification accuracy of RFC based on the feature subset selected by the SFS-FFSI algorithm was 84.42%. Furthermore, the results of the two-sample T-test further indicate that, in terms of classification accuracy, the feature selection algorithm proposed in this study is significantly (P < 0.05) superior to the basic SFS algorithm.
Figure 6.
Classification accuracy of mate preference based on different feature selection methods.
To employ feature selection using the SFS-FFSI method, the initial step involves acquiring an IFSs based on the SFS algorithm. This was achieved by generating the OFSs through the SFS feature selection algorithm under various data partitioning schemes. Subsequently, these intermediate feature subsets were vectorized based on the feature existence principle, resulting in the derivation of IFVs and IFM. Thereafter, the weight of each feature was computed using Formula 4, and a confusion matrix was constructed to calculate various performance metrics. Finally, an RFC was trained on each new feature subset, and a confusion matrix was constructed to calculate performance metrics.
According to the data presented in Fig. 6, we can observe that the SFS-FFSI algorithm, which is an enhanced version based on the SFS algorithm, generally outperforms the original SFS algorithm under the condition of the same number of features. This finding further confirms that the feature selection algorithm proposed in this paper can effectively reduce the random errors introduced by SFS algorithms during the feature selection process, thereby making the results of feature selection smoother and more optimized.
Conclusion
The core objective of this study is to identify the most discriminative EEG features and channels for mate preference recognition task based on EEG. To achieve this goal, we combined SFS and FFSI to propose a new frequency-based feature selection algorithm, SFS-FFSI, used for feature and channel selection tasks. The experimental results demonstrate that the asymmetry index features of beta, gamma and theta bands are more discriminative than other features, which mainly come from EEG channels located over the frontal lobe, parietal lobe and the upper part of occipital lobe. Furthermore, the experimental results demonstrate that the SFS-FFSI algorithm generally surpasses the original SFS algorithm in performance when an equivalent number of features is employed. This finding further indicates that by recording and integrating the optimal results (i.e., the IFS) from multiple sequential forward feature selections, the SFS-FFSI algorithm can significantly enhance the stability and consistency of wrapper-type feature selection algorithms, which is particularly important in cross-topic classification tasks.
Acknowledgements
The authors thank all the participants and researchers involved in the experiment.
Author contributions
G.Y. and S.F. conceived the study. G.Y. designed and programmed the tasks. G.Y. contributed to data collection. Sai Fu, Tao Wang and Wei Ju analyzed the behavioral data. G.Y. analyzed the composite behavioral data and EEG data. Guangjie Yuan, Tao Wang and Sai Fu interpreted the results. G.Y. wrote the article. G.Y., T.W. and S.F. provided revisions to the article. All authors approved the final manuscript.
Funding
The authors thank all the participants and researchers involved in the experiment. This work was supported in part by the National Natural Science Foundation of China (No. 32300944 and No. 61872301).
Data availability
The data and code that support the findings of this study are available from the corresponding author upon reasonable request.
Competing interests
The authors declare no competing interests.
Footnotes
Publisher's note
Springer Nature remains neutral with regard to jurisdictional claims in published maps and institutional affiliations.
Contributor Information
Guangjie Yuan, Email: gjyuan@qfnu.edu.cn.
Sai Fu, Email: saifu1992@163.com.
References
- 1.Mindy, L., McEntee, M. P., & Vowles, K. E. in Encyclopedia of Personality and Individual Differences Ch. Chapter 717–722, 1–6 (2018).
- 2.Fisher, H. E., Aron, A., Mashek, D., Li, H. & Brown, L. L. Defining the brain systems of lust, romantic attraction, and attachment. Arch. Sexual Behav.31, 413–419 (2002). 10.1023/A:1019888024255 [DOI] [PubMed] [Google Scholar]
- 3.Fisher, H. E. Lust, attraction, and attachment in mammalian reproduction. Human Nat10.1007/s12110-998-1010-5 (1998). 10.1007/s12110-998-1010-5 [DOI] [PubMed] [Google Scholar]
- 4.Zsok, F., Haucke, M., De Wit, C. Y. & Barelds, D. P. H. What kind of love is love at first sight?. Empir. Investig. Personal Relationsh.24, 869–885. 10.1111/pere.12218 (2017). 10.1111/pere.12218 [DOI] [Google Scholar]
- 5.Alarcao, S. M. & Fonseca, M. J. Emotions recognition using EEG signals: a survey. IEEE Trans. Affect. Comput.10, 374–393 (2017). 10.1109/TAFFC.2017.2714671 [DOI] [Google Scholar]
- 6.Lin, Y. P. et al. EEG-based emotion recognition in music listening. IEEE Trans. Biomed. Eng.57, 1798–1806. 10.1109/tbme.2010.2048568 (2010). 10.1109/tbme.2010.2048568 [DOI] [PubMed] [Google Scholar]
- 7.Yuan, G. J. & Liu, G. Y. Mate preference and brain oscillations: Initial romantic attraction is associated with decreases in alpha- and lower beta-band power. Hum. Brain Mapp.43, 721–732. 10.1002/hbm.25681 (2022). 10.1002/hbm.25681 [DOI] [PMC free article] [PubMed] [Google Scholar]
- 8.Yuan, G. J., Liu, G. Y. & Wei, D. T. Roles of P300 and late positive potential in initial romantic attraction. Front. Neurosci.15, 13. 10.3389/fnins.2021.718847 (2021). 10.3389/fnins.2021.718847 [DOI] [PMC free article] [PubMed] [Google Scholar]
- 9.Yuan, G. J., He, W. G. & Liu, G. Y. Is mate preference recognizable based on electroencephalogram signals? Machine learning applied to initial romantic attraction. Front. Neurosci.16, 11. 10.3389/fnins.2022.830820 (2022). 10.3389/fnins.2022.830820 [DOI] [PMC free article] [PubMed] [Google Scholar]
- 10.Arvaneh, M., Guan, C., Ang, K. K. & Quek, C. Optimizing the channel selection and classification accuracy in EEG-based BCI. IEEE Trans. Biomed. Eng.58, 1865–1873. 10.1109/TBME.2011.2131142 (2011). 10.1109/TBME.2011.2131142 [DOI] [PubMed] [Google Scholar]
- 11.Zheng, X. W., Liu, X. F., Zhang, Y. A., Cui, L. Z. & Yu, X. M. A portable HCI system-oriented EEG feature extraction and channel selection for emotion recognition. Int. J. Intell. Syst.36, 152–176. 10.1002/int.22295 (2021). 10.1002/int.22295 [DOI] [Google Scholar]
- 12.Blankertz, B. et al. The Berlin brain-computer interface: accurate performance from first-session in BCI-naive subjects. IEEE Trans. Biomed. Eng.55, 2452–2462. 10.1109/tbme.2008.923152 (2008). 10.1109/tbme.2008.923152 [DOI] [PubMed] [Google Scholar]
- 13.Yousefpour, A., Ibrahim, R. & Hamed, H. N. A. Ordinal-based and frequency-based integration of feature selection methods for sentiment analysis. Expert Syst. Appl.75, 80–93. 10.1016/j.eswa.2017.01.009 (2017). 10.1016/j.eswa.2017.01.009 [DOI] [Google Scholar]
- 14.Aldayel, M., Ykhlef, M. & Al-Nafjan, A. Deep learning for EEG-based preference classification in neuromarketing. Appl. Sci. Basel10, 23. 10.3390/app10041525 (2020). 10.3390/app10041525 [DOI] [Google Scholar]
- 15.Aldayel, M., Ykhlef, M. & Al-Nafjan, A. Recognition of consumer preference by analysis and classification EEG signals. Front. Human Neurosci.10.3389/fnhum.2020.604639 (2021). 10.3389/fnhum.2020.604639 [DOI] [PMC free article] [PubMed] [Google Scholar]
- 16.Hadjidimitriou, S. K. & Hadjileontiadis, L. J. Toward an EEG-based recognition of music liking using time-frequency analysis. IEEE Trans. Biomed. Eng.59, 3498–3510. 10.1109/TBME.2012.2217495 (2012). 10.1109/TBME.2012.2217495 [DOI] [PubMed] [Google Scholar]
- 17.Chew, L. H., Teo, J. & Mountstephens, J. Aesthetic preference recognition of 3D shapes using EEG. Cogn. Neurodyn.10, 165–173. 10.1007/s11571-015-9363-z (2016). 10.1007/s11571-015-9363-z [DOI] [PMC free article] [PubMed] [Google Scholar]
- 18.Naser, D. S. & Saha, G. Influence of music liking on EEG based emotion recognition. Biomed. Signal Process. Control64, 15. 10.1016/j.bspc.2020.102251 (2021). 10.1016/j.bspc.2020.102251 [DOI] [Google Scholar]
- 19.Olderbak, S. G., Malter, F., Wolf, P. S. A., Jones, D. N. & Figueredo, A. J. Predicting romantic interest at zero acquaintance: Evidence of sex differences in trait perception but not in predictors of interest. Eur. J. Personal.31, 42–62. 10.1002/per.2087 (2017). 10.1002/per.2087 [DOI] [PMC free article] [PubMed] [Google Scholar]
- 20.Asendorpf, J. B., Penke, L. & Back, M. D. From dating to mating and relating: Predictors of initial and long-term outcomes of speed-dating in a community sample. Eur. J. Personal.25, 16–30. 10.1002/per.768 (2011). 10.1002/per.768 [DOI] [Google Scholar]
- 21.Cooper, J. C., Dunne, S., Furey, T. & O’Doherty, J. P. Dorsomedial prefrontal cortex mediates rapid evaluations predicting the outcome of romantic interactions. J. Neurosci.32, 15647–15656. 10.1523/jneurosci.2558-12.2012 (2012). 10.1523/jneurosci.2558-12.2012 [DOI] [PMC free article] [PubMed] [Google Scholar]
- 22.Zhang, J., Yuan, G. J., Lu, H. & Liu, G. Y. Recognition of the impulse of love at first sight based on electrocardiograph signal. Comput. Intell. Neurosci.2021, 9. 10.1155/2021/6631616 (2021). 10.1155/2021/6631616 [DOI] [PMC free article] [PubMed] [Google Scholar]
- 23.Fisher, H., Aron, A. & Brown, L. L. Romantic love: An fMRI study of a neural mechanism for mate choice. J. Comparative Neurol.493, 58–62. 10.1002/cne.20772 (2005). 10.1002/cne.20772 [DOI] [PubMed] [Google Scholar]
- 24.Lu, H. A., Yuan, G. J., Zhang, J. & Liu, G. Y. Recognition of impulse of love at first sight based on photoplethysmography signal. Sensors20, 10. 10.3390/s20226572 (2020). 10.3390/s20226572 [DOI] [PMC free article] [PubMed] [Google Scholar]
- 25.Li, D. H., Zhao, X. C., Yuan, G. J., Liu, Y. & Liu, G. Y. Robustness comparison between the capsule network and the convolutional network for facial expression recognition. Appl. Intell.51, 2269–2278. 10.1007/s10489-020-01895-x (2021). 10.1007/s10489-020-01895-x [DOI] [Google Scholar]
- 26.Liu, Y. J. et al. Real-time movie-induced discrete emotion recognition from EEG signals. IEEE Trans. Affect. Comput.9, 550–562. 10.1109/taffc.2017.2660485 (2018). 10.1109/taffc.2017.2660485 [DOI] [Google Scholar]
- 27.Hadjidimitriou, S. K. & Hadjileontiadis, L. J. EEG-based classification of music appraisal responses using time-frequency analysis and familiarity ratings. IEEE Trans. Affect. Comput.4, 161–172. 10.1109/t-affc.2013.6 (2013). 10.1109/t-affc.2013.6 [DOI] [Google Scholar]
- 28.Pfurtscheller, G. & Lopes da Silva, F. H. Event-related EEG/MEG synchronization and desynchronization: basic principles. Clin. Neurophysiol. Official J. Int. Fed. Clin. Neurophysiol.110, 1842–1857. 10.1016/s1388-2457(99)00141-8 (1999). 10.1016/s1388-2457(99)00141-8 [DOI] [PubMed] [Google Scholar]
- 29.Saeb, S., Lonini, L., Jayaraman, A., Mohr, D. C. & Kording, K. P. The need to approximate the use-case in clinical machine learning. Gigascience6, 9. 10.1093/gigascience/gix019 (2017). 10.1093/gigascience/gix019 [DOI] [PMC free article] [PubMed] [Google Scholar]
- 30.Aldayel, M. S., Ykhlef, M. & Al-Nafjan, A. N. Electroencephalogram-based preference prediction using deep transfer learning. IEEE Access8, 176818–176829. 10.1109/access.2020.3027429 (2020). 10.1109/access.2020.3027429 [DOI] [Google Scholar]
- 31.Zhao, X. C. et al. Micro-expression recognition based on nodal efficiency in the EEG functional networks. IEEE Trans. Neural Syst. Rehabil. Eng.32, 887–894. 10.1109/tnsre.2023.3347601 (2024). 10.1109/tnsre.2023.3347601 [DOI] [PubMed] [Google Scholar]
- 32.Xie, J. L., Luo, Y. T., Wang, S. Y. & Liu, G. Y. Electroencephalography-based recognition of six basic emotions in virtual reality environments. Biomed. Signal Process. Control93, 13. 10.1016/j.bspc.2024.106189 (2024). 10.1016/j.bspc.2024.106189 [DOI] [Google Scholar]
- 33.Herz, R. S. Olfactory virtual reality: A new frontier in the treatment and prevention of posttraumatic stress disorder. Brain Sci.11, 1070 (2021). 10.3390/brainsci11081070 [DOI] [PMC free article] [PubMed] [Google Scholar]
- 34.Zheng, X. W., Yu, X. M., Yin, Y. Q., Li, T. T. & Yan, X. Y. Three-dimensional feature maps and convolutional neural network-based emotion recognition. Int. J. Intell. Syst.36, 6312–6336. 10.1002/int.22551 (2021). 10.1002/int.22551 [DOI] [Google Scholar]
Associated Data
This section collects any data citations, data availability statements, or supplementary materials included in this article.
Data Availability Statement
The data and code that support the findings of this study are available from the corresponding author upon reasonable request.


