

Abstract
Context
For more than 20 years, primary prevention of coronary heart disease has included strategies intended to improve overall serum lipid concentrations among youths.
Objective
To examine trends in lipid concentrations among youths from 1988–1994 through 2007–2010.
Design, Setting, and Participants
Cross-sectional analysis of serum lipid concentrations among 16 116 youths aged 6 to 19 years who participated in the nationally representative National Health and Nutrition Examination Survey during 3 time periods: 1988–1994, 1999–2002, and 2007–2010.
Main Outcome Measures
Among all youths, mean serum total cholesterol (TC), non–high-density lipoprotein cholesterol (non–HDL-C), high-density lipoprotein cholesterol (HDL-C); and among adolescents only, low-density lipoprotein cholesterol (LDL-C) and geometric mean triglyceride levels. Trends in adverse lipid concentrations are reported for TC levels of 200 mg/dL and greater, non–HDL-C levels of 145 mg/dL and greater, HDL-C levels of less than 40 mg/dL, LDL-C levels of 130 mg/dL and greater, and triglyceride levels of 130 mg/dL and greater.
Results
Among youths aged 6 to 19 years between 1988–1994 and 2007–2010, there was a decrease in mean TC (from 165 mg/dL [95% CI, 164–167] to 160 mg/dL [95% CI, 158–161]; P<.001) and a decrease in the prevalence of elevated TC (from 11.3% [95% CI, 9.8%−12.7%] to 8.1% [95% CI, 6.7%−9.5%]; P=.002). Mean HDL-C significantly increased between 1988–1994 and 2007–2010, but the prevalence of low HDL-C did not change. Mean non–HDL-C and prevalence of elevated non–HDL-C both significantly decreased over the study period. In 2007–2010, 22% (95% CI, 20.3%−23.6%) of youths had either a low HDL-C level or high non–HDL-C, which was lower than the 27.2% (95% CI, 24.6%−29.7%) in 1988–1994 (P=.001). Among adolescents (aged 12–19 years) between 1988–1994 and 2007–2010, there was a decrease in mean LDL-C (from 95 mg/dL [95% CI, 92–98] to 90 mg/dL [95% CI, 88–91]; P=.003) and a decrease in geometric mean triglycerides (from 82 mg/dL [95% CI, 78–86] to 73 mg/dL [95% CI, 70–76]; P<.001). Prevalence of elevated LDL-C and triglycerides between 1988–1994 and 2007–2010 also significantly decreased.
Conclusions
Between 1988–1994 and 2007–2010, a favorable trend in serum lipid concentrations was observed among youths in the United States but almost 1 in 10 had elevated TC in 2007–2010.
The process of atherosclerosis begins during childhood and is associated with adverse serum lipid concentrations including high concentrations of low-density lipoprotein cholesterol (LDL-C), non–high-density lipoprotein cholesterol (non–HDL-C), and triglycerides, and low concentrations of high-density lipoprotein cholesterol (HDL-C).1–5 Serum lipid concentrations in childhood are associated with serum lipid concentrations in adulthood.6,7
To prevent coronary heart disease, primary prevention efforts for more than 20 years have included both individual strategies for identification and treatment of individuals at high risk and population-based strategies intended to improve mean serum lipid concentrations.8–12 Components of population-based prevention strategies have included promotion of healthy diet including low saturated fat intake, appropriate physical activity, and abstinence from tobacco use.
The purpose of this study is to examine the trends in serum lipid concentrations among children (aged 6–11 years) and adolescents (aged 12–19 years) using data from the National Health and Nutrition Examination Surveys (NHANES) from 3 time periods (1988–1994, 1999–2002, and 2007–2010). Race- and ethnicity-specific trends in serum lipid concentrations and trends among youths with obesity are also examined.
METHODS
Study Design
NHANES includes nationally representative, complex, multistage, probability samples of the US civilian, noninstitutionalized population conducted by the National Center for Health Statistics (NCHS) of the Centers for Disease Control and Prevention (CDC). Participants in NHANES receive a detailed in-person home interview followed by physical assessments, including laboratory measures at a mobile examination center.13,14 All children between 6 and 19 years in the examination component of the NHANES surveys between 1988–1994 and 2007–2010 were eligible for inclusion. As part of the laboratory evaluation, serum total cholesterol (TC) and HDL-C levels were measured in participants aged 6 years and older and fasting (between 8.5 and 23 hours) triglycerides were measured in participants aged 12 years and older.
Written informed consent was obtained from participants aged 12 years and older and written child assent was obtained from those aged 7 to11 years. Written parental consent was obtained for all participants younger than 18 years. The survey was approved by the NCHS ethics review board. The un-weighted examination response rate for youths aged 6 to 19 years ranged from 83% to 86% for NHANES 1988–1994 through 2007–2010.15
Survey Years
Data from NHANES III (1988–1994) and 4 additional NHANES data cycles were included in the analysis including 1999–2000, 2001–2002, 2007–2008, and 2009–2010. To increase sample size and statistical reliability of estimates, multiple data releases were combined. The final categorization of survey years for this analysis was 1988–1994, 1999–2002, and 2007–2010. Data from 2003–2004 and 2005–2006 were not included in this analysis to allow for approximately equal intervals between the midpoints of the survey periods and because changes in laboratory methods during this time period most likely had positive biased HDL-C values.16
Demographic Variables
Age was categorized as 6 to 8, 9 to 11, 12 to 15, and 16 to 19 years. In some stratified analyses, because of smaller sample sizes, age was categorized more broadly as 6 to 11 years (children) and 12 to 19 (adolescent) years. Participants, or a family member for children younger than 16 years, reported their race and ethnicity after being shown a list that included an open-ended response. Race/ethnicity was categorized as non-Hispanic white, non-Hispanic black, Mexican American, and other, including multiracial. In all survey years, non-Hispanic black participants were oversampled and in all years except 2007–2010, Mexican American participants were oversampled. Beginning in 2007–2008, all Hispanic participants, not only those who were Mexican American, were oversampled. However, Mexican American participants had sufficient sample size to follow trends in health outcomes.17 The race/ethnicity group indicated as “other” is included in overall estimates but results for this group are not separately reported.
Obesity Status
Body mass index (BMI) was calculated as weight in kilograms divided by height in meters squared and rounded to the tenth decimal place. Under-weight, normal weight, overweight, and obese categories were defined as 0 to 4, 5 to 84, 85 to 94, and 95 or greater BMI percentile, respectively, on the 2000 CDC growth charts.18 Because obesity prevalence increased over the study period but overweight prevalence was unchanged,19,20 trends in serum lipid concentrations among obese youths are reported.
Laboratory Methods
Venous samples were collected from participants, stored frozen, and shipped to a laboratory according to a standardized protocol.16,21,22 Across survey periods, there have been changes in the laboratories, methods, and analyzers used to measure lipid concentrations from serum. Specific details of lipid laboratory methods for NHANES 1988–1994 and NHANES 1999–2002 have been described.23 In 2007–2010, similar to previous surveys, TC and triglycerides were measured using coupled enzymatic reactions.24,25 In 2007–2010, HDL-C was measured using the direct immunoassay method,26 whereas in 1988–1994 and 1999–2002, HDL-C was measured primarily using the heparin manganese precipitation method.27 LDL-C was calculated for participants with a serum triglyceride concentration of less than or equal to 400 mg/dL according to the Friedewald equation.28 Non–HDL-C was calculated as TC minus HDL-C. In 2007–2010, TC, HDL-C, and triglycerides were analyzed using the Roche/Hitachi Modular P chemistry analyzer (Roche Diagnostics).
Despite changes in laboratory methods during all survey years, standardization of serum lipid measurements was performed according to the criteria of the CDC’s lipid standardization program, which ensures measurements are accurate and comparable across studies.29 Intralaboratory quality control and proficiency testing were performed by the laboratories and met the acceptable performance of allowable bias and imprecision of the lipid standardization program.29 The criteria for bias and imprecision differ for each serum lipid measurement and are dependent on the range of the serum lipid concentrations. For example, a maximum bias of 3% and imprecision of 3% is acceptable for serum TC greater than 149.9 mg/dL, a maximum bias of 5% and imprecision of 4% is acceptable for serum HDL-C greater than or equal to 40 mg/dL, and a maximum bias of 5% and imprecision of 5% is acceptable for serum triglyceride greater than 220 mg/dL.
To convert to SI values (mmol/L) for HDL-C, LDL-C, non−HDL-C, or TC, multiply by 0.0259; and to convert triglyceride values to mmol/L, multiply by 0.0113.
Definitions for Adverse Lipid Concentrations
Adverse lipid concentrations were defined according to the 2011 Expert Panel on Integrated Guidelines for Cardiovascular Health and Risk Reduction in Children and Adolescents as follows: TC of 200 mg/dL or greater, HDL-C of less than 40 mg/dL, non–HDL-C of 145 mg/dL or greater, LDL-C of 130 mg/dL or greater, and triglyceride concentration of 130 mg/dL or greater.12 Prevalence of either low HDL-C or high non–HDL-C is also presented because the expert panel recommends specific clinical management for youths in select age groups, including youths aged 9 to 11 years with these lipid abnormalities.
Statistical Methods
Means and standard errors of the mean are presented for TC, HDL-C, non–HDL-C, and LDL-C. Geometric means and standard errors of geometric means are presented for serum triglyceride concentrations because the distribution of triglycerides is skewed. Sex- and age-specific mean lipids are presented because of differences by sex in lipid concentrations with maturation.30 Prevalence of adverse lipid concentrations are also presented. Sample weights, which account for differential probabilities of selection, nonresponse, and noncoverage were used for all analyses. Estimates for triglyceride and LDL-C concentrations are based on fasting serum specimens. Therefore, for those analyses, fasting sample weights were used; otherwise examination sample weights were used. Standard errors were estimated using Taylor series linearization, a method that incorporates the sample weights and accounts for the complex sample design.31 Statistical hypotheses were tested using the t statistic at α = .05 level based on a 2-sided test, and there was no adjustment for multiple comparisons.
To test for linear trends over the 3 surveys, the null hypothesis of no linear trend was examined using orthogonal contrast matrices.32 Rejection of this hypothesis implied the existence of a linear trend. Sex-specific multiple linear regression models examined trends in serum lipid concentrations while adjusting for age and race/ethnicity. Age-adjusted analyses were also conducted separately for each racial/ ethnic group. Survey period was treated as a categorical variable and age, in years, was analyzed as a continuous variable. In a sensitivity analysis using age grouped as a categorical variable, the results were similar to those reported with age as a continuous variable. Differences in triglyceride concentrations were tested on the log-transformed scale. Beta coefficients and their 95% CIs, derived from the multiple linear regression models, are presented.
All statistical analyses were performed using SAS software version 9.2 (SAS Institute Inc,) and SUDAAN software version 10.0 (RTI).
Missing Data
Approximately 11%, 12%, and 15% of youths in NHANES 1988–1994, 1999–2002, and 2007–2010 were missing data for TC or HDL-C, respectively. Younger children were missing laboratory data more frequently than older children. To assess for possible nonresponse bias as a result of missing data, age-specific analyses were conducted to compare youths with and without missing TC values. There were few differences between youths with and without missing cholesterol values in sociodemographic factors (sex, race/ethnicity, and income), dietary factors (total caloric and percent saturated fat intake although dietary data for 2009–2010 were not available), and body measures (mean BMI and waist circumference). An exception is a lower amount of missing data among Mexican American participants.
To further evaluate the effects of missing data, the sample weights were adjusted for item nonresponse using the PROC WTADJUST procedure in SUDAAN.33 Estimates and conclusions based on these adjusted weights and the publicly available sample weights were similar. Therefore, all reported estimates are based on the publicly available sample weights.
RESULTS
Analytic Sample
The numbers of eligible youths were 6497 for NHANES III, 6995 for NHANES 1999–2002, and 4957 for NHANES 2007–2010. Individuals with missing TC or HDL-C were excluded (738 for NHANES III, 843 for NHANES 1999–2002, and 752 for NHANES 2007–2010). Few adolescents eligible for fasting triglyceride screening were missing values (54 for NHANES III, 31 for NHANES 1999–2002, and 7 for NHANES 2007–2010). Sample sizes are presented in eTable 1 available at http://www.jama.com.
Generally, the distribution of the sample by sex and age were similar across the 3 surveys, however, compared with 1988–1994, the percent of Mexican American youths was higher and non-Hispanic white youths was lower in 2007–2010, a shift seen in the US population during this time period. Further, consistent with previous reports, among youths aged 6 to 19 years, the prevalence of obesity was higher in the later surveys compared with 1988–1994.19,20 The number of obese fasting adolescents was relatively small compared with the sample sizes for other groups (for NHANES III: 161 overall, 72 males, 89 females; 1999–2002: 345 overall, 187 males, 158 females; and 2007–2010: 185 overall, 106 males, 79 females). There are 11 degrees of freedom among fasting adolescent males who were obese in NHANES III, which limits power to detect statistical trends.
Trends in Serum Lipids Among Youths
Among youths aged 6 to 19 years between 1988–1994 and 2007–2010, there was a decrease in mean serum TC from 165 mg/dL (95% CI, 164–167) to 160 mg/dL (95% CI, 158–161) and an increase in mean serum HDL-C from 50.5 mg/dL (95% CI, 49.8–51.3) to 52.2 mg/dL (95% CI, 51.6–52.8) (P<.001 for each trend) (Table 1). Mean serum non–HDL-C decreased from 115 mg/dL (95% CI, 113–116) in 1988–1884 to 107 mg/dL (95% CI, 106–109) in 2007–2010 (P<.001) (Table 2). Generally, the sex-, age-, and race/ethnicity-specific trends for TC, HDL-C, and non– HDL-C were similar in direction to the overall trends and consistent with a favorable trend, although for each group, the magnitude was not the same and the trend was not always significant. Exceptions to a favorable trend include males aged 16 to 19 years and 12- to 19-year-old males who were non-Hispanic white for TC; 6- to 11-year-old males and females who were Mexican American and females who were non-Hispanic black for HDL-C; and males aged 16 to 19 years for non–HDL-C.
Table 1.
Mean Serum Total Cholesterol and HDL-C Over Time by Sex, Age, and Race/Ethnicity Among US Children and Adolescents, Aged 6 to 19 Years, 1988–2010a
| TC, Mean (95% CI), mg/dL | P Value for Trendb | HDL-C, Mean (95% CI), mg/dL | P Value for Trendb | |||||
|---|---|---|---|---|---|---|---|---|
| 1988–1994 | 1999–2002 | 2007–2010 | 1988–1994 | 1999–2002 | 2007–2010 | |||
| Both sexes | 165 (164–167) | 165 (163–166) | 160 (158–161) | <.001 | 50.5 (49.8–51.3) | 49.7 (49.3–50.2) | 52.2 (51.6–52.8) | <.001 |
| Males | 163 (161–165) | 163 (160–165) | 159 (157–160) | .002 | 49.8 (48.9–50.7) | 48.6 (48.0–49.3) | 51.5 (50.9–52.2) | .002 |
| 6–8 | 166 (163–170) | 162 (159–165) | 161 (157–164) | .02 | 52.7 (51.4–54.0) | 51.9 (50.5–53.4) | 55.8 (54.5–57.2) | <.001 |
| 9–11 | 173 (169–176) | 168 (164–171) | 164 (161–167) | <.001 | 54 (52.7–55.3) | 51.4 (49.7–53.1) | 54.4 (53.3–55.5) | .67 |
| 12–15 | 158 (155–161) | 162 (157–167) | 153 (150–157) | .06 | 48.2 (46.7–49.6) | 47.8 (47–48.6) | 51.2 (50.0–52.3) | .001 |
| 16–19 | 158 (155–162) | 160 (157–163) | 159 (155–163) | .80 | 46.1 (44.3–47.8) | 45.1 (44.1–46.0) | 47.3 (46.0–48.5) | .26 |
| Non-Hispanic white | 169 (165–172) | 162 (160–165) | 161 (157–164) | .001 | 52.2 (50.9–53.5) | 50.2 (48.7–51.7) | 53.9 (52.5–55.2) | .07 |
| Non-Hispanic black | 172 (169–175) | 172 (167–176) | 165 (159–171) | .04 | 59.4 (57.8–61.1) | 57.8 (55.8–59.8) | 59.9 (57.9–61.9) | .71 |
| Mexican American | 168 (165–170) | 163 (159–167) | 160 (157–163) | <.001 | 53.8 (52.2–55.3) | 52.2 (50.5–53.9) | 53.5 (51.6–55.3) | .82 |
| Non-Hispanic white | 157 (153–160) | 161 (157–166) | 157 (153–161) | .93 | 45.4 (44.1–46.6) | 45.3 (44.6–46.1) | 48.4 (47.2–49.6) | .001 |
| Non-Hispanic black | 166 (163–169) | 162 (160–165) | 154 (150–158) | <.001 | 52.8 (51.7–53.9) | 51.7 (50.3–53.1) | 53.9 (51.9–55.9) | .35 |
| Mexican American | 161 (158–165) | 160 (158–163) | 158 (154–162) | .18 | 48.1 (46.9–49.3) | 46.9 (45.9–47.9) | 47.5 (46.2–48.8) | .48 |
| Females | 167 (166–169) | 167 (165–169) | 161 (159–163) | <.001 | 51.3 (50.5–52.1) | 50.9 (50.2–51.5) | 52.9 (52.2–53.7) | .004 |
| 6–8 | 166 (163–169) | 170 (166–174) | 161 (159–164) | .008 | 50.5 (48.7–52.3) | 50.8 (49.3–52.3) | 52.3 (50.7–53.8) | .13 |
| 9–11 | 169 (166–172) | 168 (164–171) | 162 (158–166) | .005 | 50.6 (49.2–51.9) | 50.5 (48.8–52.2) | 51.6 (50.1–53.1) | .31 |
| 12–15 | 164 (160–168) | 162 (160–164) | 157 (154–160) | .007 | 51.2 (49.5–52.9) | 50.2 (49.4–51.1) | 52.4 (51.0–53.8) | .25 |
| 16–19 | 171 (166–176) | 169 (165–173) | 163 (160–167) | .009 | 52.5 (51.1–53.8) | 51.7 (50.7–52.7) | 54.7 (53.6–55.9) | .01 |
| Non-Hispanic white | 167 (164–171) | 170 (167–174) | 162 (157–166) | .04 | 49.0 (47.1–50.8) | 49.6 (47.9–51.3) | 51.4 (49.6–53.3) | .05 |
| Non-Hispanic black | 173 (170–177) | 173 (167–179) | 158 (154–162) | <.001 | 56.4 (55–57.9) | 53.9 (52–55.9) | 55.3 (53.3–57.3) | .34 |
| Mexican American | 165 (162–168) | 162 (159–164) | 161 (157–165) | .10 | 51.0 (49.4–52.7) | 50.2 (48.6–51.8) | 50.5 (48.6–52.4) | .64 |
| Non-Hispanic white | 166 (163–170) | 166 (163–170) | 161 (157–165) | .05 | 50.6 (49.3–51.8) | 50.6 (49.5–51.6) | 52.9 (51.4–54.5) | .02 |
| Non-Hispanic black | 170 (167–173) | 167 (165–169) | 161 (157–164) | <.001 | 55.5 (54.2–56.8) | 53.8 (52.6–55.0) | 55.4 (53.6–57.2) | .88 |
| Mexican American | 166 (162–170) | 164 (162–166) | 158 (155–161) | .003 | 52.8 (51.4–54.3) | 50.8 (49.8–51.7) | 53.3 (52.1–54.5) | .61 |
Table 2.
Mean Serum Non–HDL-C Over Time by Sex, Age, and Race/Ethnicity Among US Children and Adolescents, Aged 6 to 19 Years, 1988–2010a
| Non-HDL-C, Mean (95% CI), mg/dL |
P Value for Trendb |
|||
|---|---|---|---|---|
| 1988–1994 | 1999–2002 | 2007–2010 | ||
| Both sexes | 115 (113–116) | 115 (113–117) | 107 (106–109) | <.001 |
| Males | 113 (111–115) | 114 (112–116) | 107 (105–109) | <.001 |
| 6–8 | 114 (110–117) | 110 (107–113) | 105 (101–108) | <.001 |
| 9–11 | 118 (115–122) | 116 (113–119) | 109 (107–112) | <.001 |
| 12–15 | 110 (106–113) | 114 (110–119) | 102 (99–106) | .003 |
| 16–19 | 112 (108–116) | 115 (112–118) | 112 (108–116) | .84 |
| Non-Hispanic white | 117 (113–120) | 112 (109–115) | 107 (104–110) | <.001 |
| Non-Hispanic black | 112 (110–115) | 114 (110–118) | 105 (101–110) | .006 |
| Mexican American | 114 (111–117) | 111 (108–114) | 106 (103–110) | .001 |
| Non-Hispanic white | 111 (108–115) | 116 (112–120) | 108 (104–113) | .29 |
| Non-Hispanic black | 113 (110–116) | 111 (108–113) | 100 (96–105) | <.001 |
| Mexican American | 113 (109–117) | 114 (110–117) | 110 (106–114) | .30 |
| Females | 116 (114–118) | 116 (114–118) | 108 (106–110) | <.001 |
| 6–8 | 116 (112–119) | 119 (115–123) | 109 (106–112) | .003 |
| 9–11 | 118 (115–122) | 117 (113–121) | 110 (106–114) | .002 |
| 12–15 | 113 (109–117) | 112 (109–114) | 105 (102–108) | .003 |
| 16–19 | 118 (113–124) | 117 (114–121) | 109 (106–111) | <.001 |
| Non-Hispanic white | 118 (115–122) | 121 (117–124) | 110 (105–115) | .005 |
| Non-Hispanic black | 117 (114–120) | 119 (114–125) | 103 (99–106) | <.001 |
| Mexican American | 114 (111–117) | 111 (110–113) | 110 (105–115) | .22 |
| Non-Hispanic white | 116 (112–120) | 116 (112–120) | 108 (104–112) | .007 |
| Non-Hispanic black | 115 (111–118) | 113 (112–115) | 105 (101–109) | <.001 |
| Mexican American | 113 (109–117) | 113 (111–115) | 105 (101–108) | .003 |
Abbreviation: non–HDL-C, non–high-density lipoprotein cholesterol.
SI conversion: to convert non–HDL-C to mmol/L, multiply by 0.0259.
Non–HDL-C equals serum total cholesterol minus HDL cholesterol. Data are from National Health and Nutrition Examination Surveys.13,14,17
P Value for linear trend between 1988–1994 and 2007–2010.
Among adolescents (aged 12–19 years), between 1988–1994 and 2007–2010, there was a decrease in mean serum LDL-C from 95 mg/dL (95% CI, 92–98) to 90 mg/dL (95% CI, 88–91) (P=.003) and geometric mean serum triglycerides from 82 mg/dL (95% CI, 78–86) to 73 mg/dL (95% CI, 70–76) (P<.001) (Table 3). Generally, the sex-, age-, and race/ethnicity-specific trends for LDL-C and triglycerides were similar in direction to the overall trends and consistent with a favorable decreasing trend, although for each group, the magnitude was not the same and the trend was not always significant. Among males who were Mexican American, serum triglyceride concentration across the 3 surveys was unchanged.
Table 3.
Mean Serum LDL-C and Geometric Mean Triglycerides Over Time by Sex, Age, and Race/Ethnicity Among US Adolescents, Aged 12 to 19 Years, 1988–2010a
| LDL-C, Mean (95% CI), mg/dL | P Value for Trendb | Triglycerides, Geometric Mean (95% CI), mg/dL | P Value for Trendb | |||||
|---|---|---|---|---|---|---|---|---|
| 1998–1994 | 1999–2002 | 2007–2010 | 1998–1994 | 1999–2002 | 2007–2010 | |||
| Both sexes | 95 (92–98) | 95 (93–97) | 90 (88–91) | .003 | 82 (78–86) | 81 (79–84) | 73 (70–76) | <.001 |
| Males | 91 (87–95) | 96 (92–99) | 89 (85–92) | .39 | 79 (73–85) | 82 (78–86) | 75 (70–80) | .26 |
| 12–15 | 88 (83–93) | 96 (89–103) | 86 (81–90) | .52 | 76 (66–85) | 81 (75–87) | 69 (64–74) | .20 |
| 16–19 | 94 (86–101) | 95 (91–100) | 91 (86–96) | .62 | 82 (72–93) | 83 (78–88) | 81 (75–88) | .84 |
| Non-Hispanic white | 91 (84–98) | 96 (91–101) | 90 (85–96) | .91 | 82 (72–93) | 85 (79–92) | 79 (73–86) | .60 |
| Non-Hispanic black | 99 (94–104) | 96 (93–99) | 86 (79–93) | .001 | 64 (60–69) | 65 (60–70) | 59 (54–63) | .06 |
| Mexican American | 93 (89–98) | 93 (89–97) | 91 (85–96) | .41 | 83 (76–89) | 83 (78–88) | 83 (73–94) | .87 |
| Females | 99 (94–104) | 95 (92–97) | 90 (88–93) | .001 | 85 (79–91) | 81 (76–85) | 71 (66–76) | .001 |
| 12–15 | 94 (88–100) | 92 (89–95) | 88 (85–91) | .07 | 85 (77–93) | 80 (75–85) | 67 (61–74) | .001 |
| 16–19 | 103 (95–112) | 97 (93–101) | 92 (88–97) | .03 | 84 (76–93) | 81 (76–87) | 75 (70–81) | .07 |
| Non-Hispanic white | 100 (93–107) | 94 (89–98) | 91 (88–94) | .02 | 87 (79–95) | 84 (79–90) | 74 (66–82) | .02 |
| Non-Hispanic black | 102 (98–106) | 98 (95–102) | 92 (87–97) | .001 | 66 (61–71) | 65 (59–70) | 55 (50–60) | .001 |
| Mexican American | 92 (85–98) | 93 (90–96) | 87 (84–91) | .20 | 88 (81–95) | 85 (81–89) | 74 (68–79) | .001 |
Abbreviation: LDL-C, low-density lipoprotein cholesterol.
SI conversions: to convert LDL-C to mmol/L, multiply by 0.0259; and to convert triglycerides to mmol/L, multiply by 0.0113.
LDL-C is calculated by the Friedewald equation (LDL=serum total cholesterol−HDL−serum triglyceride/5). This equation is valid only if serum triglycerides are 400 mg/dL or less. Data are from National Health and Nutrition Examination Surveys.13,14,17
P Value for linear trend between 1988–1994 and 2007–2010.
Adjusted Trends in Serum Lipids
Age- and race/ethnicity-adjusted TC was 4.3 mg/dL lower for males and 6.5 mg/dL lower for females in 2007–2010 than in 1988–1994 (males, β=−4.3; 95% CI, −7.1 to −1.5, and females, β= −6.5; 95% CI, −9.1 to −3.8) (Table 4). Males and females who were non-Hispanic black or Mexican American, and also females who were non-Hispanic white had a lower age-adjusted TC in 2007–2010 than in 1988–1994. Although the difference in age-adjusted TC between 1988–1994 and 2007–2010 for males who were non-Hispanic white was not significant, the direction of association for the β coefficient was similar to that for males overall.
Table 4.
Linear Regression Analyses of Serum Lipid Concentrations Among US Children and Adolescents Aged 6 to 19 Years, 1988–2010a
| β Coefficient, (95% CI), mg/dL | ||||||||||
|---|---|---|---|---|---|---|---|---|---|---|
| TC | HDL-C | Non-HDL-Cb | LDL-Cc,d | Log Triglyceridesd | ||||||
| Males | Females | Males | Females | Males | Females | Males | Females | Males | Females | |
| 1988–1994 | 0 [Reference] |
0 [Reference] |
0 [Reference] |
0 [Reference] |
0 [Reference] |
0 [Reference] |
0 [Reference] |
0 [Reference] |
0 [Reference] |
0 [Reference] |
| 1999–2002 | −0.4 (−3.4 to 2.6) |
−0.5 (−2.8 to 1.8) |
−1.2 (−2.2 to −0.1) |
−0.5 (−1.5 to 0.5) |
0.8 (−2.1 to 3.7) |
0 (−2.4 to 2.4) |
4.7 (−0.7 to 10.1) |
−4.1 (−9.2 to 1.1) |
0.03 (−0.05 to 0.12) |
−0.05 (−0.13 to 0.04) |
| 2007–2010 | −4.3 (−7.1 to −1.5) |
−6.5 (−9.1 to −3.8) |
1.9 (0.8 to 3.0) |
1.6 (0.5 to 2.6) |
−6.2 (−9 to −3.3) |
−8.0 (−10.8 to −5.3) |
−2.2 (−7.5 to 3.2) |
−8.2 (−13.2 to −3.3) |
−0.06 (−0.15 to 0.03) |
−0.17 (−0.26 to −0.07) |
| 1988–1994 | 0 [Reference] |
0 [Reference] |
0 [Reference] |
0 [Reference] |
0 [Reference] |
0 [Reference] |
0 [Reference] |
0 [Reference] |
0 [Reference] |
0 [Reference] |
| 1999–2002 | 0 (−3.6. to 3.6) |
1 (−2.2 to 4.2) |
−0.8 (−2.1 to 0.4) |
0.3 (−1.1 to 1.6) |
0.8 (−2.6 to 4.3) |
0.8 (−2.6 to 4.1) |
5.3 (−2.5 to 13) |
−5.2 (−12.6 to 2.2) |
0.03 (−0.1 to 0.17) |
−0.02 (−0.13 to 0.09) |
| 2007–2010 | −3.2 (−6.9 to 0.5) |
−5.7 (−9.8 to −1.6) |
2.6 (1.2 to 3.9) |
2.4 (0.9 to 3.9) |
−5.8 (−9.4 to −2.2) |
−8.1 (−12.2 to −4.0) |
−0.5 (−8.6 to 7.6) |
−8 (−14.9 to −1.1) |
−0.04 (−0.17 to 0.09) |
−0.15 (−0.3 to −0.02) |
| 1988–1994 | 0 [Reference] |
0 [Reference] |
0 [Reference] |
0 [Reference] |
0 [Reference] |
0 [Reference] |
0 [Reference] |
0 [Reference] |
0 [Reference] |
0 [Reference] |
| 1999–2002 | −2.3 (−5.4 to 0.90) |
−1.6 (−5.5 to 2.3) |
−1.4 (−3 to 0.2) |
−2 (−3.4 to −0.6) |
−0.9 (−3.9 to 2.2) |
0.4 (−3.4 to 4.3) |
−3.1 (−8.8 to 2.7) |
−3.6 (−8.6 to 1.4) |
0.01 (−0.09 to 0.10) |
−0.02 (−0.13 to 0.08) |
| 2007–2010 | −9.9 (−13.8 to −6.0) |
−11.9 (−15.8 to −8.0) |
0.9 (−0.9 to 2.8) |
−0.6 (−2.4 to 1.3) |
−10.8 (−14.6 to −7.0) |
−11.3 (−14.9 to −7.7) |
−13.3 (−21.4 to −5.2) |
−10.2 (−16 to −4.4) |
−0.1 (−0.2 to −0.01) |
−0.2 (−0.3 to −0.08) |
| 1988–1994 | 0 [Reference] |
0 [Reference] |
0 [Reference] |
0 [Reference] |
0 [Reference] |
0 [Reference] |
0 [Reference] |
0 [Reference] |
0 [Reference] |
0 [Reference] |
| 1999–2002 | −2.5 (−5.7 to 0.7) |
−2.5 (−5.4 to 0.4) |
−1.4 (−2.9 to 0) |
−1.6 (−2.8 to −0.3) |
−1.1 (−5.0 to 2.8) |
−1 (−3.8 to 1.9) |
−0.9 (−6.7 to 4.8) |
0.9 (−5.8 to 7.6) |
0 (−0.09 to 0.10) |
−0.03 (−0.12 to 0.06) |
| 2007–2010 | −5.6 (−9.0 to −2.2) |
−6.2 (−10.2 to −2.3) |
−0.5 (−2 to 1.1) |
0 (−1.3 to 1.3) |
−5.1 (−9.2 to −1.1) |
−6.2 (−10.6 to −1.9) |
−3.2 (−10 to 3.7) |
−4.7 (−11.7 to 2.2) |
0 (−0.13 to 0.14) |
−0.18 (−0.29 to −0.07) |
Abbreviations: HDL-C, high-density lipoprotein cholesterol; LDL-C, low-density lipoprotein cholesterol; non–HDL-C, non–high-density lipoprotein cholesterol; TC, total cholesterol.
Non–HDL-C equals serum TC minus HDL-C.
LDL-C is calculated by the Friedewald equation (LDL=Serum TC−HDL−serum triglyceride/5). This equation is valid only if serum triglycerides are 400 mg/dL or less.
Analyses for LDL-C and triglycerides include only youths aged 12 to 19 years.
Adjusted for age and race/ethnicity.
Adjusted for age.
Age- and race/ethnicity- adjusted HDL-C was higher for males and females in 2007–2010 than in 1988–1994. Among males and females who were non-Hispanic black or Mexican American, there was no significant increase in age-adjusted HDL-C, although there was an increase among those who were non-Hispanic white. In 2007–2010, compared with 1988–1994, age-adjusted non–HDL-C was lower for males and females and also for each race/ethnic group.
Among adolescent males, neither age- and race/ethnicity–adjusted LDL-C nor log-transformed triglyceride concentrations differed between 1988–1994 and 2007–2010. However, among males who were non-Hispanic black, there was a decrease in age-adjusted LDL-C and triglyceride concentrations in 2007–2010 compared with 1988–1994, a finding not observed among males who were non-Hispanic white or Mexican American. Among adolescent females, age- and race/ethnicity–adjusted LDL-C and log-transformed triglycerides were lower in 2007–2010 than in 1988–1994. Age-adjusted LDL-C and log-transformed triglycerides were lower in 2007–2010 than in 1988–1994 for adolescent females who were non-Hispanic white or black. Among adolescent females who were Mexican American, age-adjusted log-transformed triglycerides were lower in 2007–2010 than in 1988–1994, but age-adjusted LDL-C between the periods were not significantly different.
In 1999–2002, compared with 1988–1994, age- and race/ethnicity–adjusted TC, non–HDL-C, LDL-C, and log-transformed triglyceride concentrations did not differ significantly, nor were there significant differences in the sex- and race/ethnicity–specific models. HDL-C in 1999–2002 did not significantly differ from 1988–1994 except among males in the age- and race/ethnicity–adjusted model (β=−1.2; 95% CI, −2.2 to −0.1; P=.03) and among females (non-Hispanic black, β=−2.0; 95% CI, −3.4 to −0.6; P = .005 and Mexican American, β=−1.6; 95% CI, −2.8 to −0.3; P=.01) in age-adjusted models.
Weight Status and Lipid Trends
Overall, among youths with obesity, there were declines in TC, non–HDL-C, LDL-C, and triglycerides over the study period (Table 5). For example, mean TC decreased 8 mg/dL; whereas compared with youths overall, the decrease in TC was 5 mg/dL. Among youths with obesity, change in HDL-C over time was not significant (P=.32).
Table 5.
Mean Lipid Concentrations Over Time, by Sex and Age, Among US Children and Adolescents With Obesity Aged 6 to 19 Years, 1988–2010
| mg/dL (95% CI) | P Value for Trenda | |||
|---|---|---|---|---|
| 1988–1994 | 1999–2002 | 2007–2010 | ||
| Total | 172 (169–176) | 173 (170–176) | 164 (161–167) | .001 |
| 6–11 | 177 (171–184) | 172 (167–177) | 168 (162–173) | .03 |
| 12–19 | 174 (164–184) | 175 (170–180) | 162 (155–170) | .06 |
| 6–11 | 170 (164–176) | 171 (163–178) | 167 (162–173) | .54 |
| 12–19 | 166 (158–174) | 172 (167–176) | 160 (157–163) | .13 |
| Total | 44.2 (42.5–45.9) | 43.9 (43.2–44.7) | 45.2 (44.2–46.1) | .32 |
| 6–11 | 48.5 (45.9–51.1) | 47.3 (45.4–49.3) | 47.7 (45.8–49.6) | .63 |
| 12–19 | 40.7 (39–42.4) | 40 (38.4–41.6) | 41.9 (40.4–43.5) | .26 |
| 6–11 | 45.3 (39.8–50.7) | 44.6 (42.5–46.8) | 44.5 (42.9–46.1) | .78 |
| 12–19 | 43.2 (41.1–45.6) | 44.7 (43.3–46.1) | 47.3 (45.6–49) | .003 |
| Total | 128 (124–132) | 129 (126–132) | 119 (116–122) | <.001 |
| 6–11 | 129 (122–135) | 125 (120–130) | 120 (115–125) | .03 |
| 12–19 | 133 (123–143) | 135 (131–140) | 120 (113–128) | .04 |
| 6–11 | 125 (120–130) | 126 (119–133) | 123 (117–129) | .66 |
| 12–19 | 123 (116–131) | 127 (123–132) | 113 (109–116) | .01 |
| Total | 103 (97–109) | 105 (101–109) | 94 (89–100) | .03 |
| Males, y | 109 (93–124) | 107 (101–112) | 95 (86–103) | .09 |
| Females | 97 (84–109) | 104 (98–109) | 94 (87–101) | .68 |
| Total | 107 (92–122) | 109 (99–119) | 86 (79–94) | .008 |
| Males, y | 117 (90–143) | 125 (106–143) | 94 (84–105) | .07 |
| Females | 97 (79–115) | 92 (82–102) | 78 (67–89) | .05 |
Abbreviations: HDL-C, high-density lipoprotein cholesterol; LDL-C, low-density lipoprotein cholesterol.
SI conversions: to convert HDL-C, LDL-C, non–HDL-C, or triglycerides to mmol/L, multiply by 0.0259.
The effects of including weight status, in addition to age and race/ ethnicity to the overall linear regression models presented in Table 4 were also examined. Compared with the β coefficients presented in Table 4, those estimated with inclusion of weight status in the model were of a slightly larger magnitude. For example, compared with 1988–1994, the β coefficients for TC in 2007–2010 were −5.3 (95% CI, −8.1 to −2.6) and −7.3 (95% CI, −9.9 to −4.6) for males and females (eTable 4).
Trends in Prevalence of Adverse Lipid Concentrations
Among youths aged 6 to 19 years between 1988–1994 and 2007–2010, there was a decrease in prevalence of elevated TC from 11.3% (95% CI, 9.8%−12.7%) to 8.1% (95% CI, 6.7%−9.5%) (P=.002) and non–HDL-C from 13.6% (95% CI, 12.1%−15%) to 10% (95% CI, 8.4%−11.5%) (P=.001) (Figure). Prevalence of low HDL-C was 17.3% (95% CI, 15%−19.5%) in 1988–1994 and 14.8% (95% CI, 13.7%−15.9%) in 2007–2010, a nonsignificant decrease (P=.05). The prevalence of an adverse concentration of either HDL-C or non–HDL-C decreased across the 3 surveys overall (P=.001). In 2007–2010 among children aged 9 to 11 years, 22.2% (95% CI, 19.1%−25.3%) had either low HDL-C or high non–HDL-C compared with 24.0% (95% CI, 19.3%−28.7%) in 1988–1994 (eTable 2). Among adolescents, there was a decrease in prevalence of elevated LDL-C and triglycerides between 1988–1994 and 2007–2010 (P=.03 for each trend) (eTable 3).
Figure.
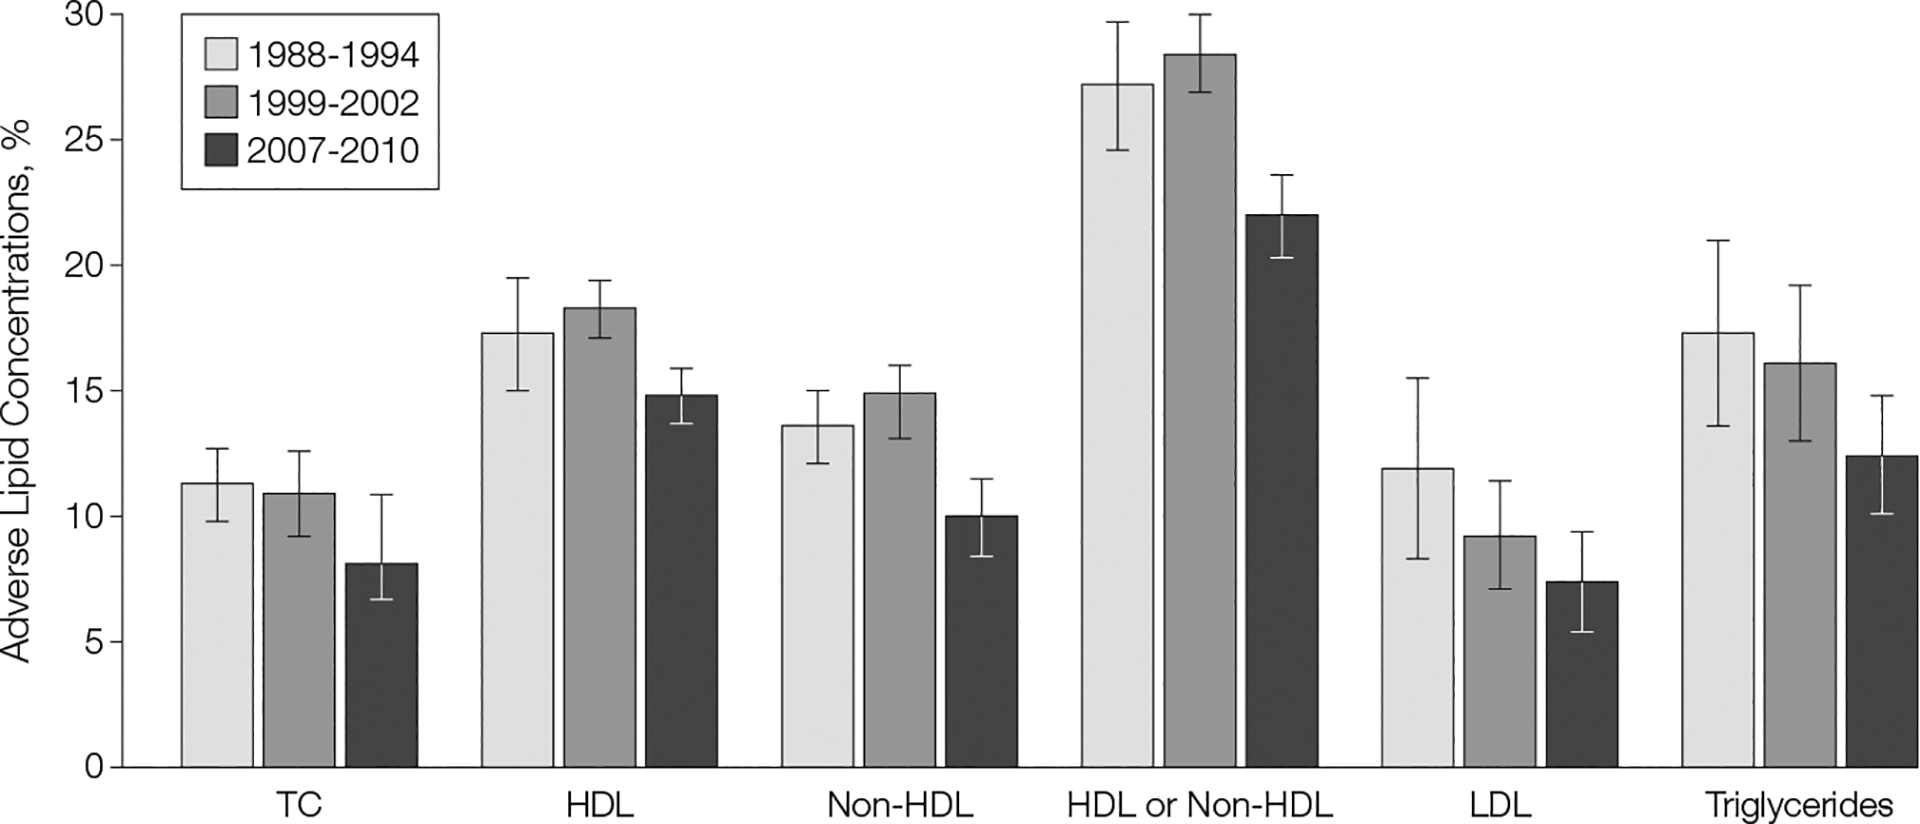
Prevalence of Adverse Lipid Concentrations Over Time Among US Children and Adolescents, 1988–2010
Adverse lipid concentrations: total cholesterol (TC, ≥200 mg/dL), high-density lipoprotein (HDL) cholesterol (<40 mg/dL), non-HDL cholesterol (≥145 mg/dL), low-density lipoprotein (LDL) cholesterol (≥130 mg/dL), and triglycerides (≥130 mg/dL). All comparisons, except HDL, show a significant linear trend between 1988–1994 and 2007–2010 (P<.05). Comparisons for TC, HDL, non-HDL, and either HDL or non-HDL are among youths aged 6 to 19 years; LDL and triglyceride comparisons are among youths aged 12 to 19 years. Sample sizes: for TC, HDL, non-HDL, and either HDL or non-HDL, 5759 in 1988–1994, 6152 in 1999–2002, and 4205 in 2007–2010; for LDL, 1093 in 1988–1994, 1853 in 1999–2002, and 995 in 2007–2010; and for triglycerides, 1106 in 1988–1994, 1861 in 1999–2002, and 996 in 2007–2010. Error bars indicate 95% CIs. Data are from National Health and Nutrition Examination Surveys.13,14,17
COMMENT
Between 1988–1994 and 2007–2010, a favorable trend in serum lipid concentrations was observed among youths in the United States but adverse lipid profiles continue to be observed among youths. For example, in 2007–2010, slightly more than 20% of children aged 9 to 11 years had either a low HDL-C or high non–HDL-C concentration, which, according to the most recent cardiovascular health guidelines for children and adolescents, indicates a need for additional clinical evaluation.12
Previous studies of serum lipids in youths in the United States have demonstrated declines among adolescents in mean TC levels between the 1960s and 1988–1994,35 and stabilization of serum TC concentrations among youths between 1988–1994 and 1999–2000.36 By examining lipid concentrations over an additional decade, a continuation in the overall decline in serum TC since the late 1980s is observed. These declines are comparable to those reported among US adults during a similar time frame. For example, among adults aged 20 years and older, mean age-adjusted serum TC was 206 mg/dL in 1988–1994 and 198 mg/dL in 2005–2008.34
Serum lipid concentrations are affected by a variety of factors including sex, age,30 race/ethnicity,35 timing of puberty,37 diet,38,39 tobacco smoke exposure,40,41 physical activity,42 lipid-lowering medications,43 socioeconomic factors,44 and body weight.45 Secular trends in the correlates of serum lipid concentrations may have affected serum lipid concentrations over time. Limited data describe trends in dietary fat intake among youths during this study period; however, in 2007–2008, children and adolescents consumed 11% to 12% of daily calories from saturated fat,45 which is higher than current recommendations.47 Among adults who are non-Hispanic white, declines in serum trans-fatty acids of approximately 50% have been reported between 2000 and 2009.48 The extent to which the trends in trans-fatty acids may be generalized to other populations, including youths, is unknown. There have been declines in environmental tobacco smoke exposure49 among children and in tobacco use50 among high school students during this study period, which may have contributed to the higher HDL-C values. Few youths meet indications for treatment with lipid-lowering medications;51 thus changes in medication use likely did not contribute substantially to the observed lipid trends. Because dietary choices may be influenced by country of birth52 and family income,53 trends in immigration and socioeconomic status may have also influenced findings in this study.
The association between obesity and adverse serum lipid concentrations has been previously described.45 In this analysis, improvements in serum lipids were observed for youths overall and also in youths with obesity. Thus, despite an increase in obesity prevalence during the study period, an overall improvement in serum lipids was observed. In linear regression models comparing differences in serum lipids in 2007–2010 to 1988–1994, inclusion of weight status in the models, in addition to race/ethnicity and age, resulted in β coefficients with a slightly larger magnitude. These findings suggest the observed improvements in serum lipid concentrations over time may have been slightly larger had there been no increase in obesity prevalence. Recently Freedman et al54 reported a decline in elevated blood pressure among youths in the Bogalusa Heart Study between 1974 and 1993, a period of increased obesity prevalence. Both serum lipids and blood pressure are correlated with BMI but factors other than BMI also contribute to the variability of these cardiovascular risk factors.
Generally, improvements in serum lipid concentrations were observed for each examined race/ethnic group, although there were exceptions for specific lipids. Among non-Hispanic black and Mexican American males and females, no increase in HDL-C was observed, whereas an increase was observed among non-Hispanic white youths. Among non-Hispanic white and Mexican American adolescent males, there was no significant change in LDL-C or triglycerides, but a decrease was observed among males who were non-Hispanic black. Future studies examining trends in correlates of lipid concentrations and their influence on the lipid trends reported in this study may provide additional insight to the overall race/ethnic and weight status–specific trends in serum lipid concentrations.
No other studies have measured serum lipid concentrations among youths in a nationally representative sample of the US population for as long as NHANES. This is a significant strength of our study. This study has limitations including possible nonresponse bias as a result of missing data. However, there were few differences between youths with and without missing data and reweighting of the data did not result in substantive differences; thus, the lipid results are likely minimally biased by nonresponse. Changes in laboratory methods may have affected the observed trends and are therefore a potential limitation. However, to minimize method effects during all survey periods, serum lipids were standardized according to the criteria of the CDC’s lipid standardization program. Although adherence to the standardization program allows for bias, changes as a result of a method effect would not be expected to result in similar conclusions for each of the measured lipids, which each have different methods of measurement. Future analyses with additional data points may provide perspective into the observed trends reported in this study. Pubertal status was not collected throughout the study period and therefore, could not be incorporated into this analysis.
The recently released Expert Panel on Integrated Guidelines for Cardiovascular Health and Risk Reduction in Children and Adolescents provides recommendations for preventing the development of cardiovascular risk factors including optimizing nutrition and physical activity and reducing exposure to tobacco smoke.12 Specific screening approaches, including universal screening at select ages and management of adverse lipid concentrations, have also been detailed in these recent guidelines for youths. Future research from longitudinal studies or mortality-linked data, including NHANES, may include examining clinical outcomes for cardiovascular disease, including cardiovascular mortality, based on lipid concentrations present during childhood.
Supplementary Material
Funding/Support:
The laboratory analysis of the lipids described in this paper was funded by the National Heart, Lung, and Blood Institute, National Institutes of Health, Intra-agency Agreement number Y1-HC-8039.
Role of the Sponsor:
All data used in this study were collected by the National Center for Health Statistics (NCHS) and the Centers for Disease Control and Prevention (CDC). The CDC reviewed and approved this report before submission.
Footnotes
Conflict of Interest Disclosures: All authors have completed and submitted the ICMJE Form for Disclosure of Potential Conflicts of Interest and none were reported.
Disclaimer: The findings and conclusions in this report are those of the authors and not necessarily those of the NCHS, CDC.
Online-Only Material: The 4 eTables and the Author Video Interview are available at http://www.jama.com.
REFERENCES
- 1.Berenson GS, Srinivasan SR, Bao W, Newman WP III, Tracy RE, Wattigney WA. Association between multiple cardiovascular risk factors and atherosclerosis in children and young adults: the Bogalusa Heart Study. N Engl J Med. 1998;338(23):1650–1656. [DOI] [PubMed] [Google Scholar]
- 2.Li S, Chen W, Srinivasan SR, et al. Childhood cardiovascular risk factors and carotid vascular changes in adulthood: the Bogalusa Heart Study. JAMA. 2003; 290(17):2271–2276. [DOI] [PubMed] [Google Scholar]
- 3.Raitakari OT, Juonala M, Kähönen M, et al. Cardiovascular risk factors in childhood and carotid artery intima-media thickness in adulthood: the Cardiovascular Risk in Young Finns Study. JAMA. 2003; 290(17):2277–2283. [DOI] [PubMed] [Google Scholar]
- 4.Relationship of atherosclerosis in young men to serum lipoprotein cholesterol concentrations and smoking: a preliminary report from the Pathobiological Determinants of Atherosclerosis in Youth (PDAY) Research Group. JAMA. 1990;264(23):3018–3024. [DOI] [PubMed] [Google Scholar]
- 5.Frontini MG, Srinivasan SR, Xu J, Tang R, Bond MG, Berenson GS. Usefulness of childhood non–high-density lipoprotein cholesterol levels versus other lipoprotein measures in predicting adult subclinical atherosclerosis: the Bogalusa Heart Study. Pediatrics. 2008; 121(5):924–929. [DOI] [PubMed] [Google Scholar]
- 6.Webber LS, Srinivasan SR, Wattigney WA, Berenson GS. Tracking of serum lipids and lipoproteins from childhood to adulthood: the Bogalusa Heart Study. Am J Epidemiol. 1991;133(9):884–899. [DOI] [PubMed] [Google Scholar]
- 7.Lauer RM, Clarke WR. Use of cholesterol measurements in childhood for the prediction of adult hypercholesterolemia: the Muscatine Study. JAMA. 1990; 264(23):3034–3038. [PubMed] [Google Scholar]
- 8.National Cholesterol Education Program. National Cholesterol Education Program: report of the Expert Panel on Population Strategies for Blood Cholesterol Reduction: executive summary. Arch Intern Med. 1991;151(6):1071–1084. [DOI] [PubMed] [Google Scholar]
- 9.American Academy of Pediatrics. American Academy of Pediatrics: National Cholesterol Education Program: report of the Expert Panel on Blood Cholesterol Levels in Children and Adolescents. Pediatrics. 1992;89(3 pt 2):525–584. [PubMed] [Google Scholar]
- 10.American Academy of Pediatrics. Committee on Nutrition: cholesterol in childhood. Pediatrics. 1998; 101(1 pt 1):141–147. [PubMed] [Google Scholar]
- 11.Daniels SR, Greer FR; Committee on Nutrition. Lipid screening and cardiovascular health in childhood. Pediatrics. 2008;122(1):198–208. [DOI] [PubMed] [Google Scholar]
- 12.Expert Panel on Integrated Guidelines for Cardiovascular Health and Risk Reduction in Children and Adolescents; National Heart, Lung, and Blood Institute. Expert panel on integrated guidelines for cardiovascular health and risk reduction in children and adolescents: summary report. Pediatrics. 2011;128 (suppl 5):S213–S256. [DOI] [PMC free article] [PubMed] [Google Scholar]
- 13.Centers for Disease Control and Prevention/ National Center for Health Statistics. NHANES 1999–2010. http://www.cdc.gov/nchs/nhanes.htm. Accessed May 14, 2012.
- 14.Plan and operation of the Third National Health and Nutrition Examination Survey, 1988–94, series 1: programs and collection procedures. Vital Health Stat Ser 1. 1994;(32):1–407. [PubMed] [Google Scholar]
- 15.National Center for Health Statistics. NHANES response rates and CPS totals. http://www.cdc.gov/nchs/nhanes/response_rates_CPS.htm. Accessed May 14, 2012.
- 16.Centers for Disease Control and Prevention/National Center for Health Statistics. Laboratory procedure manual/high density lipoprotein cholesterol: 2010. http://www.cdc.gov/nchs/nhanes/nhanes2009-2010/HDL_F.htm. Accessed May 14, 2012.
- 17.Centers for Disease Control and Prevention/National Center for Health Statistics. NHANES 2009–2010 public data general release file documentation. http://www.cdc.gov/nchs/nhanes/nhanes2009-2010/generaldoc_f.htm. Accessed March 24, 2012.
- 18.Kuczmarski RJ, Ogden CL, Guo SS, et al. 2000 CDC growth charts for the United States: methods and development. Vital Health Stat 11. 2002;(246): 1–190. [PubMed] [Google Scholar]
- 19.Ogden CL, Carroll MD, Kit BK, Flegal KM. Prevalence of obesity and trends in body mass index among US children and adolescents, 1999–2010. JAMA. 2012; 307(5):483–490. [DOI] [PMC free article] [PubMed] [Google Scholar]
- 20.Ogden CL, Flegal KM, Carroll MD, Johnson CL. Prevalence and trends in overweight among US children and adolescents, 1999–2000. JAMA. 2002; 288(14):1728–1732. [DOI] [PubMed] [Google Scholar]
- 21.Centers for Disease Control and Prevention/National Center for Health Statistics/Division of Health and Nutrition Surveys. Laboratory procedure manual/total cholesterol, 2010. http://www.cdc.gov/nchs/nhanes/nhanes2009-2010/TCHOL_F.htm. Accessed May 14, 2012.
- 22.Centers for Disease Control and Prevention/ National Center for Health Statistics. Laboratory procedure manual/triglycerides. 2010. http://www.cdc.gov/nchs/nhanes/nhanes2009-2010/TRIGLY_F.htm. Accessed May 14, 2012.
- 23.Carroll MD, Lacher DA, Sorlie PD, et al. Trends in serum lipids and lipoproteins of adults, 1960–2002. JAMA. 2005;294(14):1773–1781. [DOI] [PubMed] [Google Scholar]
- 24.Allain CC, Poon LS, Chan CS, Richmond W, Fu PC. Enzymatic determination of total serum cholesterol. Clin Chem. 1974;20(4):470–475. [PubMed] [Google Scholar]
- 25.Wahlefeld A, Bergmeyer HU, eds. Methods of Enzymatic Analysis. 2nd English ed. New York, NY: Academic Press, Inc; 1974. [Google Scholar]
- 26.Sugiuchi H, Uji Y, Okabe H, et al. Direct measurement of high-density lipoprotein cholesterol in serum with polyethylene glycol-modified enzymes and sulfated alpha-cyclodextrin. Clin Chem. 1995; 41(5):717–723. [PubMed] [Google Scholar]
- 27.Bachorik PS, Walker RE, Virgil DG. High-density-lipoprotein cholesterol in heparin-MnCl2 supernates determined with the Dow enzymic method after precipitation of Mn2[H11001] with HCO3-. Clin Chem. 1984; 30(6):839–842. [PubMed] [Google Scholar]
- 28.Friedewald WT, Levy RI, Fredrickson DS. Estimation of the concentration of low-density lipoprotein cholesterol in plasma, without use of the preparative ultracentrifuge. Clin Chem. 1972;18(6):499–502. [PubMed] [Google Scholar]
- 29.The Centers for Disease Control and Prevention /Lipid Standardization Program. Laboratory quality assurance and standardization programs: 2012. http://www.cdc.gov/labstandards/lsp_faq.html. Accessed July 18, 2012.
- 30.Friedman LA, Morrison JA, Daniels SR, McCarthy WF, Sprecher DL. Sensitivity and specificity of pediatric lipid determinations for adult lipid status: findings from the Princeton Lipid Research Clinics Prevalence Program Follow-up Study. Pediatrics. 2006; 118(1):165–172. [DOI] [PubMed] [Google Scholar]
- 31.Wolter KM. Variance Estimation. New York, NY: Springer-Verlag; 1990:Chapter 6. [Google Scholar]
- 32.Winer BJ. Statistical Principles in Experimental Design. New York, NY: McGraw-Hill Companies; 1971. [Google Scholar]
- 33.Research Triangle Institute. SUDAAN Language Manual, Release 10. Research Triangle Park, NC: Research Triangle Institute; 2008. [Google Scholar]
- 34.National Center for Health Statistics. Health, United States, 2010. Hyattsville, MD: US Dept of Health and Human Services; 2010. [Google Scholar]
- 35.Hickman TB, Briefel RR, Carroll MD, et al. Distributions and trends of serum lipid levels among United States children and adolescents ages 4–19 years: data from the Third National Health and Nutrition Examination Survey. Prev Med. 1998;27(6):879–890. [DOI] [PubMed] [Google Scholar]
- 36.Ford ES, Mokdad AH, Ajani UA. Trends in risk factors for cardiovascular disease among children and adolescents in the United States. Pediatrics. 2004; 114(6):1534–1544. [DOI] [PubMed] [Google Scholar]
- 37.Berenson GS, Srinivasan SR, Cresanta JL, Foster TA, Webber LS. Dynamic changes of serum lipoproteins in children during adolescence and sexual maturation. Am J Epidemiol. 1981;113(2):157–170. [DOI] [PubMed] [Google Scholar]
- 38.Welsh JA, Sharma A, Cunningham SA, Vos MB. Consumption of added sugars and indicators of cardiovascular disease risk among US adolescents. Circulation. 2011;123(3):249–257. [DOI] [PMC free article] [PubMed] [Google Scholar]
- 39.Efficacy and safety of lowering dietary intake of fat and cholesterol in children with elevated low-density lipoprotein cholesterol: the Dietary Intervention Study in Children (DISC): the Writing Group for the DISC Collaborative Research Group. JAMA. 1995; 273(18):1429–1435. [DOI] [PubMed] [Google Scholar]
- 40.Feldman J, Shenker IR, Etzel RA, et al. Passive smoking alters lipid profiles in adolescents. Pediatrics. 1991;88(2):259–264. [PubMed] [Google Scholar]
- 41.Neufeld EJ, Mietus-Snyder M, Beiser AS, Baker AL, Newburger JW. Passive cigarette smoking and reduced HDL cholesterol levels in children with high-risk lipid profiles. Circulation. 1997;96(5):1403–1407. [DOI] [PubMed] [Google Scholar]
- 42.Thorland WG, Gilliam TB. Comparison of serum lipids between habitually high and low active pre-adolescent males. Med Sci Sports Exerc. 1981; 13(5):316–321. [PubMed] [Google Scholar]
- 43.Wiegman A, Hutten BA, de Groot E, et al. Efficacy and safety of statin therapy in children with familial hypercholesterolemia: a randomized controlled trial. JAMA. 2004;292(3):331–337. [DOI] [PubMed] [Google Scholar]
- 44.Donahue RP, Orchard TJ, Kuller LH, Drash AL. Lipids and lipoproteins in a young adult population: the Beaver County Lipid Study. Am J Epidemiol. 1985; 122(3):458–467. [DOI] [PubMed] [Google Scholar]
- 45.Freedman DS, Dietz WH, Srinivasan SR, Berenson GS. The relation of overweight to cardiovascular risk factors among children and adolescents: the Bogalusa Heart Study. Pediatrics. 1999;103(6 Pt 1): 1175–1182. [DOI] [PubMed] [Google Scholar]
- 46.US Dept of Agriculture, Agriculture Research Service. Percentages of energy from protein, carbohydrate, fat, and alcohol, by gender and age, in the United States 2007–2008. http://www.ars.usda.gov/SP2UserFiles/Place/12355000/pdf/0708/Table_5_EIN_GEN_07.pdf. Accessed May 21, 2012.
- 47.U S Dept of Agriculture; Dept of Health and Human Services. Dietary Guidelines for Americans, 2010. 7th ed. Washington, DC: Government Printing Office; 2010. [DOI] [PMC free article] [PubMed] [Google Scholar]
- 48.Vesper HW, Kuiper HC, Mirel LB, Johnson CL, Pirkle JL. Levels of plasma trans-fatty acids in non-Hispanic white adults in the United States in 2000 and 2009. JAMA. 2012;307(6):562–563. [DOI] [PMC free article] [PubMed] [Google Scholar]
- 49.Centers for Disease Control and Prevention (CDC). Disparities in secondhand smoke exposure—United States, 1988–1994 and 1999–2004. MMWR Morb Mortal Wkly Rep. 2008;57(27):744–747. [PubMed] [Google Scholar]
- 50.Centers for Disease Control and Prevention, Division of Adolescent and School Health. Trends in the prevalence of tobacco use national YRBS: 1991–2009. www.cdc.gov/healthyyouth/yrbs/pdf/us_tobacco_trend_yrbs.pdf. Accessed March 27, 2012.
- 51.Ford ES, Li C, Zhao G, Mokdad AH. Concentrations of low-density lipoprotein cholesterol and total cholesterol among children and adolescents in the United States. Circulation. 2009;119(8):1108–1115. [DOI] [PubMed] [Google Scholar]
- 52.Sofianou A, Fung TT, Tucker KL. Differences in diet pattern adherence by nativity and duration of US residence in the Mexican-American population. J Am Diet Assoc. 2011;111(10):1563–1569. [DOI] [PubMed] [Google Scholar]
- 53.Reedy J, Krebs-Smith SM. Dietary sources of energy, solid fats, and added sugars among children and adolescents in the United States. J Am Diet Assoc. 2010;110(10):1477–1484. [DOI] [PMC free article] [PubMed] [Google Scholar]
- 54.Freedman DS, Goodman A, Contreras OA, Dasmahapatra P, Srinivasan SR, Berenson GS. Secular trends in BMI and blood pressure among children and adolescents: the Bogalusa Heart Study. Pediatrics. 2012;130(1):e159–e166. [DOI] [PMC free article] [PubMed] [Google Scholar]
Associated Data
This section collects any data citations, data availability statements, or supplementary materials included in this article.