Abstract
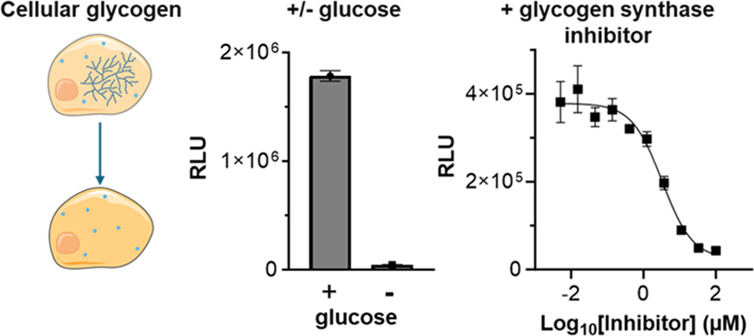
Glycogen is a large polymer of glucose that functions as an important means of storing energy and maintaining glucose homeostasis. Glycogen synthesis and degradation pathways are highly regulated and their dysregulation can contribute to disease. Glycogen storage diseases are a set of disorders that arise from improper glycogen metabolism. Glycogen storage disease II, known as Pompe disease, is caused by a genetic mutation that leads to increased glycogen storage in cells and tissues, resulting in progressive muscle atrophy and respiratory decline for patients. One approach for treating Pompe disease is to reduce glycogen levels by interfering with the glycogen synthesis pathway through glycogen synthase inhibitors. To facilitate the study of glycogen synthase inhibitors in biological samples, such as cultured cells, a high-throughput approach for measuring cellular glycogen was developed. A bioluminescent glycogen detection assay was automated and used to measure the glycogen content in cells grown in 384-well plates. The assay successfully quantified reduced glycogen stores in cells treated with a series of glycogen synthase 1 inhibitors, validating the utility of the assay for drug screening efforts and demonstrating its value for therapy development and glycogen metabolism research.
Introduction
Glucose is a major energy source for cells and organisms, providing ATP and metabolic intermediates for critical cell processes. Cells store glucose in the form of glycogen, a large intracellular polymer of glucose monomers that can be rapidly mobilized to support energy needs and maintain glucose homeostasis at the cellular, tissue, and organismal levels.1,2 Glycogen polymers can contain up to 55,000 glucose units and the processes of glycogen synthesis and degradation are tightly regulated, involving several enzymes.1,2 Metabolic reprogramming in cells can lead to increased glycogen reserves, an adaptation that can potentially sustain cells in-low glucose environments, avoiding the need for external glucose sources. Dysregulation of glycogen metabolism has also been implicated in diseases such as neurodegenerative diseases,3 cancer,4,5 diabetes,6 and glycogen storage diseases (GSD’s;7). Glycogen’s important role in health and disease makes it a target of interest for various therapies.8
There are several types of glycogen storage diseases with different enzyme defects and clinical presentations. Pompe disease is glycogen storage disease II, and it is characterized by mutations in the acid alpha-glucosidase enzyme (GAA) that alter its ability to degrade glycogen.9,10 Glycogen degradation occurs through two main pathways: cytosolic and lysosomal.1 GAA is responsible for lysosomal degradation and with reduced or nonexistent GAA activity, glycogen builds up in the tissues of patients with Pompe disease, leading to severe musculoskeletal symptoms and shortened lifespan.9,10
Substrate reduction therapy (SRT) has been proposed as a novel therapeutic hypothesis to test for the treatment of patients with Pompe disease.11 This approach targets the inhibition of Glycogen Synthase 1 (GYS1) to reduce glycogen in the muscle tissues affected in Pompe disease.12 GYS1 is the rate-limiting enzyme in glycogen synthesis within muscle cells, and the inhibition of GYS1 has been demonstrated to reduce glycogen accumulation in muscles cells.12 Two groups have published reports describing the synthesis and characterization of small molecule inhibitors of GYS1 activity12,13 and both used initial screening platforms which relied on in vitro reactions with recombinant enzymes. While in vitro biochemical enzyme assays are useful for deriving IC50 values, they are unable to predict cell permeability or cell stability.
Many commonly used cellular glycogen assays rely on colorimetric readouts with limited dynamic range and poor sensitivity which necessitates large sample input. These features, along with heating and centrifugation steps during sample processing, hinder the application of these methods for cell-based glycogen measurements in high-throughput formats. To address this need in the research community, we evaluated a bioluminescent glycogen assay with a broad assay range and greater sensitivity for compatibility with high-throughput screening protocols. The bioluminescent glycogen assay is based on converting glycogen into glucose and utilizing a bioluminescent NAD(P)H detection method to measure the released glucose. The bioluminescent NAD(P)H technology14 has previously been applied for the sensitive detection of various cellular metabolites and is compatible with automated systems and high-throughput screening processes.15,16
In this paper, we describe the development of a high-throughput method for measuring glycogen to enable glycogen metabolism research and the characterization of compounds for their ability to inhibit glycogen synthesis in cell-based systems. Multiple GYS1 inhibitors were used to optimize and then validate the method during development, including MZ-101, which was recently published in a study demonstrating its ability to selectively inhibit GYS1, reducing accumulated glycogen in a mouse model of Pompe, and demonstrating the potential therapeutic efficacy of SRT for the treatment of Pompe disease.12 Our results validate the bioluminescent method as a robust assay to quantify changes in cellular glycogen levels supporting the utility of this assay both as a screening paradigm to identify modulators of glycogen levels and for studying pathways of glycogen metabolism.
Results and Discussion
Glycogen Assay Principle and Performance
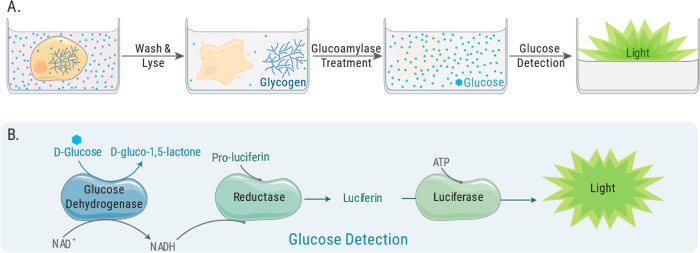
The bioluminescent glycogen assay quantitates cellular glycogen after cell lysis and subsequent enzyme conversion of glycogen into glucose. The assay uses glucoamylase to enzymatically digest glycogen into glucose monomers followed by glucose measurement (Figure 1A). Glucose measurement is achieved through coupled-enzyme reactions by adding glucose dehydrogenase and NAD to a bioluminescent system for detecting the produced NADH, providing a sensitive and specific measurement of glycogen-derived glucose (Figure 1B). The result is a light signal directly proportional to the amount of glycogen in the sample. Both the glucose dehydrogenase and bioluminescent NADH detection reactions occur simultaneously within a single “glucose detection reagent” allowing for glucose measurement in a single step.
Figure 1.
Schematic of the process for glycogen detection using the bioluminescent method. (A) Cells are washed and lysed before glycogen is digested into glucose monomers for subsequent glucose detection. (B) Bioluminescent assay for detecting released glucose. Glucose dehydrogenase and excess NAD are added to the NADH detection system. Pro-luciferin is converted into the luciferase substrate luciferin in the presence of reductase and NADH.
When measuring glycogen in cells and other biological samples, the presence of basal glucose must be considered. The addition of glucoamylase is a key step for distinguishing the signal originating from glycogen and the signal originating from basal glucose levels in cells and tissues. To determine the amount of glycogen in samples that also contain glucose, two parallel reactions are performed: one with glucoamylase and one without glucoamylase. The glycogen-specific signal is obtained by subtracting the “no glucoamylase” reaction signal from the signal of the glucoamylase-treated reaction.
In addition to basal glucose levels, commonly used cell culture media also contains high levels of glucose that will contribute to the assay signal, requiring washing steps before conducting measurements. Once the excess glucose has been removed, the cells can be lysed (Figure 1A). We use strong acidic conditions to lyse cells. This lysis method also achieves minimal assay background by aiding in (1) cellular enzyme inactivation, including endogenous dehydrogenases, which might produce NADH from the NAD added to the glucose detection reagent and (2) cellular NADH and NADPH degradation. Though endogenous levels of NADH and NADPH are low, their removal ensures lowest assay background and greatest sensitivity.
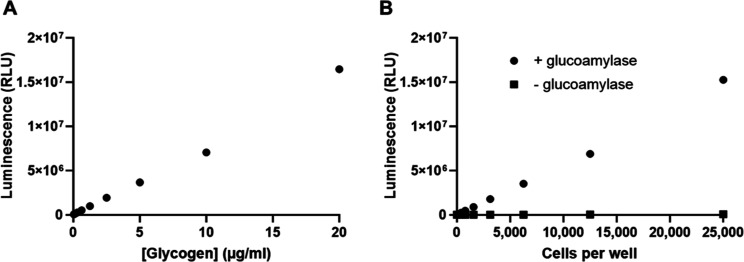
Key parameters of the glycogen assay were determined using a titration of purified glycogen. The assay was linear over a 100-fold range of 0.02 to 20 μg/mL (Figure 2A). There was no signal above background in the absence of glucoamylase. The assay had a signal-to-background of 1.4 and a signal-to-noise ratio of 18 at the lowest concentration tested (0.02 μg/mL), which confirmed its high sensitivity (Figure S1). Based on reported values,17 this was calculated to be a suitable range for measuring glycogen in cells cultured in 96- and 384-well plates.
Figure 2.
Detection of glycogen. (A) Titration of a purified stock of glycogen. Twofold serial dilutions of glycogen were prepared in PBS. Aliquots (25 μL) of each dilution were transferred to quadruplicate wells of a 96-well plate and assayed as described in the Methods section. Luminescence was recorded as relative light units (RLU). Average RLU are plotted. Error bars are ±1 SD. Percent CVs were ≤5%. (B) Titration of HeLa cells for glycogen measurement in the presence and absence of glucoamylase. HeLa cells were cultured in a complete growth medium overnight before washing and cell lysis. The cell lysates were diluted twofold and the lysed cell equivalents per well are plotted on the x-axis. Each data point represents the average of three replicates. Error bars are ±1 SD.
Measurement and Modulation of Glycogen Levels in HeLa Cells
In this study, we aimed to develop a high-throughput method for glycogen detection in mammalian cells. Glycogen levels vary across different cell types17 and are influenced by media composition, especially glucose availability. HeLa cells are a very commonly used adherent cell line for biological research and screening tool for drug development; it is for these reasons we chose HeLa cells as the model system to develop the assay. To measure the range of glycogen that could be detected in HeLa cells, cells were grown in complete DMEM growth medium containing 25 mM glucose and subsequently washed in PBS, counted, and lysed as described in the Methods section. After lysis, the cell lysate was serially diluted by twofold, and 25 μL of each dilution was added (per well) to a 96-well assay plate for glycogen measurement. A glycogen standard curve was included on the same assay plate for glycogen quantification.
The glycogen assay detected cellular glycogen present in as few as 300 cells and up to 25,000 cells in a linear manner (Figure 2B). Parallel reactions lacking glucoamylase were performed to detect cellular glucose. As observed previously with other cancer cell lines,15 the glucose levels were not above assay background (Figure 2B) presumably due to its rapid conversion into glucose 6-phosphate in the cell. Given that the basal glucose concentrations were below the detectable range, the glycogen content in the cell lysates could be calculated directly from the readings of the glucoamylase-treated samples. The amount of glycogen in 25 μL lysate containing 25,000 cells was calculated to average 19 μg/mL, corresponding to approximately 19 pg/cell.
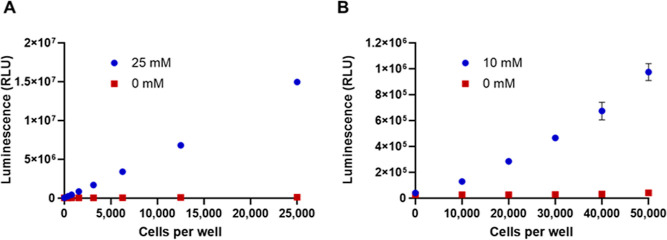
Our goal was to develop a sensitive assay with a large dynamic range that could be used to measure glycogen levels in cells grown in 384-well plates with the aim of applying this method as a screening tool to support identification and characterization of small molecule modulators of glycogen synthesis and breakdown. To optimize the assay window, we analyzed changes in glycogen levels in response to varied glucose concentrations in culture media. HeLa cells were incubated overnight in flasks with culture medium containing either 25 mM glucose, the same concentration in complete DMEM growth medium, or starvation medium containing 0 mM glucose; cells were then harvested and processed for the assay. As shown in Figure 3A, glycogen was dramatically depleted in cells cultured without glucose. Glycogen levels for 25,000 cells dropped 112-fold from 19 to 0.17 μg/mL (Figure 3A). The 0.17 μg/mL concentration was still detectable above assay background which illustrates the importance of assay sensitivity to observe the full range of glycogen levels and not limit signal windows.
Figure 3.
Modulation of glycogen in HeLa cells. (A) HeLa cells were cultured overnight in flasks in either medium with 25 mM glucose or medium lacking glucose (0 mM glucose) and then assayed for glycogen. The number of lysed cell equivalents assayed per well of a 96-well plate is indicated on the x-axis. (B) After an overnight starvation in flasks, HeLa cells were collected and washed and plated in the wells of a 96-well plate at the indicated cell number per well. They were then incubated overnight in the presence of medium containing 10 or 0 mM glucose before the glycogen assay. In both panels, each data point represents the average of quadruplicate wells. Error bars are ±1 SD.
When glycogen depleted cells were reintroduced to medium containing glucose, glycogen reaccumulated (Figure 3B). Reaccumulated glycogen levels were dependent on the glucose concentration in the culture medium (Figure S2). Considering that the glucose in medium needs to be removed by washing before glycogen measurements, we chose a concentration (10 mM) for future experiments that could be removed with the least washing and still result in high glycogen accumulation. Though glycogen was restored in cells during the overnight incubation, it did not reach the levels previously observed in cells grown in complete growth medium that had not been starved (Figure 2B). Wells with 30,000 cells contained 0.59 μg/mL glycogen, ∼32-fold less than observed with cells cultured in a complete medium. However, despite the lower levels, good signal windows were maintained. The ratios of signals from the 10 and 0 mM glucose samples were 23, 16, and 11 with 50,000 cells, 30,000 cells, and 20,000 cells per well, respectively.
Development of Automated Protocol for Glycogen Detection
Automation and miniaturization of the bioluminescent glycogen assay are key for high-throughput applications, such as compound screening. The accurate detection of intracellular glycogen relies on the enzymatic conversion of glycogen into glucose and the distinction between glucose originating from glycogen versus basal and media glucose. Therefore, medium removal and washing steps are critical. For instance, when cells are cultured in medium containing 10 mM glucose, the glucose concentration must be reduced by approximately 10,000-fold to ≤1 μM to have accurate intracellular glycogen measurement. Incomplete glucose removal can lead to high background and increased well-to-well variability. In addition, successive washing steps must not disrupt the cell monolayer which would result in cell loss.
To optimize glucose removal and washing steps, HeLa cells were dispensed into 384-well plates at densities of 15,000 and 7500 cells per well using a Multidrop Combi nL Reagent dispenser and allowed to adhere overnight to ensure a stable cell monolayer formation. The following day, the medium was removed, and cells were washed with PBS using a Tecan Freedom EVO liquid handling system equipped with a MultiChannel Arm (MCA) 384. The washing steps were optimized by evaluating different tip heights and aspiration/dispensing speeds. The efficiency of glucose elimination from the wells was assessed by measuring glucose levels in the washing solution after completing the cell wash cycles. Furthermore, to evaluate the impact of the washing protocol on cell viability and adherence, the CellTiter-Glo Luminescent Cell Viability Assay (CellTiter-Glo Assay) was employed postwash. The results indicated that performing eight wash cycles with the liquid handling tips set at a height of approximately 1.5–2 mm from the bottom of the well, combined with an aspiration and dispensing speed of 20 μL/s, achieved the most efficient glucose removal with a minimal effect on the cell monolayer (Figure S3).
The performance of the automated assay was further validated by measuring glycogen in HeLa cells plated at 20,000 cells per well in 384-well plates. To monitor the well-to-well variability, 24 wells at different plate positions were used. The cells were plated, incubated overnight, washed, and lysed. Glucoamylase was added and after digestion, a small volume (8 μL) was transferred to a 384-well low volume (LV) plate for the glycogen assay. An aliquot was also transferred to a second 384-well LV plate for viability readings. Residual glucose from media and basal intracellular glucose (previously shown to be not detectable) were measured in a parallel reaction without glucoamylase.
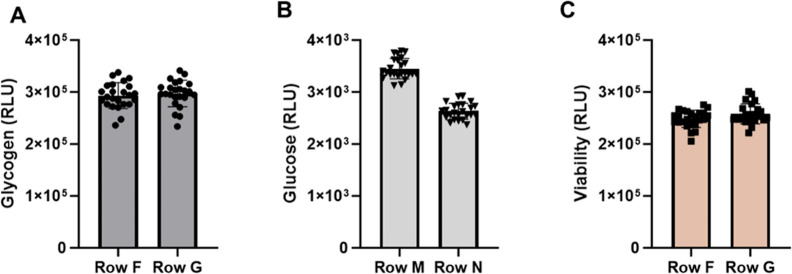
As shown in Figure 4, the optimized washing protocol efficiently reduced extracellular glucose to background levels (Figure 4B). A 100-fold increase in signal was measured in glucoamylase-treated samples with low well-to-well variability (Percent CVs were ∼9%; Figure 4A), while maintaining the cell monolayer and viability (Figure 4C).
Figure 4.
Performance of the automated protocol. The steps in the method were validated using HeLa cells plated in 384-well plates in medium containing 10 mM glucose. The cell density was 20,000 cells per well. Each row contained 24 wells. After washing and cell lysis several parameters were checked. (A) Glycogen measurement in cell lysates. (B) Measurement of basal and residual glucose. For glucose measurements, the glucoamylase enzyme was not included. (C) ATP measurement in cell lysates using the CellTiter-Glo Assay.
Assay Optimization to Evaluate GYS1 Inhibitors
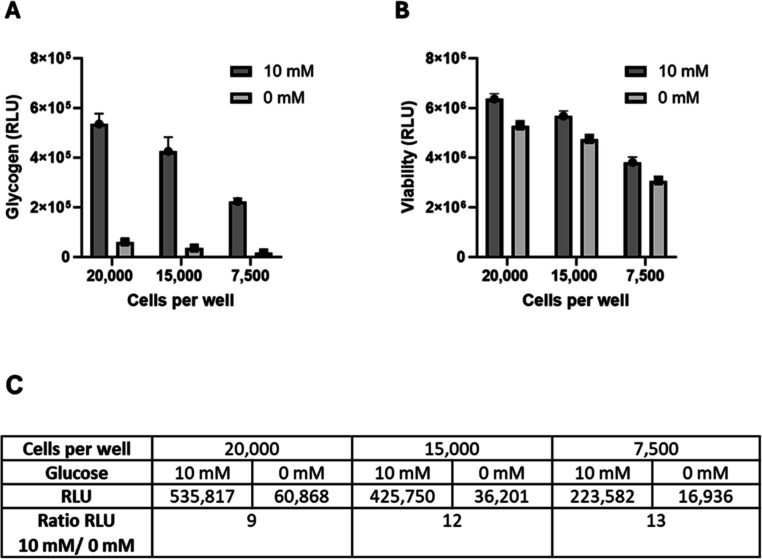
To support quantification of IC50 values for compounds designed to inhibit newly synthesized glycogen, growth conditions of the HeLa cells were adapted to provide a robust assay window. Briefly, this involved growing the cells in a glucose-free medium to first deplete glycogen stores followed by replenishment of glucose media with or without small molecule inhibitors of GYS1. This approach was not only well tolerated by the cells but importantly, it led to a robust increase in the dynamic range of the assay. To further streamline the high-throughput screening workflow and avoid an in-plate wash step, the cells were cultured in glucose-free conditions overnight in flasks and were washed in bulk before dispensing into 384-well plates in media with 10 mM or 0 mM glucose. Figure 5 shows glycogen data for HeLa cells plated at 3 densities, 20,000, 15,000, and 7500 cells per well. The final conditions were determined by evaluating the dynamic range of glycogen as a function of cell density (Figure 5A) and cell viability (Figure 5B). While 20,000 cells per well had the highest amount of glycogen per well, the level in 20,000 starved cells was also higher, narrowing the signal window (Figure 5C). Therefore, a density of 15,000 cells per well was selected for further studies. A viability assay, the RealTime-Glo MT Cell Viability Assay (RealTime-Glo Assay;18), was incorporated into the final protocol to serve as an indicator of both cell health and well-to-well cell plating consistency (Figure 5B).
Figure 5.
Optimization of cell density. Multiple cell densities were tested to optimize the signal window between cells grown in the presence of 10 mM glucose and those grown in the absence of glucose (0 mM). Cell densities were 20,000, 15,000, and 7500 cells per well, in 384-well plates (40 wells each). (A) Measurement of glycogen for three cell densities in two media. (B) Cell viability after incubation but prior to cell washing and lysing using the RealTime-Glo Assay. (C) Average RLU values and the ratio of RLU values from cells grown in 10 and 0 mM glucose. The average RLU are plotted. Error bars = ±1 SD.
Assay Validation with Small Molecule Inhibitors of GYS1
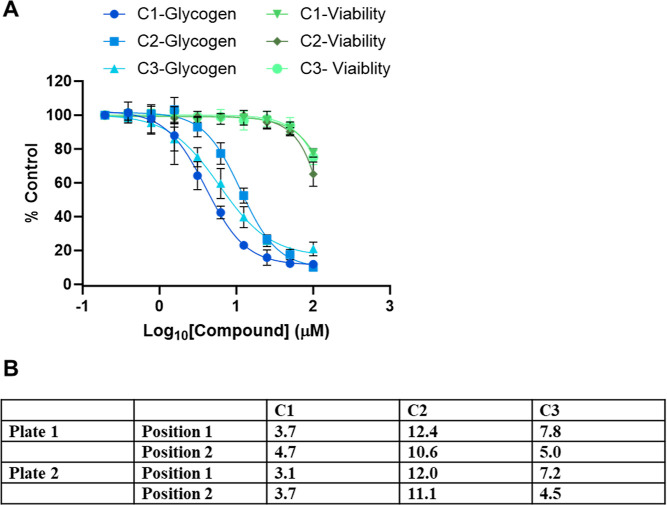
Recently, Ullman et al.12 reported on the synthesis and preclinical characterization of the small molecule MZ-101, a potent and selective inhibitor of GYS1 in vitro and in vivo. To validate the glycogen assay for high-throughput applications, we applied the optimized protocol (Table S1) using three compounds that were also shown to inhibit recombinant GYS1 in a biochemical assay (data not shown; 19). The three compounds (referred to as model compounds C1, C2, and C3) were tested in dose–response curves using serial twofold dilutions starting at 100 μM (final concentration) with a final concentration of 1% DMSO. The compounds were incubated with the cells during the glucose repletion step for 24 h before cells were lysed and glycogen levels measured. To evaluate intra- and interplate variability, each compound was tested in two different plates in two positions on each plate for a total of four experimental replications per compound. All compounds inhibited glycogen accumulation in a dose-dependent manner (Figure 6A) with low position and plate variability. Data from the assay were used to derive IC50 values for all three compounds: 3.1 to 4.7 μM, 4.5 to 7.8 μM, and 10.6 to 12.4 μM for compounds C1, C3, and C2, respectively (Figure 6B). The RealTime-Glo Assay results verified that the decrease in glycogen levels was not attributable to compound toxicity or reduced cell growth and thus was due to inhibition of glycogen synthesis. A decline in cell viability was observed only at the highest 100 μM concentration, with viability percentages of 77, 65, and 75% obtained with compounds C1, C2, and C3, respectively (Figure 6A).
Figure 6.
Control compound effects on glycogen levels. Twofold serial dilutions of each of the three compounds were made in medium starting at 100 μM (final concentration in well with cells). A total of 10 concentrations were tested in quadruplicate. Each of the three control compounds was tested in two positions on plate 1 and two positions on plate 2. (A) Percent glycogen inhibition and percent viability for each inhibitor. The four sets of data for each inhibitor were averaged. The results are expressed as percent of the control cells incubated in glucose in the absence of inhibitor. (B) IC50 values (μM) calculated from the four individual sets of data for each inhibitor.
Validation of the Assay for High-Throughput Screening of GYS1 Inhibitors
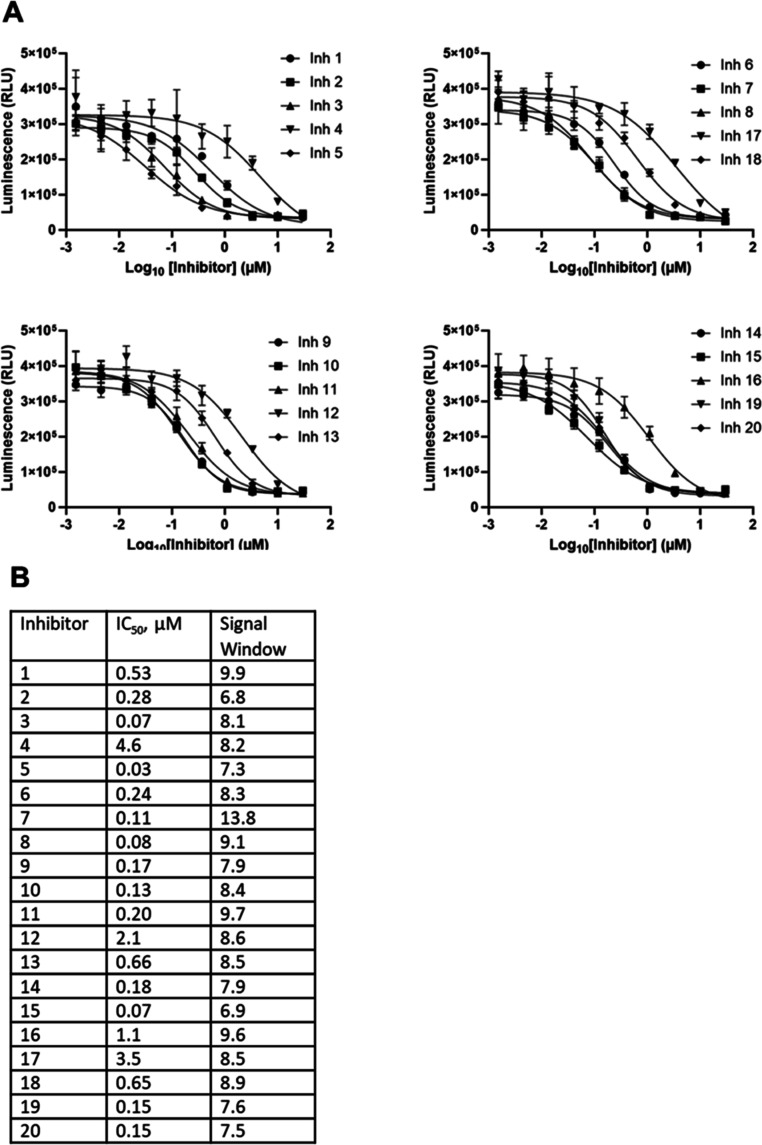
To further validate the method by determining if the assay could distinguish compounds of different potencies, we expanded our study and screened 20 additional compounds found to have a range of inhibitory activities in the biochemical assay, including MZ-101.12,19 Four 384-well plates were used for the screen. Each plate contained five test compounds and included reference compound C1 as a quality control. The layouts of the compound dilution 96-well plates and corresponding 384-well assay plates are shown in Supporting Information, Figure S4. The screening protocol is outlined in Table S1. All compounds were active and inhibited glycogen synthesis in a dose-dependent manner in cells (Figure 7A). The compounds exhibited different potencies with IC50 values ranging from 0.07 to 4.6 μM (Figure 7B). The signal window for each compound was calculated as a ratio of light units at high and low compound concentrations. All compounds had signal windows ≥5 and the ratios ranged from 6.8 to 13.8 (Figure 7B). The test compounds had only a slight effect on cell viability, with <20% cell death at the highest concentration, except for 1 of the 20 compounds which had >60% cell death at the highest concentration (data not shown). Each assay plate incorporated quality controls which were used to qualitatively evaluate the overall performance of the assay including: a titration of control compound C1, vehicle (DMSO only)- treated cells grown in starvation medium, and vehicle- treated cells grown in glucose-containing medium. The IC50 values for compound C1 across the four test plates were 3.1, 3.2, 3.1, and 3.5 μM, which aligned with the IC50 values obtained during the small-scale screening tests (Figure S5).
Figure 7.
Dose–response curves for 20 GYS1 inhibitors and their IC50 values. Threefold serial dilutions of each of the 20 compounds were made in medium starting at 30 μM (final concentration in well with cells). A total of 10 concentrations were tested in quadruplicate. Five inhibitors were tested per plate, for a total of four plates. (A) Dose–response curves for each inhibitor. The average RLU are plotted. Error bars are ±1 SD (B) IC50 values and signal windows calculated for each of the inhibitors.
The assay’s robustness was further validated by a calculated Z′ factor of 0.74 (Figure 8; 20). This value was derived from comparing luminescence between starved cells and those returned to glucose-containing medium across all four plates. The Z′ values for the four screening plates were 0.81, 0.79, 0.79, and 0.78 for plates 1 through 4, respectively, demonstrating excellent assay quality and reproducibility. Also, the average RLU value for starved cells was above the assay background (35,519 ± 6407 as compared to 11,111 ± 1788) an important feature for inhibitor screening necessary to observe maximum inhibition. The average RLU value for cells in 10 mM glucose was 350,201 ± 21,184, resulting in an assay window of 9.9-fold (Table S2). The 20-compound screen showcases the assay’s ability to discern compounds with IC50 values ranging from nanomolar to micromolar (30 nM to 12.4 μM) values. The assay shows robustness across multiple plates while maintaining high reproducibility and consistency in IC50 determinations.
Figure 8.
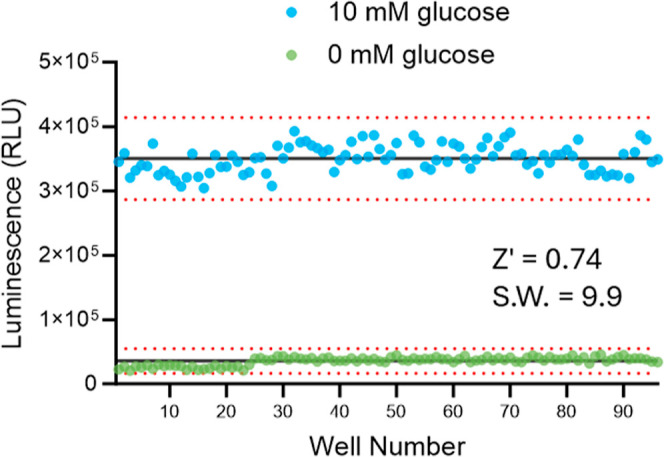
Z′ factor for the automated glycogen detection assay. Light signals from control wells containing cells plated in 10 mM glucose or 0 mM glucose are plotted. Each of the four assay plates had 24 wells of each control for a total of 96 wells (well number). The data were used to calculate the Z′ value and the signal window (S.W.; ratio of 10 mM/0 mM average RLU). The dotted lines are ±3 SD for each data set.
Conclusions
New therapies for rare and common metabolic diseases have led to a resurgence of interest in technologies to monitor glycogen metabolism. The development and validation of the novel bioluminescent assay reported herein highlights a new tool for the study of glycogen metabolism and its dysregulation in disease states. The assay successfully characterized a series of GYS1 inhibitors, including MZ-101,12 supporting its application in additional screening efforts for more efficient selection and development of potential SRTs for the treatment of patients with Pompe disease. HeLa cells were chosen as a model system for optimization and the method is applicable to other cell lines that contain glycogen, as we have measured glycogen in other cell types including primary human fibroblasts and mouse PBMCs.12 The sensitivity of the assay allows measurements over a wide range of glycogen levels, potentially accommodating a variety of cells.17 For HeLa cells, the Z′ factor (i.e., calculated based on glycogen levels in the absence of compounds) was 0.74 with a signal window of 9.9 (Figure 8), but a Z′ factor of 0.5 is acceptable,20 and is achievable with narrower signal windows. Our results demonstrate the assay’s sensitivity and specificity in quantifying cellular glycogen levels across a wide dynamic range. Scalability and compatibility with automation allowed us to develop a method suitable for high-throughput screening, making it a valuable tool for both basic science research as well as drug discovery.
Methods
Cell Culture
HeLa cells (ATCC Cat. no. CCL-2) were stored in liquid nitrogen. For experiments, cells were thawed and used at passage number ≤15 post-thaw. Cells were propagated in 15 mL of complete growth medium consisting of DMEM (Gibco Cat. no. 11995-065) and 10% FBS (VWR Cat. no. 89510-194) in T75 flasks. For growth at defined glucose concentrations, DMEM minus glucose, glutamine, pyruvate, and phenol red (Gibco Cat. no. A14430-01) supplemented with 10% FBS and 1X GlutaMax Supplement (Gibco Cat. no. 35050-061) was used as a base medium. Glucose (diluted from Gibco Cat. no. A24940-01) was added to the base medium to achieve the concentrations indicated in each experiment. For the starvation medium, no glucose was added (0 mM glucose). For the recovery medium, 20 mM glucose was added, resulting in 10 mM glucose final concentration when added to cells at a 1:1 ratio (v/v). All media used for compound dilutions contained 20 mM glucose and 2% DMSO (Sigma Cat. no. D2650-5 × 5 mL).
Glycogen Detection Assay
Glycogen was measured using the Glycogen-Glo Assay (Promega Cat. no. J5051) following the manufacturer’s instructions. Briefly, before measuring cellular glycogen, medium was removed, and cells were washed with PBS (Dulbecco’s Phosphate Buffered Saline; Gibco Cat. no. 14190-144) to remove residual glucose from the medium. Cells were then lysed by adding 0.3 N HCl, followed by the addition of 450 mM Tris pH 8.0. The recommended volume ratio of cells in PBS to acid and base is 1:0.5:0.5. Glucoamylase solution was prepared by diluting glucoamylase enzyme in glucoamylase buffer (100 mM sodium acetate, pH 5.2) and added to the cell lysate at a 1:1 volume ratio (e.g., 25 μL of glucoamylase solution added to 25 μL of cell lysate in a 96-well plate or 30 μL added to 30 μL cell lysate in a 384-well plate). The digestion reaction continued for 1 h at room temperature at which time an equal volume of glucose detection reagent [containing glucose dehydrogenase, NAD, and the components of the bioluminescent NAD(P)H detection technology] was added. Luminescence was recorded after 90 min at room temperature. For the automated cell-based experiments presented in this paper, two modifications were made: the cell lysates for the automated protocol were frozen at −20 °C overnight before the glucoamylase was added and (2) the glucoamylase reaction was incubated for 1 h at 37 °C.
Automated Protocol
For the automated protocol, cells were plated in 384-well tissue culture-treated microplates (Corning Cat. no. 3707, clear bottom, white-walled). Cells were dispensed into 384-well plates using a MultiDrop Combi nL Reagent Dispenser (Thermo Fisher Scientific). Cell culture medium was removed and cells were washed with PBS using a Tecan Freedom EVO Robotic Platform equipped with the MCA 384. The MCA 384 was used to add HCl and Tris, and transfer the 8 μL aliquots of cell lysates. The glucoamylase solution, glucoamylase buffer, glucose detection reagent, and viability reagents were dispensed using the Multidrop Combi nL Reagent Dispenser. Bioluminescent assays were performed in 384-well LV plates (Corning no. 4512, white, opaque plates). Luminescence was recorded using a Tecan infinite M200 PRO Multiplate Reader.
To optimize the automated protocol, cells were dispensed at the cell densities indicated for each experiment and incubated overnight in a 50 μL recovery or starvation medium. The next day, media were removed and the cells were washed with 70 μL of PBS per wash cycle. At the end of the washing protocol, ∼15 μL of PBS remained in the wells. Acid, 7.5 μL of 0.3 N HCl, was added per well, followed by the addition of 7.5 μL of 450 mM Tris pH 8.0. Plates with cell lysates were sealed and stored overnight at −20 °C. The following day, 30 μL of glucoamylase solution was added per well. After digestion, 8 μL of was transferred to a 384-well LV plate and 8 μL of glucose detection reagent was added for glucose measurements.
The effectiveness of the washing protocol was assessed by monitoring glucose levels in parallel wells. In this case, 30 μL of glucoamylase buffer without glucoamylase was added to the cells. A sample (8 μL) was transferred to a 384-well LV plate for glucose measurement. A cell viability assay was included to confirm that cells were not dislodged and lost during the washing protocol. An additional 8 μL of cell lysate was transferred to a 384-well LV plate and ATP was measured by adding 8 μL of CellTiter-Glo Luminescent Cell Viability Assay (Promega Cat. no. G7571).
Screening Protocol
Cells were propagated overnight in a starvation medium in T75 flasks. Cells were collected (using trypsin/EDTA), washed with PBS, and dispensed in starvation media at 15,000 cells in 25 μL per well of a 384-well plate. Small molecule inhibitors (≥95% purity) were provided by Maze Therapeutics and were prepared using previously reported methods.19,21,22 The compounds were supplied as 10 mM stocks in DMSO and were each assayed in 10-point dose–response curves. The three control compounds were diluted to 200 μM and serially diluted twofold. The 20 additional compounds were diluted to 60 μM and serially diluted threefold. All compound dilutions were in recovery medium containing 20 mM glucose and 2% DMSO. Each dilution (25 μL) was added to quadruplicate wells of the 384-well plate containing dispensed cells. Cells were incubated for 24 h in a cell culture incubator (37 °C, 5% CO2). Before removing medium and washing cells with the above automated protocol, cell viability was measured using the RealTime-Glo MT Cell Viability Assay (Promega Cat. no. G9713) following the manufacturer’s instructions. Briefly, a 5× stock of reagent was prepared, 10 μL was added per well, and the plate was incubated at 37 °C for 30 min before reading luminescence. Media were then removed, and the cells were washed using the automated protocol. Glycogen was measured using the automated protocol described above.
Acknowledgments
The authors wish to acknowledge colleagues in the Promega R&D Department and at Maze Therapeutics for their input and support. This project was funded by Promega Corporation and Maze Therapeutics.
Supporting Information Available
The Supporting Information is available free of charge at https://pubs.acs.org/doi/10.1021/acsomega.4c04190.
Glycogen detection assay performance; glycogen accumulation as a function of glucose concentration; validation of the automated protocol; layout of the inhibitor dilution and cell-based screening plates; performance of quality control compound C1 during screening; outline of automated screening protocol; and summary of data for the experiment in Figure 8 (PDF)
Author Present Address
§ Ideaya Biosciences, South San Francisco, California, 94080, United States
Author Present Address
∥ Totus Medicines, Emeryville, California, 94608, United States.
Author Contributions
Conceptualization: D.L., R.C., H.M., D.T.B., and J.V. Experiment Design: D.L., R.C., G.V., H.M., D.T.B., and J.V. Experimentation: D.L., R.C., G.V., H.M., K.T.M., and J.V. Data Analysis: D.L., G.V., and J.V. Writing—Original Draft and Editing: D.L., R.C., J.C.U., and J.V. Writing—Review: D.L., R.C., G.V., H.M., K.T.M., D.T.B., J.C.U., and J.V.
The authors declare the following competing financial interest(s): This work was supported by Promega Corporation and Maze Therapeutics. D.L., G.V., J.V. are employees of Promega Corporation. R.C., H.M. are former employees and shareholders of Maze Therapeutics. J.C.U., D.T.B., K.M. are current employees and shareholders of Maze Therapeutics. The authors declare no other competing financial interests.
Supplementary Material
References
- Roach P. J.; Depaoli-Roach A. A.; Hurley T. D.; Tagliabracci V. S. Glycogen and its metabolism: some new developments and old themes. Biochem. J. 2012, 441, 763–787. 10.1042/BJ20111416. [DOI] [PMC free article] [PubMed] [Google Scholar]
- Roach P. J. Glycogen and its metabolism. Curr. Mol. Med. 2002, 2 (2), 101–120. 10.2174/1566524024605761. [DOI] [PubMed] [Google Scholar]
- Tefera T. W.; Steyn F. J.; Ngo S. T.; Borges K. CNS glucose metabolism in amyotrophic lateral sclerosis: A therapeutic target?. Cell Biosci. 2021, 11, 14. 10.1186/s13578-020-00511-2. [DOI] [PMC free article] [PubMed] [Google Scholar]
- Zois C. E.; Favaro E.; Harris A. L. Glycogen metabolism in cancer. Biochem. Pharmacol. 2014, 92, 3–11. 10.1016/j.bcp.2014.09.001. [DOI] [PubMed] [Google Scholar]
- Khan T.; Sullivan M. A.; Gunter J. H.; Kryza T.; Lyons N.; He Y.; Hooper J. D. Revisiting glycogen in cancer: A conspicuous and targetable enabler of malignant transformation. Front. Oncol. 2020, 10, 592455. 10.3389/fonc.2020.592455. [DOI] [PMC free article] [PubMed] [Google Scholar]
- Shulman G. I.; Rothman D. L.; Jue T.; Stein P.; DeFronzo R. A.; Shulman R. G. Quantitation of muscle glycogen synthesis in normal subjects and subjects with non-insulin-dependent diabetes by 13C nuclear magnetic resonance spectroscopy. N. Engl. J. Med. 1990, 322 (4), 223–228. 10.1056/nejm199001253220403. [DOI] [PubMed] [Google Scholar]
- Hannah W. B.; Derks T. G. J.; Drumm M. L.; Grünert S. C.; Kishnani P. S.; Vissing J. Glycogen Storage diseases. Nat. Rev. Dis. Primers 2023, 9, 46. 10.1038/s41572-023-00456-z. [DOI] [PubMed] [Google Scholar]
- van der Ploeg A. T.; Reuser A. J. J. Pompe’s disease. Lancet 2008, 372 (9646), 1342–1353. 10.1016/s0140-6736(08)61555-x. [DOI] [PubMed] [Google Scholar]
- Meena N. K.; Raben N. Pompe disease: New developments in an old lysosomal storage disorder. Biomolecules 2020, 10 (9), 1339. 10.3390/biom10091339. [DOI] [PMC free article] [PubMed] [Google Scholar]
- Zois C. E.; Harris A. L. Glycogen metabolism has a key role in the cancer microenvironment and provides new targets for cancer therapy. J. Mol. Med. 2016, 94, 137–154. 10.1007/s00109-015-1377-9. [DOI] [PMC free article] [PubMed] [Google Scholar]
- Coutinho M. F.; Santos J. I.; Alves S. Less is more: Substrate reduction therapy for lysosomal storage disorders. Int. J. Mol. Sci. 2016, 17, 1065. 10.3390/ijms17071065. [DOI] [PMC free article] [PubMed] [Google Scholar]
- Ullman J. C.; Mellem K. T.; Xi Y.; Ramanan V.; Merritt H.; Choy R.; Gujral T.; Young L. E. A.; Blake K.; Tep S.; Homburger J. R.; O’Regan A.; Ganesh S.; Wong P.; Satterfield T. F.; Lin B.; Situ E.; Yu C.; Espanol B.; Sarwaikar R.; Fastman N.; Tzitzilonis C.; Lee P.; Reiton D.; Morton V.; Santiago P.; Won W.; Powers H.; Cummings B. B.; Hoek M.; Graham R. R.; Chandriani S. J.; Bainer R.; DePaoli-Roach A. A.; Roach P. J.; Hurley T. D.; Sun R. C.; Gentry M. S.; Sinz C.; Dick R. A.; Noonberg S. B.; Beattie D. T.; Morgans D. J. Jr.; Green E. M. Small-molecule inhibition of glycogen synthase 1 for the treatment of Pompe disease and other glycogen storage disorders. Sci. Transl. Med. 2024, 16 (730), eadf1691 10.1126/scitranslmed.adf1691. [DOI] [PMC free article] [PubMed] [Google Scholar]
- Tang B.; Frasinyuk M. S.; Chikwana V. M.; Mahalingan K. K.; Morgan C. A.; Segvich D. M.; Bondarenko S. P.; Mrug G. P.; Wyrebek P.; Watt D. S.; DePaoli-Roach A. A.; Roach P. J.; Hurley T. D. Discovery and development of small-molecule inhibitors of glycogen synthase. J. Med. Chem. 2020, 63 (7), 3538–3551. 10.1021/acs.jmedchem.9b01851. [DOI] [PMC free article] [PubMed] [Google Scholar]
- Zhou W.; Leippe D.; Duellman S.; Sobol M.; Vidugiriene J.; O’Brien M.; Shultz J. W.; Kimball J. J.; DiBernardo C.; Moothart L.; Bernad L.; Cali J.; Klaubert D. H.; Meisenheimer P. Self-immolative bioluminogenic quinone luciferins for NAD(P)H assays and reducing capacity-based cell viability assays. ChemBioChem 2014, 15 (5), 670–675. 10.1002/cbic.201300744. [DOI] [PubMed] [Google Scholar]
- Leippe D.; Sobol M.; Vidugiris G.; Cali J. J.; Vidugiriene J. Bioluminescent assays for glucose and glutamine metabolism: High-throughput screening for changes in extracellular and intracellular metabolites. SLAS Discovery 2017, 22 (4), 366–377. 10.1177/1087057116675612. [DOI] [PubMed] [Google Scholar]
- Vidugiriene J.; Leippe D.; Sobol M.; Vidugiris G.; Zhou W.; Meisenheimer P.; Gautam P.; Wennerberg K.; Cali J. J. Bioluminescent cell-based NAD(P)/NAD(P)H assays for rapid dinucleotide measurement and inhibitor screening. Assay Drug Dev. Technol. 2014, 12 (9–10), 514–526. 10.1089/adt.2014.605. [DOI] [PMC free article] [PubMed] [Google Scholar]
- Rousset M.; Zweibaum A.; Fogh J. Presence of glycogen and growth-related variations in 58 cultured human tumor cell lines of various tissue origins. Cancer Res. 1981, 41 (3), 1165–1170. [PubMed] [Google Scholar]
- Duellman S. J.; Zhou W.; Meisenheimer P.; Vidugiris G.; Cali J. J.; Gautam P.; Wennerberg K.; Vidugiriene J. Bioluminescent, nonlytic, real-time cell viability assay and use in inhibitor screening. Assay Drug Dev. Technol. 2015, 13 (8), 456–465. 10.1089/adt.2015.669. [DOI] [PMC free article] [PubMed] [Google Scholar]
- Morgans D. J. Jr.; Mellem K.; Powers H. L.; Lee P. S. T.; Won W.; Sinz C. J.. Inhibitors of Glycogen Synthase 1 (GYS1) and Methods of Use Thereof. WO 2022198196 A1, September 22, 2022.
- Zhang J. H.; Chung T. D.; Oldenburg K. R. A simple statistical parameter for use in evaluation and validation of high throughput screening assays. J. Biomol. Screening 1999, 4 (2), 67–73. 10.1177/108705719900400206. [DOI] [PubMed] [Google Scholar]
- Morgans D. J. Jr.; Mellem K.; Powers H. L.; Lee P. S. T.; Won W.; Sinz C. J.. Cycloalkyl Carboxylic Acid Derivatives as Inhibitors of Glycogen Synthase 1 (GYS1) and Methods of Use Thereof. WO 2024059659 A1, March 21, 2024.
- Morgans D. J. Jr.; Mellem K.; Powers H. L.; Lee P. S. T.; Won W.; Sinz C. J.. N-(benzhydryl)cycloalkylcarboxamide Derivatives as Inhibitors of Glycogen Synthase 1 (GYS1) and Methods of Use Thereof. WO 2024059661 A1, March 21, 2024.
Associated Data
This section collects any data citations, data availability statements, or supplementary materials included in this article.


